

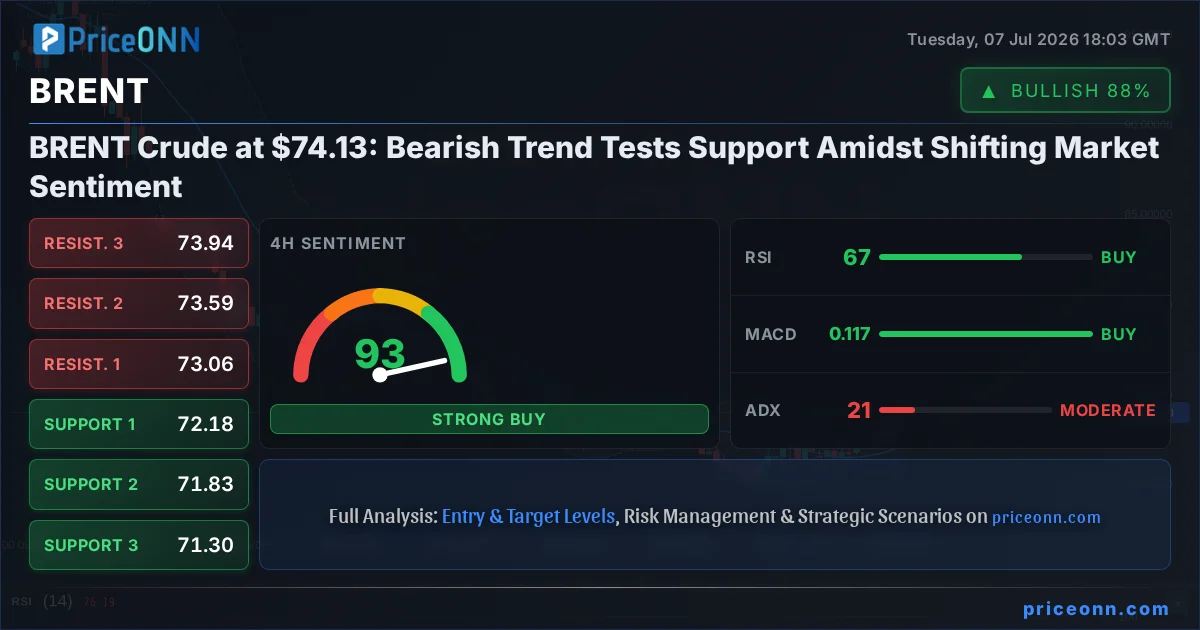
The price of BRENT Crude, currently hovering around $74.13, is navigating a critical juncture as a prevailing bearish trend intensifies its test of support levels. This pivotal moment demands a close examination of the underlying technical signals and broader market correlations that are shaping the immediate outlook for this vital energy commodity. The $74.13 mark, a level that has seen significant intraday volatility, now acts as a focal point for traders assessing the potential for a sustained downturn or a tactical rebound.
- BRENT Crude is trading at $74.13, with a bearish trend currently testing support at $73.81.
- The 1-hour chart shows a strong bullish signal (Al: 7, Sat: 1), but daily indicators suggest a bearish outlook (Sat: 6, Al: 2).
- RSI at 75.36 on the 1-hour chart indicates overbought conditions, suggesting potential for a pullback.
- ADX readings across timeframes show mixed trend strengths, from weak (1H: 13.36) to strong (1D: 43), complicating the directional bias.
- Correlation with DXY, currently at 100.95, and equity markets like S&P 500 (6572.87) adds complexity to the energy price outlook.
The Shifting Sands of BRENT's Technical Landscape
A Tale of Two Timeframes: 1H vs. 1D Divergence
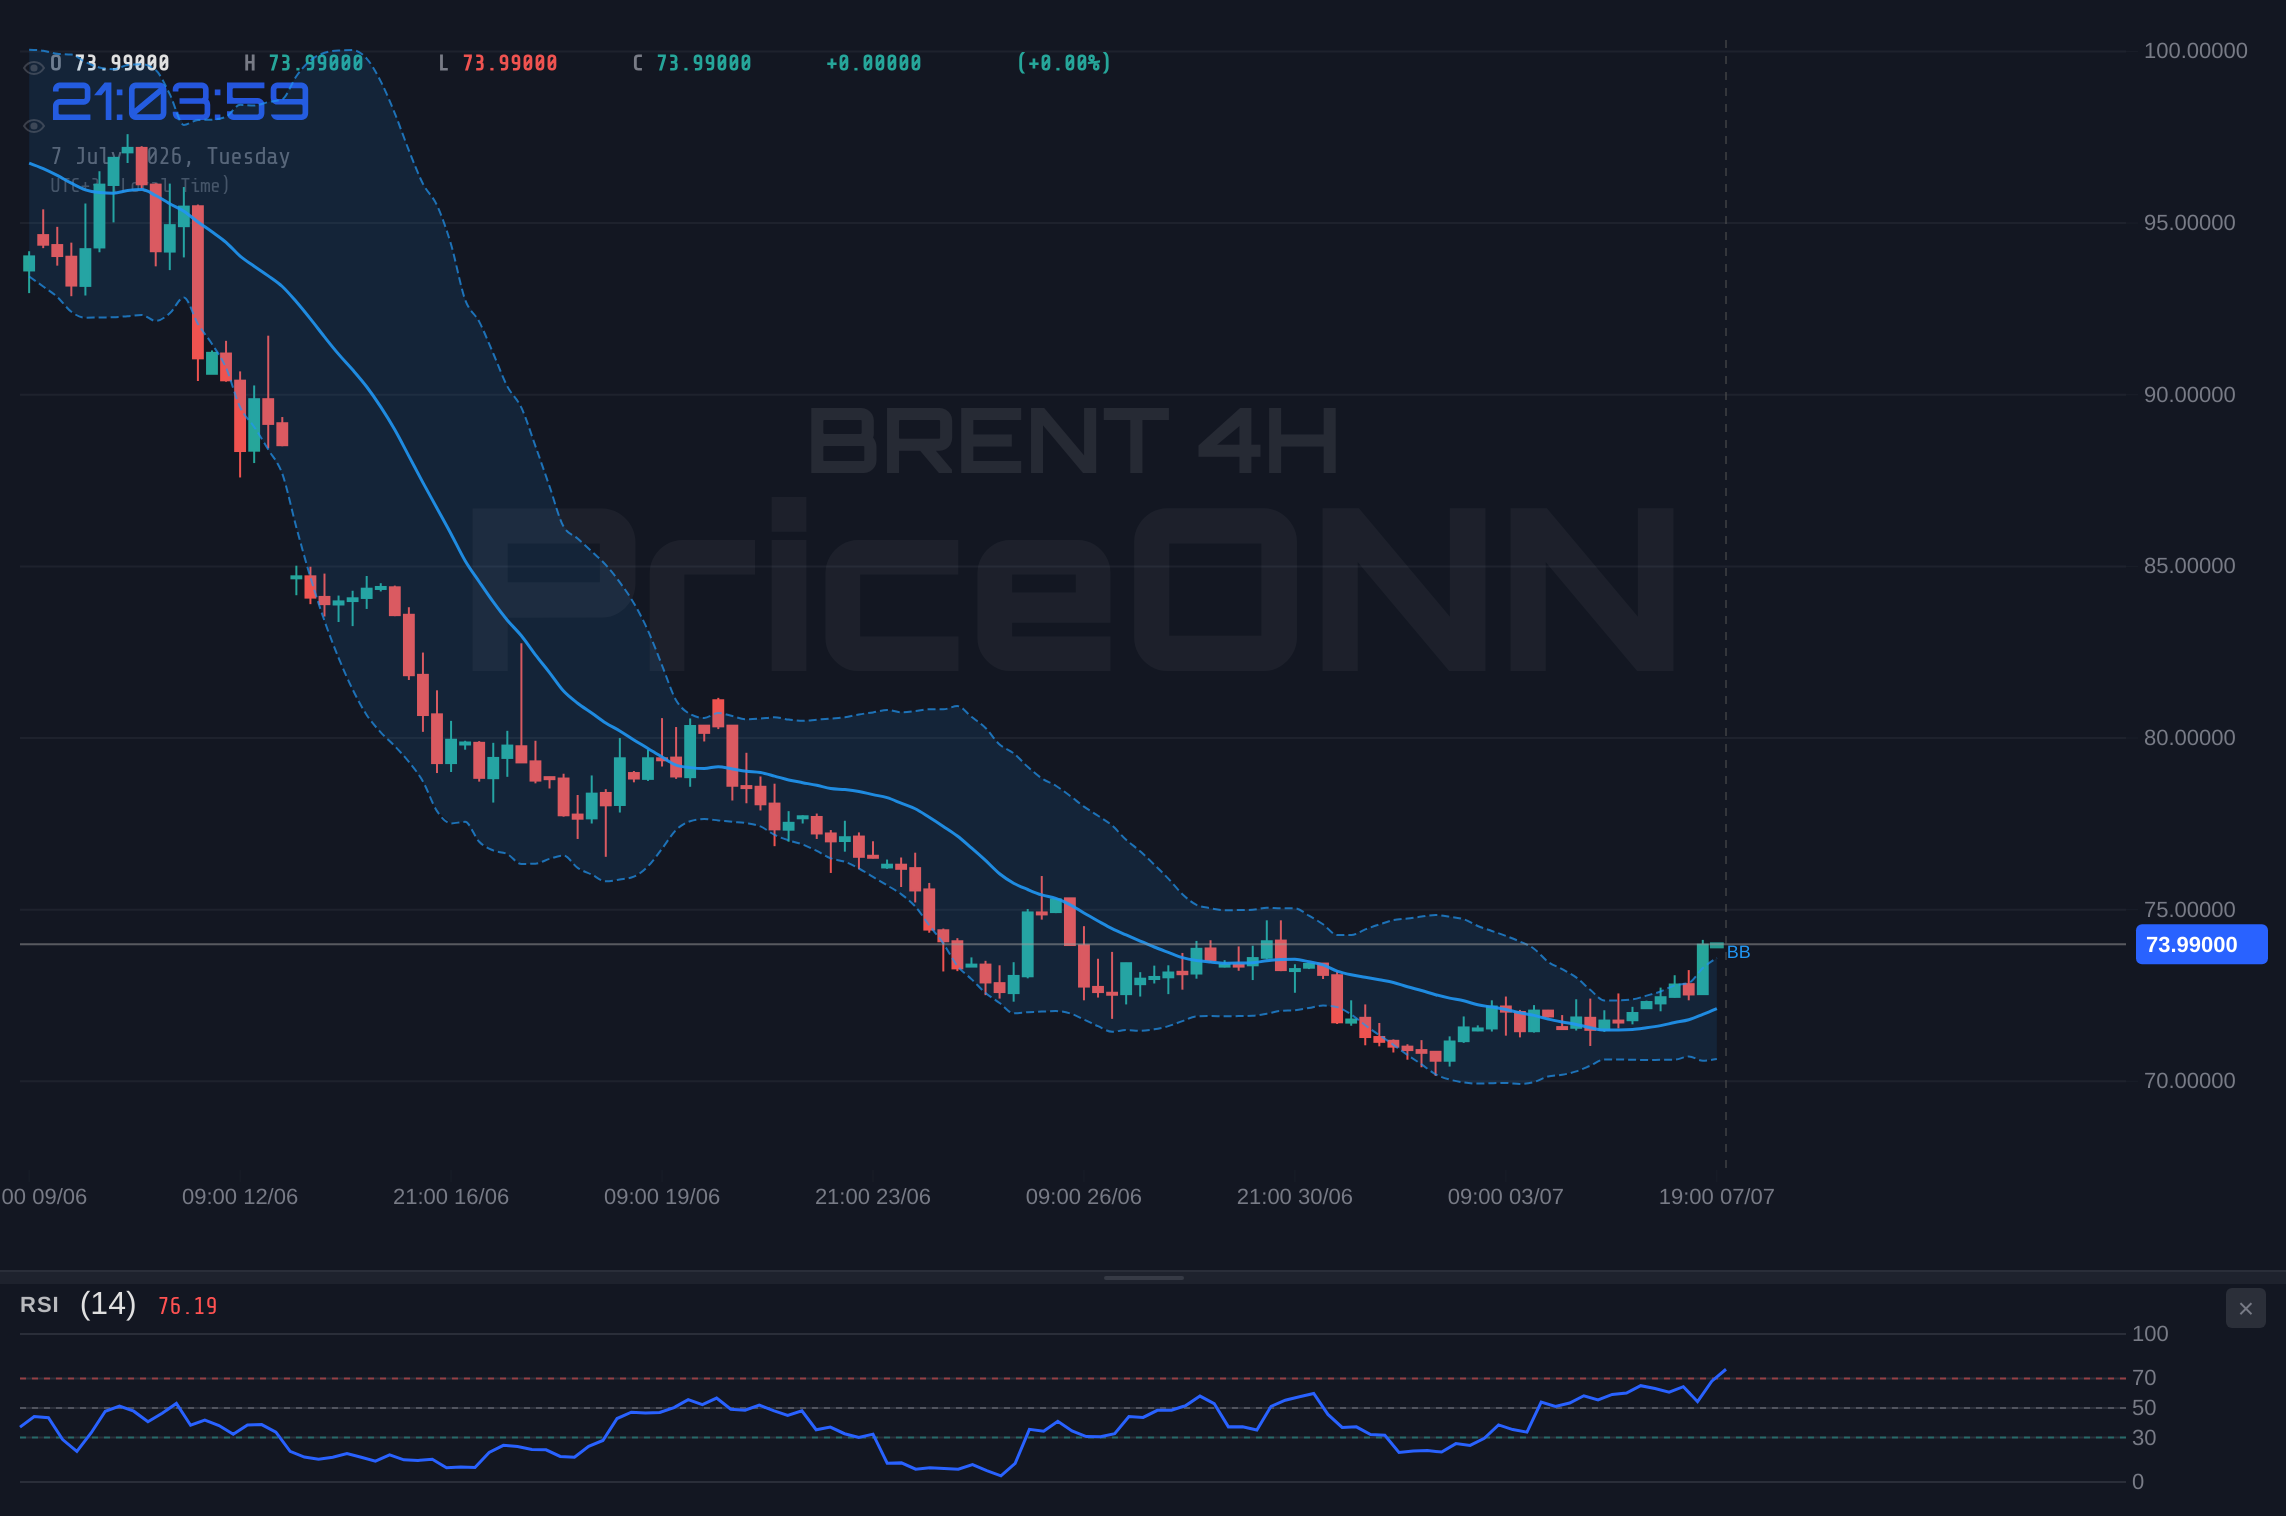
The technical picture for BRENT Crude presents a fascinating dichotomy when viewed across different timeframes. On the 1-hour chart, a strong bullish signal emerges, with an 'Al' (Buy) count of 7 against only 1 'Sat' (Sell) and 0 'Nötr' (Neutral). This suggests that, on a very short-term basis, momentum is favoring buyers, potentially driven by intraday trading dynamics or immediate supply/demand imbalances. The RSI at 75.36 on this timeframe is deep in overbought territory, hinting that this short-term bullishness might be stretched and vulnerable to a sharp correction. The ADX at 27.92 indicates a strong uptrend on this timeframe, further emphasizing the short-term bullish momentum. However, this optimism is significantly tempered when zooming out to the daily chart.Conversely, the 1-day timeframe paints a decidedly more cautious, if not outright bearish, narrative. Here, the overall signal leans bearish with 6 'Sat' signals against only 2 'Al' signals. The RSI at 33.52 is firmly in oversold territory, suggesting that sellers have been dominant and that a potential bounce could be on the cards, but the prevailing trend is down. The ADX on the daily chart is a robust 43, signifying a strong downtrend. This stark contrast between the 1-hour and 1-day charts highlights the current choppiness and the need for traders to define their time horizon and risk tolerance carefully. The battle between short-term buying pressure and longer-term selling pressure creates a challenging environment for clear directional bets.
MACD and Stochastic: Conflicting Signals Across the Spectrum
Further complicating the technical analysis are the readings from the MACD and Stochastic oscillators. On the 1-hour chart, the MACD shows positive momentum, with the MACD line above its signal line, aligning with the bullish short-term sentiment. The Stochastic oscillator on this timeframe, with K at 91.75 and D at 68.46, confirms this bullish stance, indicating a strong upward movement and potentially further gains if the overbought condition doesn't trigger immediate profit-taking. However, the 4-hour chart presents a mixed bag. The MACD here is positive, but the Stochastic shows a potential bearish crossover (K=84.16, D=66.56), suggesting that while momentum might still be positive, the upward thrust could be losing steam or facing resistance.The daily chart's indicators offer another layer of complexity. While the MACD is positive and shows upward momentum, aligning with the 1-hour chart's bullishness, the Stochastic oscillator (K=35.98, D=17.08) is in oversold territory and showing a bullish crossover. This suggests a potential floor is being established, but it contradicts the strong bearish trend indicated by the daily ADX of 40.16. This confluence of conflicting signals across different oscillators and timeframes underscores the current indecision in the BRENT market. It suggests that a clear breakout or breakdown might be needed to provide a more definitive directional bias, and that short-term fluctuations could be more pronounced until such a move occurs.
The Macroeconomic Undercurrents: DXY, Equities, and Inflation Fears
The price action in BRENT Crude cannot be analyzed in isolation; it is intricately linked to the broader macroeconomic environment. The US Dollar Index (DXY), currently trading at 100.95, plays a crucial role. As the DXY strengthens, it typically exerts downward pressure on dollar-denominated commodities like oil, making them more expensive for holders of other currencies. The DXY's current upward trajectory, despite mixed signals on its own 4-hour chart, suggests a supportive factor for bearish pressures on BRENT, especially if it continues to climb towards its daily resistance at 101.34. The 1-day ADX for DXY at 37.1 indicates a strong uptrend, reinforcing the potential for dollar strength.
Equity markets also provide vital context. The S&P 500, trading at 6572.87 with a strong daily uptrend (ADX 47.51) but showing signs of being overbought on the 1-hour chart (RSI 70.95), presents a mixed risk appetite signal. A pullback in equities, driven by factors like inflation concerns or tightening monetary policy expectations, often correlates with a decrease in demand for riskier assets, potentially impacting oil prices. Conversely, a strong rally in equities could signal increased risk appetite, potentially boosting BRENT. The Nasdaq 100's significant drop of -1.28% on the day, with a strong bearish trend (ADX 37.09 on 1H), adds to the bearish sentiment, suggesting a broader risk-off mood that could weigh on oil demand expectations.
Inflation expectations remain a persistent driver for oil prices. While the immediate price action might be dictated by technicals and short-term supply/demand dynamics, the underlying concern about persistent inflation continues to underpin crude oil's appeal as an inflation hedge. Any data suggesting a cooling of inflation could lead to a sell-off, while data pointing to rising price pressures could provide support. The current market environment, characterized by mixed economic signals and geopolitical uncertainties, creates a volatile backdrop where these correlations can shift rapidly, demanding constant vigilance from market participants.
Geopolitical Ripples and Their Impact on Oil Supply
Geopolitical tensions remain a significant, albeit often unpredictable, catalyst for oil price volatility. While the provided data does not include specific geopolitical events, the inherent sensitivity of crude oil to global stability cannot be overstated. Events in major oil-producing regions, such as the Middle East, or significant shifts in international relations can rapidly alter supply expectations and trigger sharp price movements. Historically, disruptions to supply routes, production cut announcements by major blocs like OPEC+, or escalating conflicts have consistently led to upward price pressures on BRENT and WTI.For instance, the recent news mentioning 'OPEC+'s latest decision' in relation to supply security, even if not directly detailed in the provided data, serves as a reminder of the cartel's influence. Such decisions, whether they involve production cuts aimed at stabilizing prices or maintaining output levels, directly impact the global supply balance. Similarly, ongoing geopolitical dialogues or tensions involving major energy players can create an environment of uncertainty, leading to increased demand for commodities perceived as safe havens, like gold, but also potentially driving speculative interest in oil as a hedge against supply disruptions. Traders must remain attuned to headlines from reliable sources like Reuters or Bloomberg that detail any significant developments in these areas, as they can quickly override technical signals.
The recent news regarding the S&P 500's rotation and the Pound's rally due to political stabilization, while not directly impacting BRENT's price, paints a picture of a market environment where various factors – from central bank policies to political stability – are constantly influencing asset classes. The energy market, being so fundamental to the global economy, is particularly susceptible to these broader currents. Therefore, while technical analysis provides a crucial roadmap, understanding the geopolitical backdrop and potential supply-side shocks is indispensable for a comprehensive view of BRENT's price trajectory.
Navigating the Scenarios: A Path Forward for BRENT Traders
Given the mixed technical signals and the complex macroeconomic backdrop, a multi-scenario approach is essential for navigating the BRENT market. The current price of $74.13 sits precariously between short-term bullish indicators and longer-term bearish trends, making precise forecasting challenging. The probability assigned to each scenario reflects the current technical strength and the prevailing market sentiment, acknowledging that these can shift rapidly with new data or events.Bearish Scenario: The Downside Break
65% ProbabilityNeutral Scenario: Range-Bound Consolidation
25% ProbabilityBullish Scenario: Reclaiming the Momentum
10% ProbabilityThe Most Probable Path: A Bearish Bias with Caution
Based on the current technical data, the bearish scenario appears to hold the highest probability at 65%. The daily chart's strong downtrend (ADX 43) and oversold RSI (33.52) suggest that while a short-term bounce is possible, the larger trend is against the bulls. The 1-hour chart's bullish signals, particularly the RSI at 75.36, seem more indicative of a potential short-covering rally or a temporary pause before the downtrend resumes, rather than a sustained move higher. The conflicting signals, especially the weak ADX on the 1-hour chart (13.36), suggest that any upward momentum may lack conviction and could easily falter. Therefore, traders should prioritize monitoring downside breaks of key support levels, such as $73.81, as the most likely continuation pattern in the near term. The neutral scenario holds a 25% probability, reflecting the possibility of choppy, range-bound trading as the market digests conflicting signals. The bullish scenario, with only a 10% probability, reflects the significant headwinds from the daily trend and the overbought conditions on the 1-hour chart.What I'm Watching This Week
For BRENT Crude traders, the immediate focus will be on the interplay between the $74.45 resistance and the $73.81 support on the 1-hour chart. A decisive break below $73.81, especially with increasing volume, would likely confirm the bearish thesis and open the door for further downside towards $73.49 and potentially $73.06. Conversely, a sustained move above $74.45, coupled with a retreat in the DXY and a potential stabilization in risk assets like the S&P 500, could signal a short-term reversal, though the daily trend remains a significant hurdle.
Key economic data releases and geopolitical developments will be crucial in shaping the narrative. Any news hinting at increased global oil supply, a significant slowdown in inflation, or a de-escalation of geopolitical tensions could put further downward pressure on prices. Conversely, any supply disruptions, unexpected production cuts, or signs of resurgent inflation could provide a floor or even fuel a short-term rally. The ADX readings across multiple timeframes highlight the current trend strength ambiguity, making it essential to wait for clearer directional signals or confirmations before committing to larger positions. Patience and disciplined risk management remain paramount in this environment.
| Indicator | Value | Signal | Interpretation |
|---|---|---|---|
| RSI (14) | 75.36 (1H) / 33.52 (1D) | Overbought (1H) / Oversold (1D) | Short-term exhaustion vs. long-term downtrend pressure. |
| MACD | Positive Momentum (1H/1D) | Bullish Momentum | Short-term strength, but daily trend conflicts. |
| Stochastic | K=91.75, D=68.46 (1H) / K=35.98, D=17.08 (1D) | Bullish Crossover (1D) / Overbought (1H) | Conflicting signals suggest potential reversal or range-bound action. |
| ADX | 27.92 (1H) / 43.00 (1D) | Strong Trend (1D) / Moderate Trend (1H) | Daily trend is strong down, 1-hour shows moderate up; requires careful interpretation. |
Frequently Asked Questions: BRENT Analysis
What happens if BRENT Crude breaks below the $73.81 support level?
A break below the $73.81 support on the 1-hour chart, especially with increased volume, would likely confirm the bearish scenario. This could lead to a further decline towards the $73.49 and $73.06 levels, aligning with the dominant daily downtrend.
Should I consider buying BRENT at the current $74.13 level given the mixed signals?
Buying at $74.13 carries significant risk due to the conflicting technical signals and the strong daily bearish trend. While the 1-hour chart shows some bullish momentum, the RSI at 75.36 suggests it might be overextended. A more prudent approach would be to wait for confirmation, such as a clear break above $74.45 or a more convincing oversold bounce on the daily chart.
Is the RSI at 75.36 on the 1-hour chart a definitive sell signal for BRENT?
An RSI of 75.36 on the 1-hour timeframe indicates overbought conditions, which often precede a price correction or consolidation. While it's not a definitive sell signal on its own, it suggests that the short-term bullish momentum may be losing steam and that traders should be cautious about chasing further upside at these levels.
How might the current DXY level of 100.95 affect BRENT Crude's price this week?
With the DXY at 100.95 and showing a strong daily uptrend (ADX 37.1), dollar strength is a likely headwind for BRENT Crude. This increased dollar value can make oil more expensive for international buyers, potentially dampening demand and contributing to bearish price action, especially if the DXY pushes towards its next resistance level.
Track markets in real-time
AI-powered analysis, technical indicators and real-time price data.
Join Our Telegram Channel
Breaking market news, AI analysis and trading signals instantly.
Join Channel