

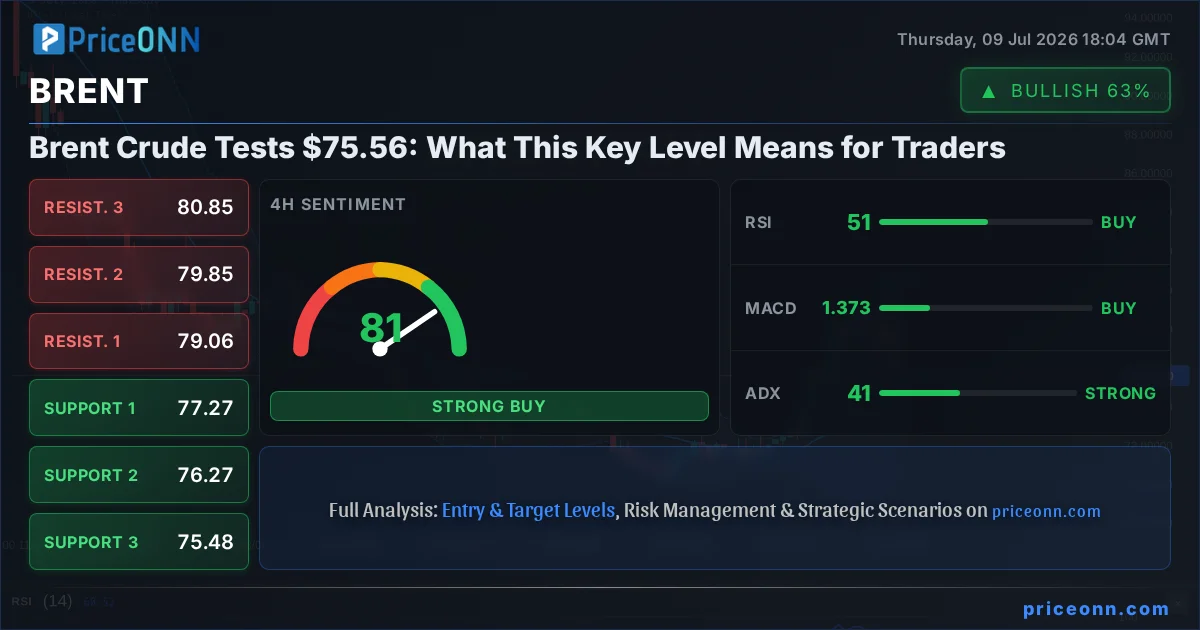
The global energy market is at a fascinating juncture, with Brent Crude Oil prices currently trading around the critical $75.56 mark. This level is more than just a number; it represents a confluence of technical indicators and macroeconomic undercurrents that are shaping the immediate trajectory for oil traders. While the 4-hour chart signals a robust uptrend with an ADX reading of 41.32, the daily chart presents a more neutral stance with a 50% trend strength, and the 1-hour timeframe shows a weakening trend strength of 50% with a bearish signal. This divergence across timeframes creates a complex environment where both opportunistic buying and cautious selling strategies could find merit. Understanding the interplay between these technical signals, alongside broader market sentiment influenced by geopolitical tensions and central bank policies, is paramount for navigating this volatile landscape.
- Brent Crude is currently trading at $75.56, a critical juncture for traders.
- The 4-hour trend is strongly bullish (ADX 41.32), but the 1-hour and daily charts show mixed signals.
- RSI at 36.93 on the 1H chart indicates bearish momentum, while Stochastic shows oversold conditions.
- Key support is identified at $75.48, with resistance eyed at $79.06 on the 4H timeframe.
- Geopolitical risks and inflation concerns remain underlying factors influencing price action.
The current technical setup for Brent Crude presents a compelling case study in multi-timeframe analysis. On the 4-hour chart, the picture is decidedly bullish, with a strong ADX of 41.32 indicating a robust trend. This aligns with a bullish signal from the overall indicator summary for this timeframe. However, the shorter 1-hour timeframe paints a different story. Here, the ADX has weakened to 23.25, suggesting a less committed trend, and the RSI at 36.93 clearly signals bearish momentum, with Stochastic readings further emphasizing oversold conditions. The daily chart, meanwhile, sits in neutral territory with a trend strength of 50%, adding another layer of complexity. This conflict between timeframes means that short-term traders might be looking for different signals than those with a longer-term perspective. The prevailing uncertainty necessitates a careful approach, focusing on clear entry and exit points derived from the provided support and resistance levels.
Navigating the Technical Crosscurrents
Delving deeper into the technical indicators on the 1-hour chart, we see Brent Crude trading at $75.56, with the immediate support identified at $75.48 and resistance at $76.39. The RSI(14) at 36.93 is firmly in the lower half of the neutral zone, suggesting bearish momentum is currently in play. This is further supported by the Stochastic oscillator, where %K (6.5) has crossed below %D (32.95), indicating a bearish signal and potentially oversold conditions that could precede a bounce, or signal further downside. The MACD, while showing negative momentum, is positioned below its signal line, reinforcing the bearish short-term outlook. The ADX at 23.25 confirms that while there might be a trend, it's only of moderate strength, allowing for potential reversals or consolidations.
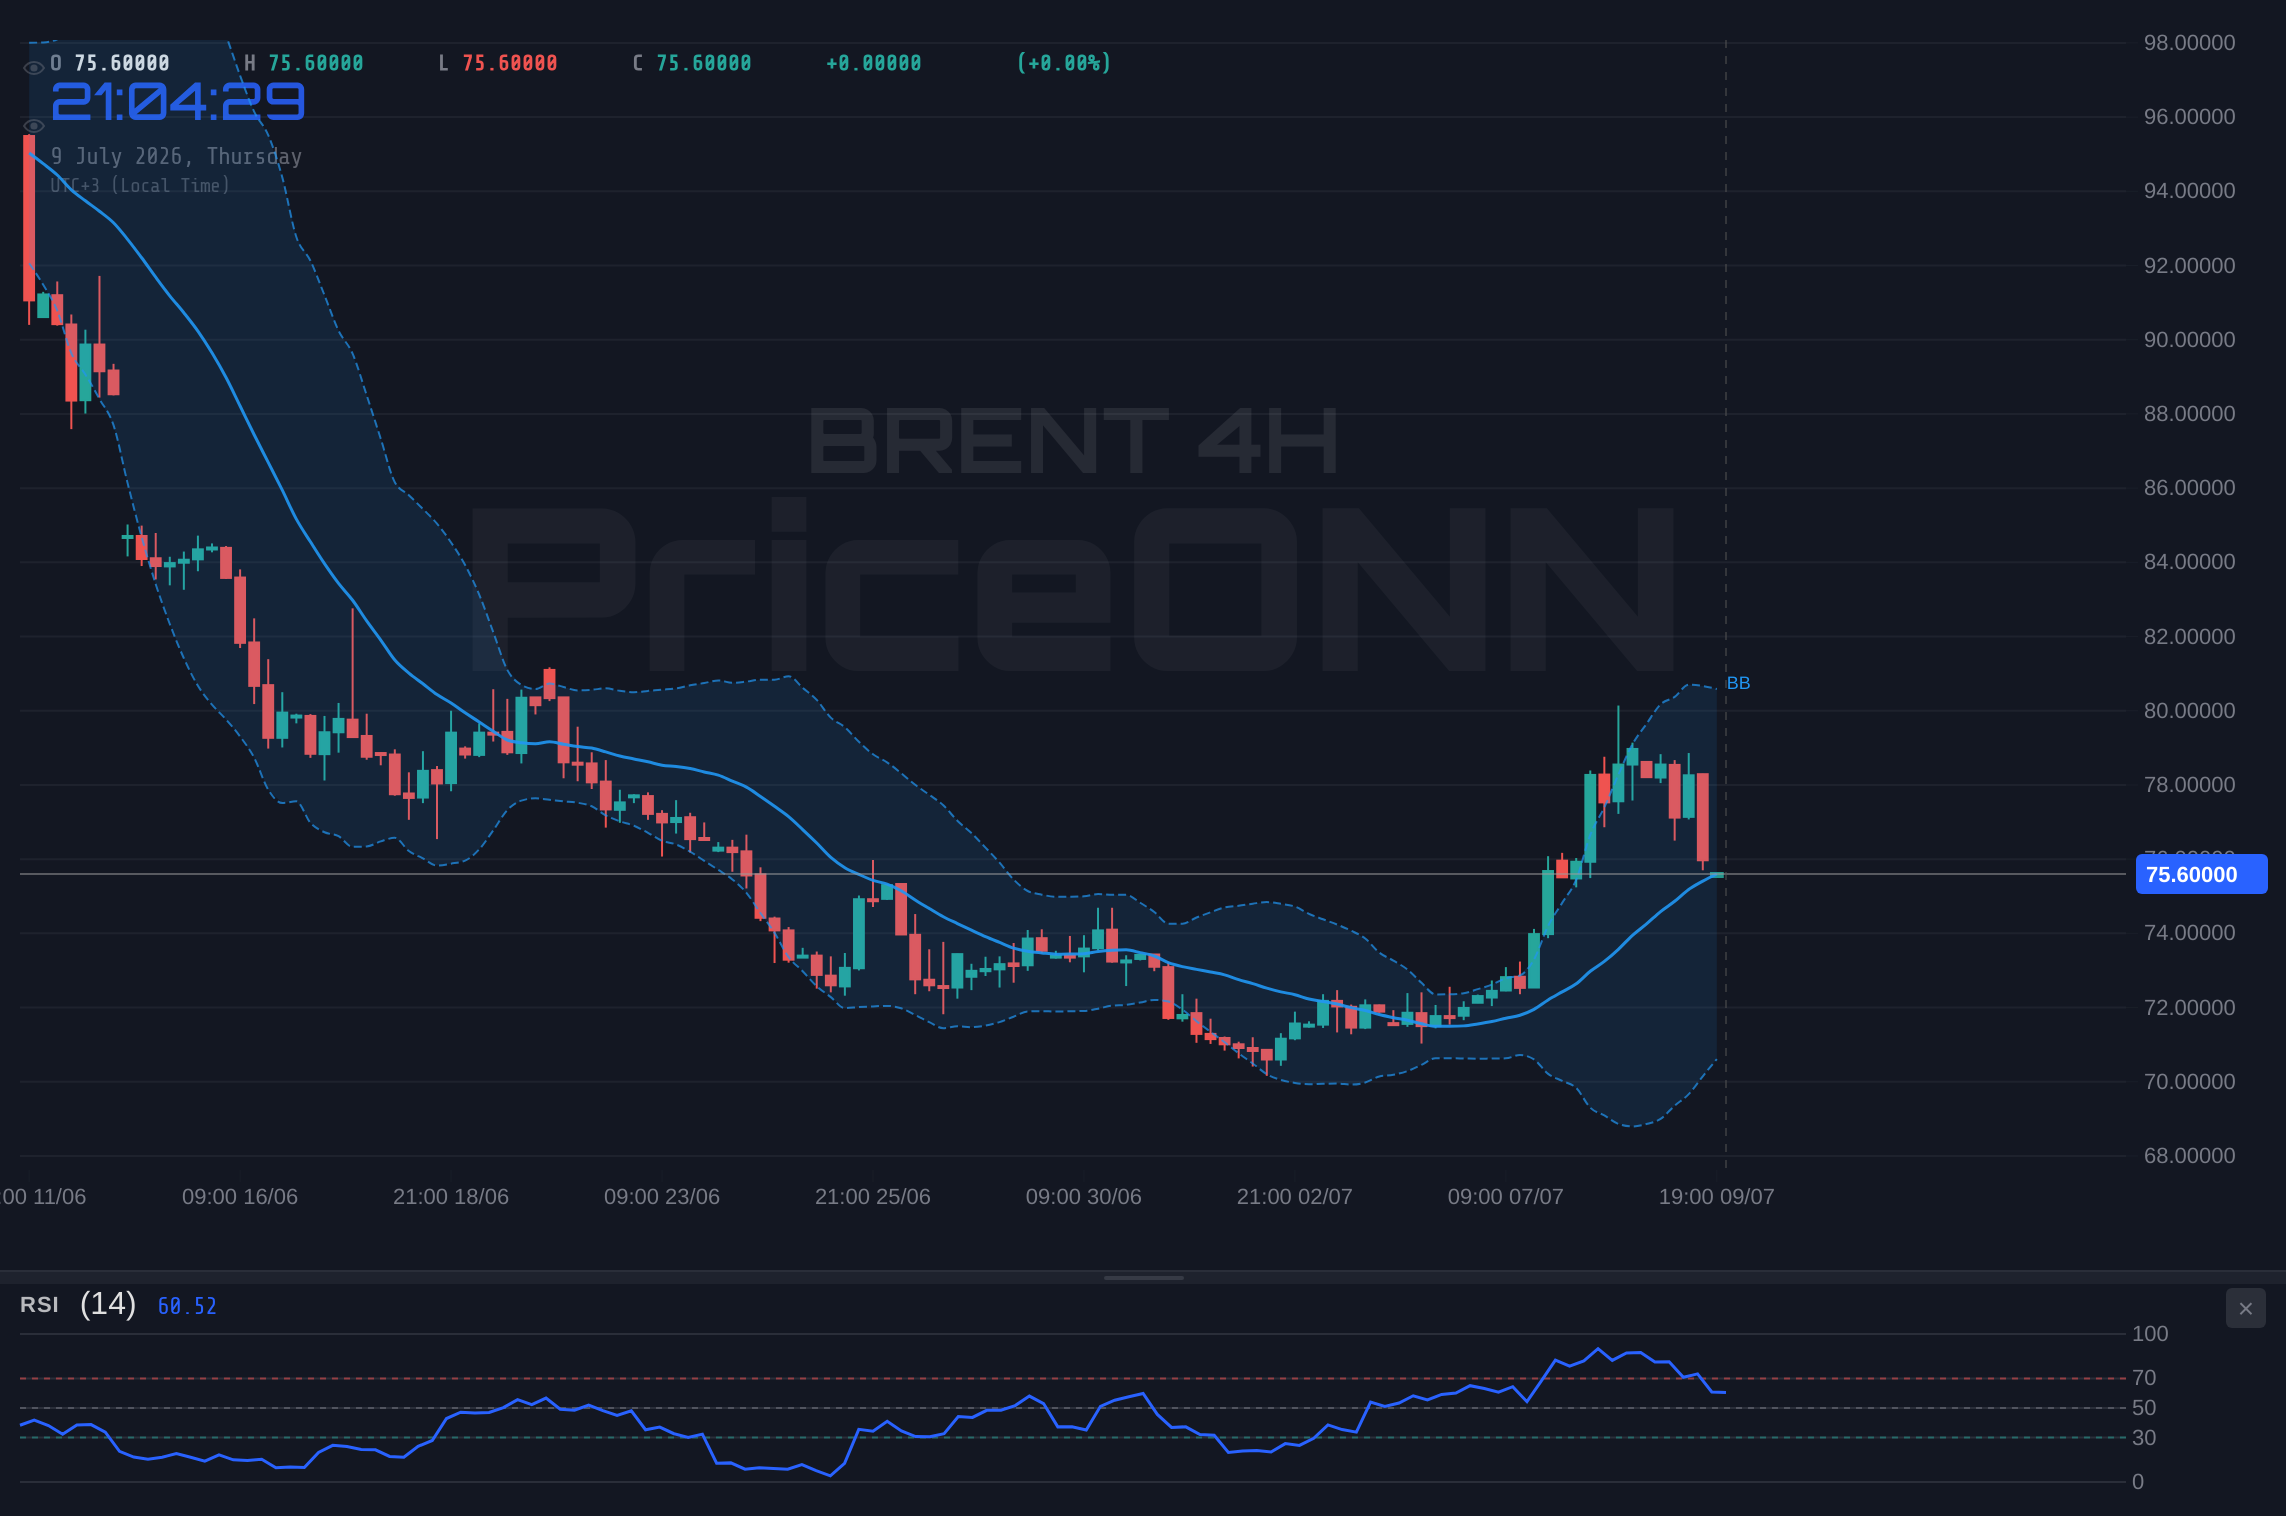
Shifting focus to the 4-hour timeframe, the narrative becomes more constructive. Here, Brent Crude, currently priced at $75.56, finds its first significant support at $75.48 and faces initial resistance at $76.39. The RSI(14) sits at 51.03, hovering just above the midpoint, indicating a neutral-to-slightly-bullish bias with potential for upward movement. The MACD shows positive momentum, with the MACD line above the signal line, suggesting that the recent bearish pressure might be easing. The Stochastic oscillator, however, presents a conflicting signal: %K at 33.84 is below %D at 65.75, which typically signals a bearish move, but given the overall bullish trend indicated by the ADX (41.32), this might represent a temporary pullback within a larger uptrend rather than a reversal. This ADX reading of 41.32 is particularly noteworthy, signifying a strong trend is in place on this timeframe, which often commands more weight for swing traders.
On the daily chart, Brent Crude at $75.56 presents a picture of consolidation. The trend strength is neutral at 50%, and the ADX stands at 37.88, which, despite the neutral trend strength classification, often indicates a strong underlying trend in force - though its directionality is less clear from this single metric alone. Support levels are more distant, starting at $73.22, while resistance is eyed at $80.99. The RSI(14) is at 39.67, leaning towards bearish territory but still within the neutral zone, suggesting that the bears have some room to maneuver before a full oversold condition is reached. The MACD shows positive momentum, crossing above its signal line, which is a bullish signal on this longer timeframe. Conversely, the Stochastic oscillator shows %K at 78.54 and %D at 39.96, a strong bullish signal, with %K significantly above %D, indicating potential upward momentum. This daily chart’s mixed signals - a strong ADX but neutral trend strength and conflicting RSI/Stochastic readings - suggest that the broader market is weighing various factors before committing to a significant directional move.
Trader's Edge: Conflicting Signals & Strategy
The divergence across timeframes is the key takeaway here. Short-term traders might lean bearish based on the 1-hour chart’s RSI and Stochastic, looking for a dip towards $75.48 or even $74.85. However, swing and position traders will likely give more weight to the 4-hour chart's strong ADX and the daily chart's MACD bullish crossover, viewing any short-term weakness as a potential buying opportunity. The $75.56 price point is therefore a battleground. A decisive break and hold above $76.39 on the 1-hour chart, confirmed by volume, could signal a short-term reversal. Conversely, a close below $75.48 on the 4-hour chart would likely invalidate the bullish thesis for swing traders, opening the door for a move towards $75.48.
Macroeconomic Undercurrents and Geopolitical Ripples
Beyond the charts, the price of Brent Crude at $75.56 is intrinsically linked to broader macroeconomic trends and geopolitical developments. The US Dollar Index (DXY), currently at 100.88 and showing a bearish trend on the 1-hour and 4-hour charts, typically exerts inverse pressure on commodities priced in dollars, like oil. A weakening dollar can make oil cheaper for holders of other currencies, potentially boosting demand and prices. However, the DXY's daily chart shows a bullish trend, indicating that the long-term picture for the dollar might still be firm, creating conflicting signals that add to market uncertainty.
Inflationary expectations remain a significant driver for oil prices. As a key component of global inflation, significant movements in crude oil prices can influence central bank policy decisions. Recent news from July 9th indicates that Middle East calm is cooling inflation fears, which could, in theory, put downward pressure on oil prices if sustained. However, the same report also mentions Brent above $80 as a trigger for gold and silver bears, suggesting that the market is still sensitive to oil price surges. This implies that any sustained rally in Brent could reignite inflation concerns, potentially leading to tighter monetary policy, which in turn could dampen economic growth and oil demand. The delicate balance between supply-side factors (like OPEC+ decisions) and demand-side concerns (global economic health) is constantly being recalibrated.
Geopolitical tensions, particularly in the Middle East, remain a constant background risk for oil prices. While recent reports suggest a cooling of immediate tensions, the region is inherently volatile. Any escalation could quickly disrupt supply chains and send oil prices soaring, as highlighted by the mention of Brent above $80 as a critical level. The ongoing conflict in Ukraine also continues to play a role, impacting global energy flows and contributing to price volatility. Furthermore, the energy transition narrative, with increasing investment in renewable energy sources, adds a long-term structural element to oil market analysis. While renewables are growing, current global energy demand still heavily relies on fossil fuels, making oil prices sensitive to both supply disruptions and shifts in global economic activity.
Risk Warning: Geopolitical Volatility
The energy markets are highly susceptible to geopolitical events. A sudden escalation of tensions in major oil-producing regions could lead to rapid price spikes, overriding current technical indicators. Traders should remain aware of geopolitical news flow and maintain appropriate risk management strategies, including stop-loss orders, to mitigate potential losses from unforeseen events.
Trade Scenarios for Brent Crude at $75.56
Bearish Scenario: Retreat Towards $75.48
40% ProbabilityNeutral Scenario: Consolidation Around $75.56
35% ProbabilityBullish Scenario: Breakout Towards $76.39 and Beyond
25% ProbabilityThe current market environment for Brent Crude at $75.56 is characterized by conflicting signals across different timeframes, making it a prime candidate for range-bound trading or a potential breakout scenario. The 4-hour chart's strong ADX of 41.32 suggests underlying trend strength, which favors the bullish scenario. However, the bearish momentum on the 1-hour chart, with RSI at 36.93 and Stochastic showing oversold conditions, cannot be ignored. This creates a high probability for consolidation, where price might gyrate between the key support at $75.48 and resistance at $76.39. For a bullish move to gain traction, a decisive break above $76.39 is needed, potentially targeting higher resistance levels on the 4-hour chart like $79.06. On the flip side, a failure to hold $75.48 could trigger a move towards the more significant daily support at $73.22.
The probability assigned to each scenario reflects the current technical picture. The bearish scenario holds a 40% probability, driven by the short-term negative indicators. The neutral scenario, representing consolidation, is assigned 35% probability, acknowledging the conflicting signals and the current price hovering at a key juncture. The bullish scenario, while supported by the 4-hour trend strength, is given a 25% probability due to the immediate bearish headwinds on the 1-hour chart and the mixed signals on the daily timeframe. Traders must remain agile, prepared to adjust their strategies based on how price action unfolds around these critical levels. Watching the volume accompanying any breakouts or breakdowns will be crucial for confirming the validity of these scenarios.
Strategic Insight
The strength of the 4-hour trend (ADX 41.32) suggests that any bearish moves on the 1-hour chart might be temporary pullbacks within a larger uptrend. Therefore, while respecting the short-term bearish signals, traders might look for confluence on higher timeframes before committing to short positions. A bullish confirmation on the 1-hour chart, such as RSI moving above 50 and MACD crossing positively, coupled with a hold above $75.48, could present a higher-probability long entry targeting $76.39 and potentially higher.
The Road Ahead: What to Watch for Brent Crude
Looking forward, the trajectory of Brent Crude at $75.56 will likely be dictated by the interplay of technical levels and evolving macroeconomic and geopolitical narratives. The immediate focus will be on whether price can hold above the $75.48 support. A failure here could see a swift move lower, potentially testing the $74.85 level. Conversely, a sustained break above $76.39, especially with increasing volume, could signal the start of a move towards the $79.06 resistance on the 4-hour chart. Traders should closely monitor the DXY's movement, as its daily trend strength (ADX 35.14) remains a significant factor. Any resurgence in the dollar could cap oil's upside potential.
Furthermore, upcoming economic data releases, particularly those related to inflation and employment in major economies, will be crucial. News regarding OPEC+ production decisions or any significant geopolitical developments in the Middle East could introduce sharp volatility, potentially leading to rapid price swings that override current technical patterns. The market sentiment, as reflected in indicators like the S&P 500 (currently at 6572.87 and showing a bullish trend on the 1-hour chart) and Nasdaq (29758.97, also bullish on 1-hour), will also provide context for risk appetite, which indirectly influences oil demand.
The conflicting signals across timeframes suggest that patience is a virtue for traders right now. Waiting for confirmation of a clear directional move, either a confirmed break of support or resistance with accompanying volume, or a clearer consensus from indicators across multiple timeframes, will be key to successful trading. The $75.56 level is a critical pivot zone, and the next few trading sessions will likely determine whether Brent Crude consolidates, retreats, or embarks on a more significant move higher. Risk management remains paramount, ensuring that any positions taken are aligned with clearly defined stop-loss levels and profit targets, especially given the inherent volatility in the energy markets.
| Indicator | Value | Signal | Interpretation |
|---|---|---|---|
| RSI (14) | 39.67 | Bearish | Leaning towards oversold on Daily, but bearish momentum on 1H. |
| MACD | Positive Momentum | Bullish | Bullish crossover on Daily, but negative on 1H. |
| Stochastic | %K: 78.54, %D: 39.96 | Bullish | Strong bullish signal on Daily, but oversold on 1H. |
| ADX | 41.32 | Strong Trend | Indicates a strong trend on 4H, moderate on 1H. |
Frequently Asked Questions: Brent Crude Analysis
What happens if Brent Crude breaks below the $75.48 support level?
If Brent Crude closes below the critical 4-hour support at $75.48, it would invalidate the current bullish outlook on that timeframe. This could trigger a move towards the next significant support level at $74.85, with potential acceleration if selling pressure intensifies.
Should I buy Brent Crude at current levels of $75.56 given the mixed signals?
Buying at $75.56 requires careful consideration due to conflicting signals. A high-probability long entry would ideally require confirmation, such as a break above $76.39 resistance on the 1-hour chart, or a more decisive bullish setup on the daily chart. Waiting for confirmation could increase the probability of a successful trade.
Is the RSI at 36.93 a sell signal for Brent Crude right now?
An RSI reading of 36.93 on the 1-hour chart indicates bearish momentum, suggesting that sellers are currently in control on this shorter timeframe. However, on the 4-hour chart, the RSI is near 51.03, and the daily RSI is 39.67, showing a more mixed picture. Therefore, while it signals caution for short-term longs, it's not a definitive sell signal in isolation without considering other timeframes and indicators.
How will the DXY's trend at 100.88 affect Brent Crude this week?
The DXY is showing mixed trends, with bearish signals on the 1-hour and 4-hour charts but a bullish trend on the daily. A weakening dollar (lower DXY) typically supports oil prices by making them cheaper for foreign buyers. Conversely, a strengthening dollar could cap oil's upside. Traders should monitor the DXY's ability to hold its daily bullish trend, as this could present headwinds for Brent Crude.
Track markets in real-time
AI-powered analysis, technical indicators and real-time price data.
Join Our Telegram Channel
Breaking market news, AI analysis and trading signals instantly.
Join Channel