

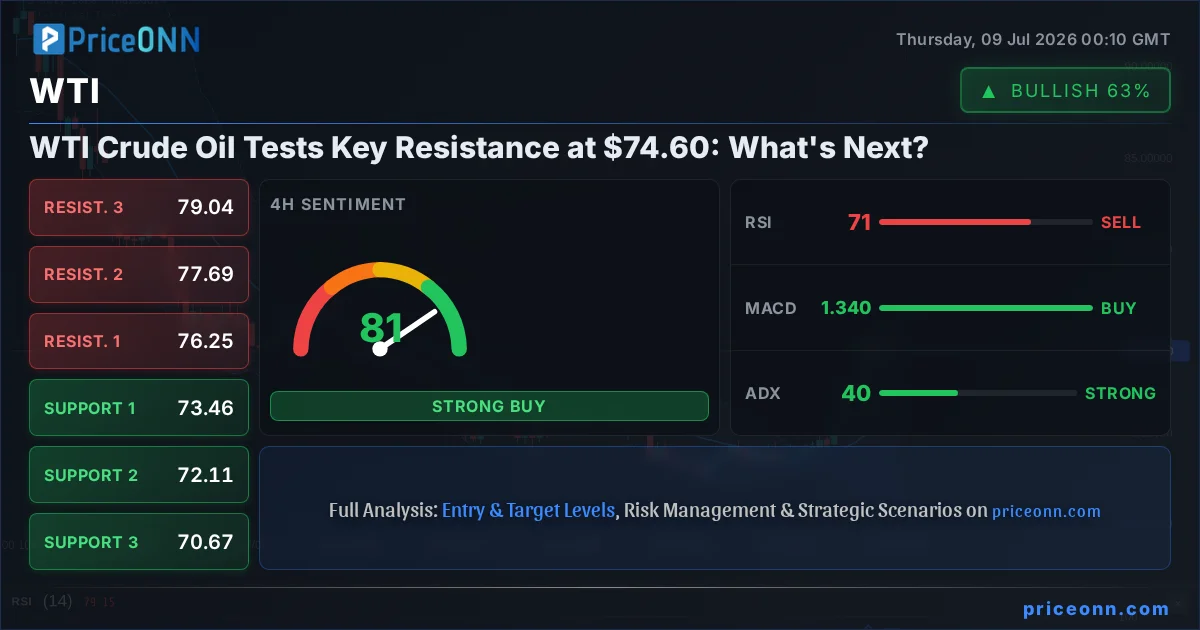
WTI Crude Oil is currently navigating a critical juncture, trading at $74.60. After a significant surge of 2.98% ($2.16) on strong upward momentum, the price has approached a key resistance zone. This upward move, which saw WTI trade from a low of $71.96 to a high of $76.33, is now being met with caution as traders assess the sustainability of this rally against a backdrop of complex global economic indicators and geopolitical undercurrents. The question on many traders' minds is whether the current momentum can overcome overhead resistance, or if a pullback is due.
- WTI Crude Oil is trading at $74.60, showing a strong upward trend on the 1H and 4H charts, driven by a 2.98% daily gain.
- Key resistance is forming around the $74.97-$75.51 range, while immediate support lies at $74.43, tested multiple times.
- RSI at 58.3 on the 1H chart suggests rising momentum but remains in neutral territory, indicating room for further upside before overbought conditions emerge.
- The 1D chart shows a conflicting trend, with ADX at 37.37 indicating a strong downward trend, despite positive MACD signals and Stochastic showing a bullish crossover from oversold conditions.
Navigating the $74.60 Mark: A Technical Perspective
The immediate technical picture for WTI Crude Oil on the 1-hour timeframe presents a bullish bias, with a trend strength of 87%. The price action has been decisively upward, pushing towards immediate resistance levels identified at $74.97, $75.23, and $75.51. This upward momentum is supported by a MACD that is currently positive, with the MACD line above its signal line, indicating strengthening bullish momentum. Furthermore, the Stochastic Oscillator is showing a bullish signal with %K at 44.47 and %D at 39.65, suggesting that the pair is moving out of oversold territory and could potentially continue higher. The ADX at 33.53 confirms a strong uptrend on this timeframe, reinforcing the bullish sentiment. However, the RSI at 58.3 remains in neutral territory, suggesting that while momentum is building, it has not yet reached overbought levels, leaving room for further price appreciation.
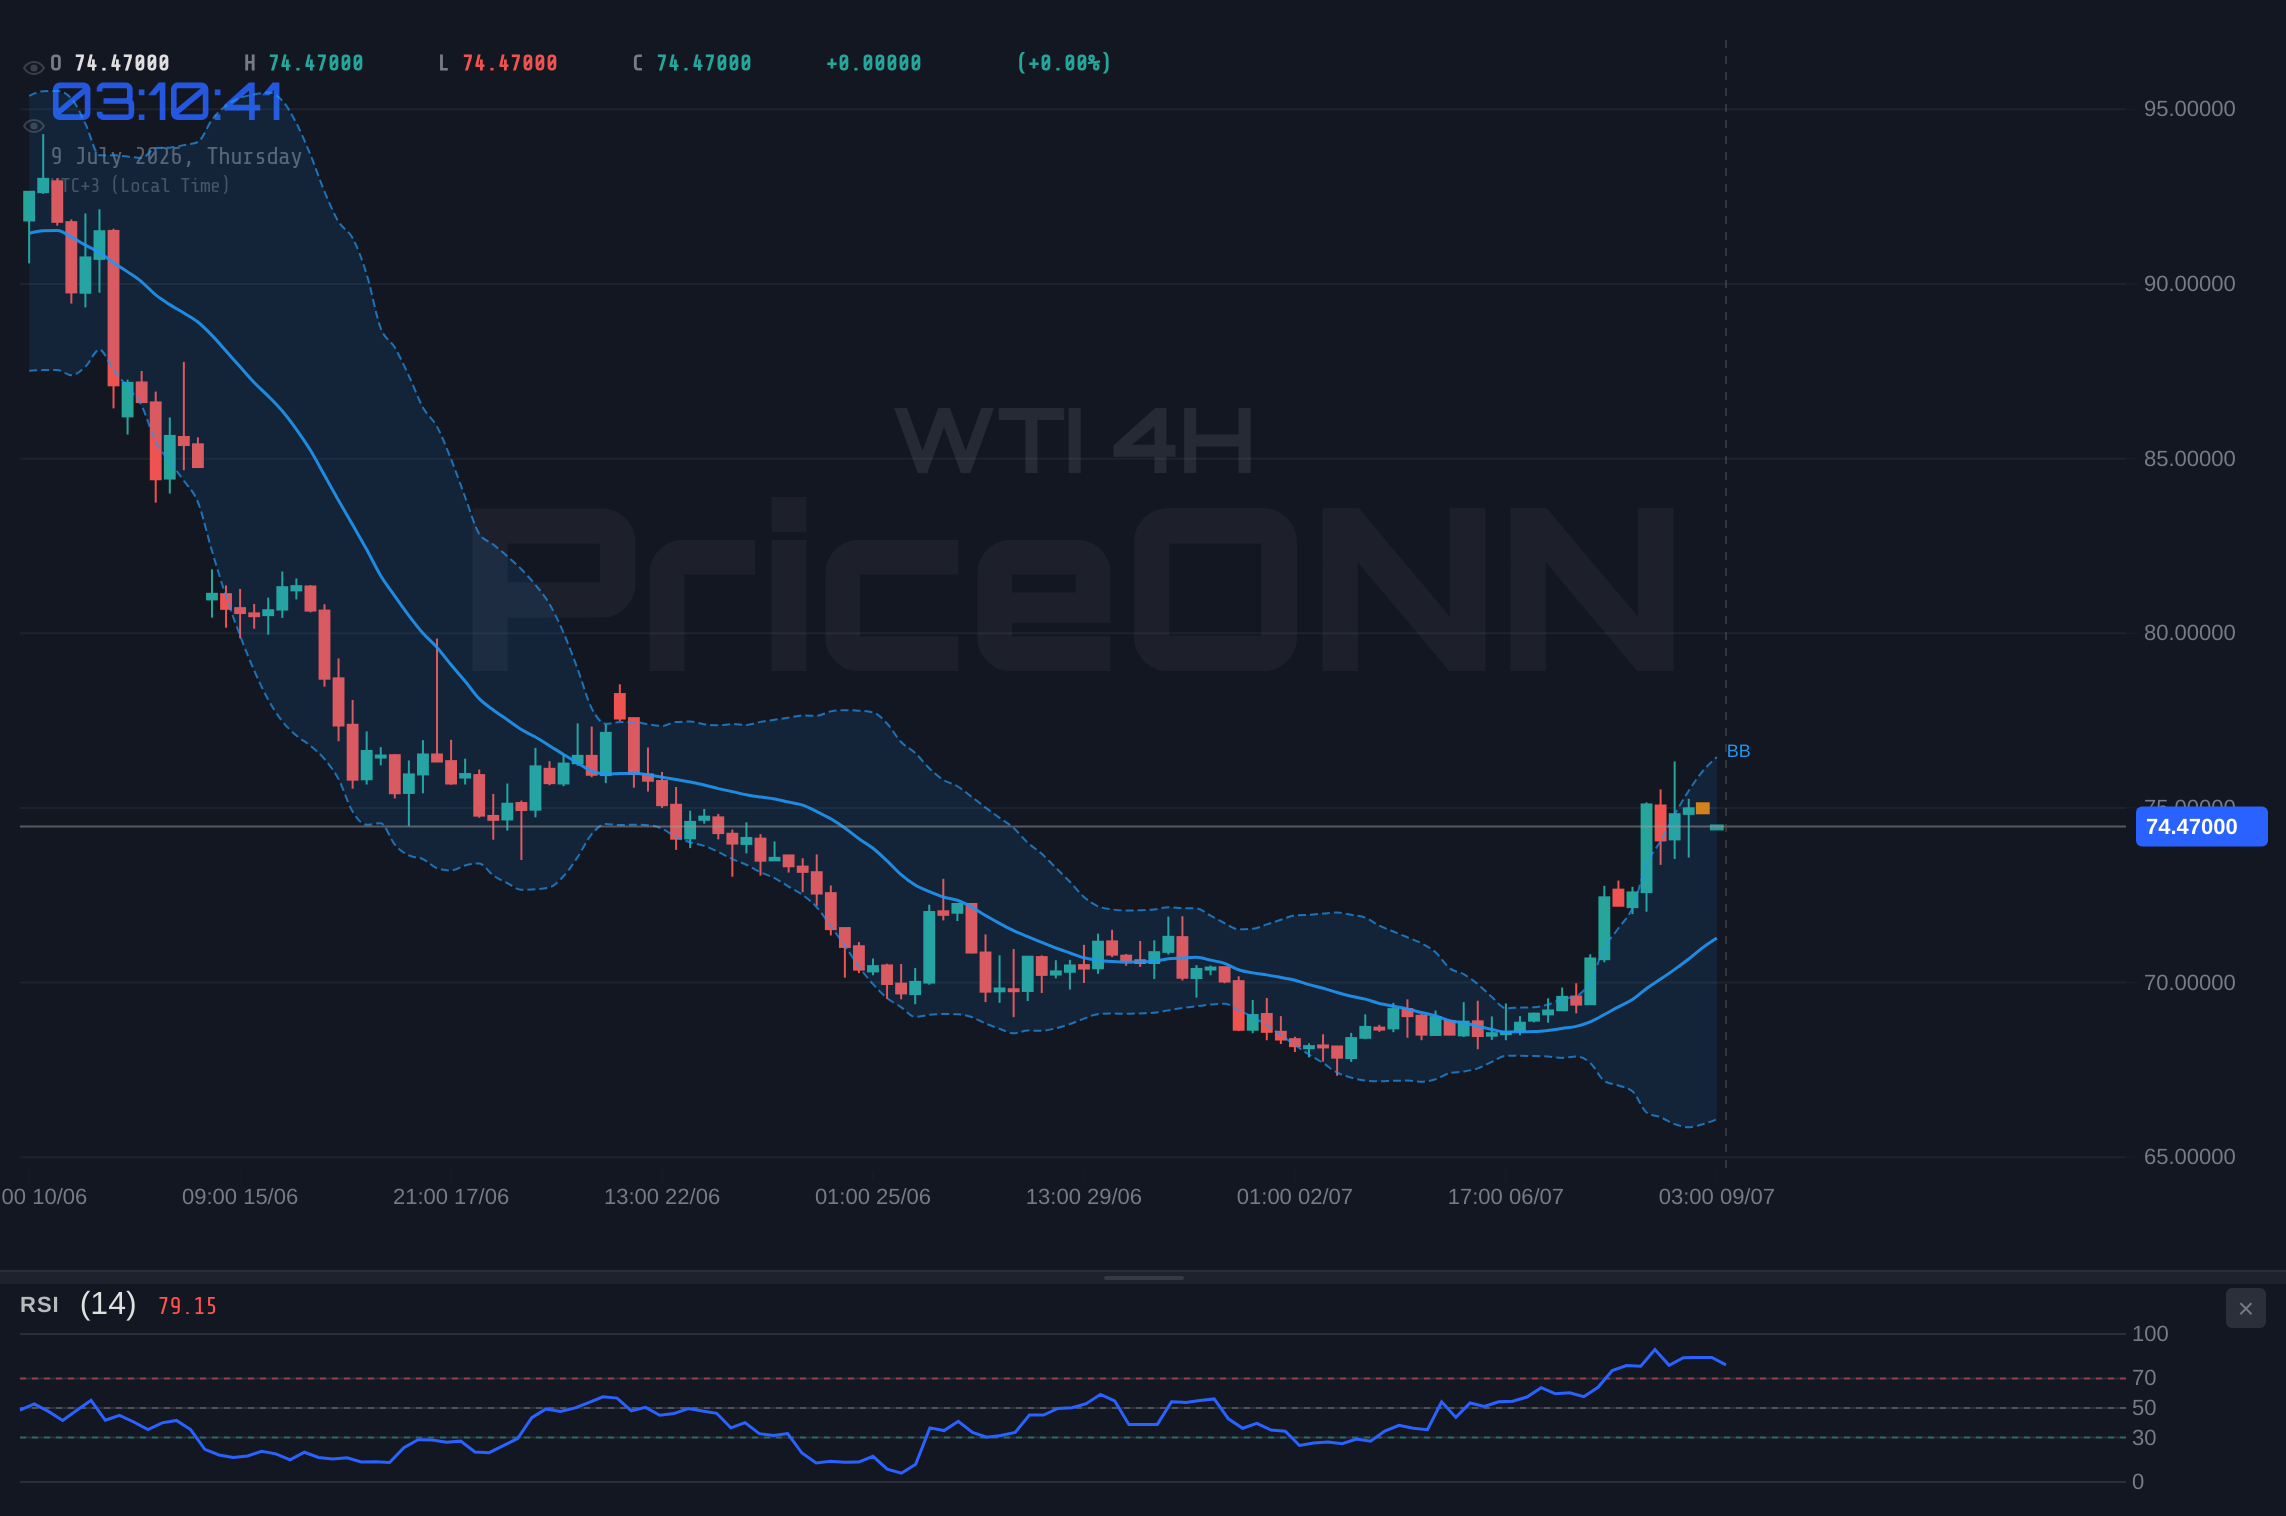
The strength of the current uptrend is significant. On the 4-hour chart, the trend is also firmly established as bullish, with an even stronger conviction of 100% trend strength. This timeframe shows resistance levels extending to $76.25, $77.69, and $79.04. The RSI here is at 71.59, firmly in overbought territory. This signals that the rally might be getting overheated and a potential pullback or consolidation could be imminent. While the MACD is positive and the Stochastic Oscillator's %K (77.74) is above %D (87.56) – which is technically a bullish signal, it's important to note that Stochastic's %K is actually *below* %D here. This is a bearish divergence on the Stochastic, and coupled with the overbought RSI, it adds a layer of caution. The ADX at 40.12 further confirms a strong uptrend, but the combination of overbought RSI and the Stochastic divergence warrants close observation for signs of exhaustion.
Contrasting Signals on the Daily Chart
Diving deeper into the daily chart for WTI reveals a more complex and somewhat contradictory picture. While the 1-hour and 4-hour charts paint a predominantly bullish narrative, the daily timeframe indicates a 'Düşüş' (Downtrend) with a strength of 94%. This stark contrast highlights the potential for significant shifts in market sentiment. The ADX on the daily chart is at 37.37, confirming a strong downward trend, which directly challenges the bullish signals seen on shorter timeframes. This suggests that the longer-term trend might still be bearish, and the current upward move could be a retracement within a larger downtrend. The RSI at 43.15 is in neutral territory but trending downwards, reinforcing the bearish sentiment. However, there are elements suggesting potential for a rebound. The MACD is positive, with the MACD line above its signal line, indicating positive momentum. The Stochastic Oscillator is showing a strong bullish signal, with %K at 65.12 and %D at 27.03, suggesting a significant move out of oversold conditions and a potential upward price discovery. This divergence between the strong daily downtrend (ADX, RSI) and the bullish signals from MACD and Stochastic creates a critical decision point for traders.
The current price of $74.60 sits precariously between the immediate bullish sentiment on shorter timeframes and the dominant bearish trend indicated by the daily ADX. The support levels on the daily chart are $69.94, $67.43, and $66.02, which are considerably lower than the current price, offering ample room for a potential downside move if the bearish trend reasserts itself. Conversely, resistance levels on the daily chart are $73.86, $75.27, and $77.78. The current price of $74.60 is already above the first daily resistance level of $73.86, but it faces significant hurdles at $75.27 and $77.78. The fact that the price has already broken through the $73.86 level is a positive sign for the bulls, but the strong daily ADX suggests this breakout might be temporary. The conflict between shorter-term bullish indicators and the longer-term bearish trend structure is the primary focus for market participants.
Macroeconomic Currents and Geopolitical Winds
The recent surge in WTI prices, pushing it towards the $74.60 mark and beyond, cannot be viewed in isolation. It is occurring within a complex global macroeconomic environment. The Dollar Index (DXY), currently trading at 101.01 and showing a slight daily decline of -0.05%, plays a crucial role. Historically, a weaker dollar often correlates with higher commodity prices, including oil, as oil is typically priced in dollars. The current DXY level suggests that dollar weakness might be providing some underlying support for oil prices. However, the DXY's daily chart shows a strong uptrend (ADX 36.35) and a bullish signal from its Stochastic oscillator, indicating that the dollar might find strength soon, which could cap oil's gains.
Furthermore, global risk sentiment, often gauged by indices like the SP500 and Nasdaq, is also a key factor. The SP500 is currently trading at 6572.87, up 0.74% on the day, indicating a generally positive risk appetite among equity investors. This risk-on environment typically supports demand for commodities like oil. However, the Nasdaq 100, while also showing a daily gain of 0.44% to 29313.54, presents a mixed picture on its 4-hour chart, with a bearish trend and a 'Sat' (Sell) signal, suggesting underlying caution in the tech-heavy sector. This dichotomy in equity markets adds another layer of complexity, as a broad risk-off event could quickly reverse oil's gains.
Geopolitical developments are also paramount in the energy markets. News reports indicate that oil prices surged over 7% to a two-week high on Wednesday after U.S. President Donald Trump declared that the interim ceasefire with Iran was 'over.' This declaration injects a significant geopolitical risk premium into oil prices, as any escalation in tensions in the Middle East can disrupt supply routes and production. Such events often lead to rapid price increases, overriding purely technical considerations. The market will be closely watching any further developments regarding Iran and its implications for global oil supply. This uncertainty is a major driver that can quickly shift the market's focus from technical indicators to fundamental supply risks.
The Influence of Central Bank Policy and Economic Data
The broader economic landscape, heavily influenced by central bank policies, continues to shape commodity markets. While the provided data does not include specific forward-looking statements from the Fed or ECB regarding immediate policy shifts, the market's reaction to past and anticipated actions is crucial. For instance, recent news suggests that the Euro is holding steady as traders assess Fed and ECB interest rate paths, with two central banks showing hawkish tones. This indicates that interest rate differentials and monetary policy divergence remain key drivers for currency markets, which in turn, impacts commodity prices through the DXY. Investors are keenly awaiting the release of FOMC minutes, as highlighted in recent news, which could provide further clarity on the future direction of U.S. monetary policy. Any hints of a more hawkish stance from the Fed could strengthen the dollar and pressure oil prices, while a more dovish tone might support commodities.
Inflationary pressures also remain a significant concern, directly impacting oil prices. While gold prices have seen declines as reviving inflation fears are outweighed by receding Fed rate hike bets and a soft USD, the underlying inflationary environment is still relevant for oil. Higher inflation often necessitates tighter monetary policy, which could slow economic growth and reduce oil demand. Conversely, if inflation remains stubbornly high, it could signal a need for continued production cuts by OPEC+ to support prices, creating a supply-side push. The interplay between inflation expectations, central bank responses, and actual economic growth figures creates a dynamic environment that traders must constantly monitor. The recent 7% surge in oil prices also raises questions about whether this is a sustainable move driven by supply concerns or a temporary reaction to geopolitical news, potentially with inflationary consequences.
Trading Scenarios and Risk Management
Given the conflicting signals between the short-term bullish momentum and the longer-term bearish trend, several scenarios are plausible for WTI Crude Oil around the $74.60 level. The immediate technical setup favors a continuation of the upward move, especially if the $74.97 resistance can be decisively broken. A break above this level, supported by sustained buying volume and confirmation from a daily chart shift, could target the next resistance at $75.27 and potentially extend towards $77.78. This bullish scenario would be validated if the daily ADX starts to trend downwards and RSI moves into overbought territory without divergence, signaling a confirmed shift in trend. The geopolitical news regarding Iran also provides a tailwind for this scenario, injecting a risk premium that could drive prices higher.
However, the strong daily downtrend indicated by the ADX at 37.37 cannot be ignored. If the upward momentum falters at current levels, a reversal could be swift. The immediate support at $74.43, followed by $74.15 and $73.86, becomes critical. A close below $73.86 on the daily chart would invalidate the short-term bullish outlook and suggest a retest of lower support levels. This bearish scenario would be amplified if the DXY finds strength, equity markets turn risk-off, or if the geopolitical tensions surrounding Iran subside without significant supply disruptions. In such a case, traders would be looking to fade rallies and potentially short the market towards the lower support levels.
A neutral or consolidation scenario is also possible, especially if key economic data releases, such as upcoming FOMC minutes or inflation reports, provide no clear direction. In this case, WTI might trade within a range, potentially between the $73.86 support and $75.27 resistance. This range-bound environment would be characterized by lower volatility and indecisive technical signals, requiring traders to adopt more cautious strategies, perhaps focusing on shorter timeframes or waiting for a clearer breakout. The Stochastic Oscillator's current divergence on the 4-hour chart, alongside an overbought RSI, could signal a period of consolidation before the next significant move.
Bearish Scenario: Trend Resumption
65% ProbabilityBullish Scenario: Breakout Continuation
25% ProbabilityNeutral Scenario: Consolidation Phase
10% ProbabilityThe Road Ahead: What to Watch
Looking forward, several factors will be critical in determining WTI's next significant move beyond the current $74.60 level. The upcoming release of the FOMC minutes is a key event that could provide substantial guidance on the Federal Reserve's monetary policy stance. If the minutes reveal a more hawkish outlook, it could strengthen the dollar and put downward pressure on oil prices, potentially validating the bearish signals on the daily chart. Conversely, any indication of a pause or a more dovish tone might support oil prices and help bulls overcome the daily downtrend.
Economic data releases, particularly inflation figures and employment reports, will also play a vital role. Stronger-than-expected inflation data might fuel further geopolitical risk premiums and supply concerns, supporting oil prices, but could also trigger fears of aggressive monetary tightening, which might dampen demand. Conversely, weaker economic data could signal slowing global growth, reducing oil demand and pressuring prices. Traders should also keep a close eye on OPEC+ statements and actions, as their production decisions have a direct and significant impact on global oil supply and price dynamics. The geopolitical situation, especially concerning Iran, remains a wildcard that could introduce sudden volatility and price spikes.
Technically, the conflict between the shorter-term bullish indicators and the daily downtrend structure will likely persist until a clear breakout or breakdown occurs. Traders should pay close attention to the $74.97 resistance and the $73.86 support levels. A decisive move above $74.97, confirmed by increasing volume and positive daily chart shifts, could open the door for higher targets. However, a failure to hold above this level and a subsequent break below $73.86 would likely signal a continuation of the broader bearish trend. Risk management remains paramount, with clear stop-loss orders and position sizing crucial for navigating this uncertain environment.
Frequently Asked Questions: WTI Analysis
What happens if WTI breaks above the $74.97 resistance level?
If WTI breaks decisively above the $74.97 resistance, confirmed by strong volume and positive daily chart signals, the bullish scenario becomes more probable. This could lead to a test of the next resistance level at $75.27, with a potential target towards $77.78.
Should I consider buying WTI at current levels around $74.60 given the mixed signals?
Given the mixed signals, buying at current levels carries significant risk. The 1-hour and 4-hour charts show bullish momentum, but the daily chart indicates a strong downtrend. A more prudent approach would be to wait for confirmation, such as a clear break above $74.97 resistance with bullish validation, or a bounce from established support levels like $73.86.
Is the RSI at 58.3 on the 1H chart a buy signal for WTI?
An RSI of 58.3 on the 1-hour chart is in neutral territory, indicating rising momentum but not yet overbought conditions. While it supports the current upward move, it's not a standalone buy signal. Confirmation from other indicators and price action, such as breaking key resistance levels, is necessary for a more robust buy signal.
How will the upcoming FOMC minutes affect WTI prices this week?
The FOMC minutes could significantly impact WTI. If they reveal a hawkish tone, indicating potential for further interest rate hikes or a prolonged period of high rates, this could strengthen the US Dollar (DXY) and pressure oil prices downwards, potentially validating the daily downtrend. Conversely, a dovish tone might support oil prices by weakening the dollar and signaling less concern about economic slowdown.
| Indicator | Value | Signal | Interpretation |
|---|---|---|---|
| RSI (14) | 58.3 | Neutral | Rising momentum, room before overbought |
| MACD Histogram | 0.47 | Bullish | Positive momentum increasing |
| Stochastic %K | 44.47 | Bullish | Moving out of oversold, potential upside |
| ADX | 33.53 | Strong Trend | Confirms strong uptrend on 1H |
| Bollinger Bands | Middle Band | Above | Price trading above midline, bullish bias |
Track markets in real-time
AI-powered analysis, technical indicators and real-time price data.
Join Our Telegram Channel
Breaking market news, AI analysis and trading signals instantly.
Join Channel