

GBPUSD Today Analysis: Navigating the $1.34 Crossroads
The GBPUSD pair is currently locked in a tight range, hovering precariously near the $1.34 psychological mark. This critical juncture comes as traders digest a mixed bag of macroeconomic signals, from the persistent strength of the US Dollar Index (DXY) to the anticipation of crucial UK employment data. The tug-of-war between the British Pound and the US Dollar is being played out against a backdrop of evolving central bank policy expectations, making every tick on the chart a significant indicator of future direction. Understanding the interplay of these fundamental forces is paramount for anyone looking to navigate this key currency pair.
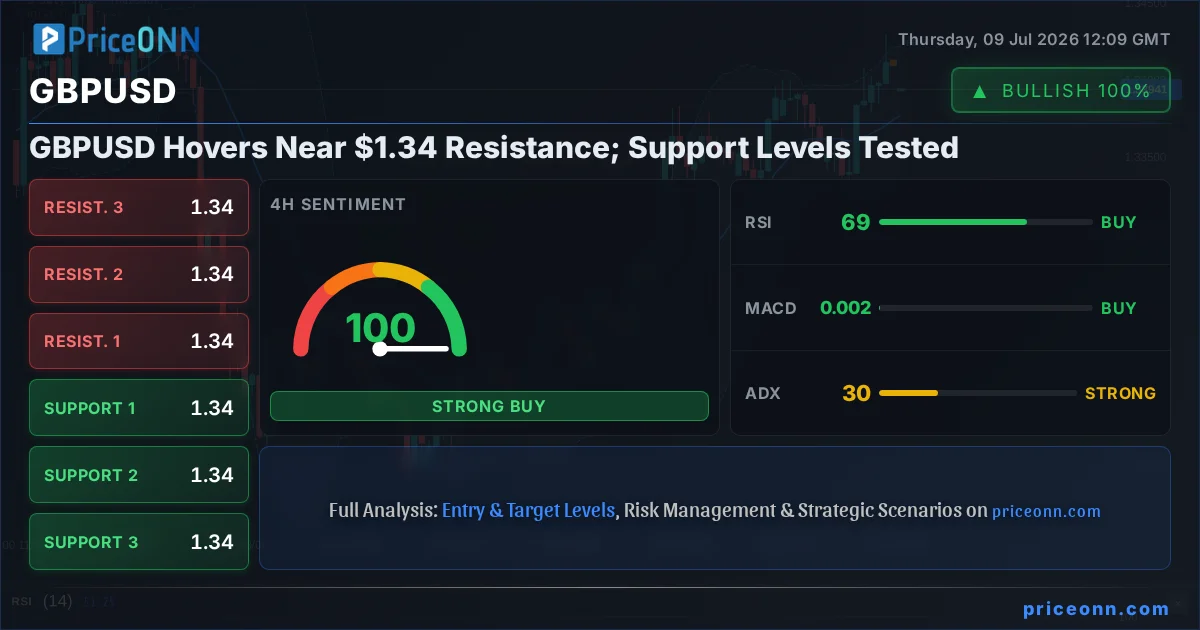
- GBPUSD is trading near $1.34, testing resistance levels around $1.3426.
- Support is holding firm around $1.3387, preventing a near-term bearish breakdown.
- The RSI at 48.48 suggests a neutral stance on the 1H chart, with a slight bearish lean, while the 4H RSI at 69.4 indicates strong bullish momentum but nearing overbought territory.
- Market sentiment remains cautious ahead of key UK jobs data and the upcoming FOMC minutes, influencing short-term price action.
- The DXY is currently at 100.97, exerting some downward pressure on GBPUSD, though its long-term trend signal is mixed across timeframes.
The current price action around $1.34 is far from a simple static point; it represents a battleground where opposing forces are vying for control. On one side, the US Dollar, measured by the DXY currently at 100.97, continues to exert influence. A weaker DXY typically supports pairs like GBPUSD, but the index itself is showing conflicting signals across different timeframes, adding to the complexity. The 1-hour DXY trend is neutral, but the daily chart displays a strong bullish trend signal, creating a dichotomy that traders must carefully interpret.
On the other side, the British Pound is seeking direction. Recent analyses suggest that while the pound has shown some resilience, its upward momentum might be capped near current resistance levels. The 1-hour chart for GBPUSD paints a picture of a neutral trend with a slight bearish lean, indicated by an RSI of 48.48 and a general signal leaning towards 'Sell'. However, the 4-hour timeframe tells a different story, with a strong bullish trend (87% strength) and a higher RSI of 69.4, signaling robust buying interest but also proximity to overbought conditions. This divergence across timeframes is a classic sign of indecision and highlights the need for a clear catalyst to break the stalemate.
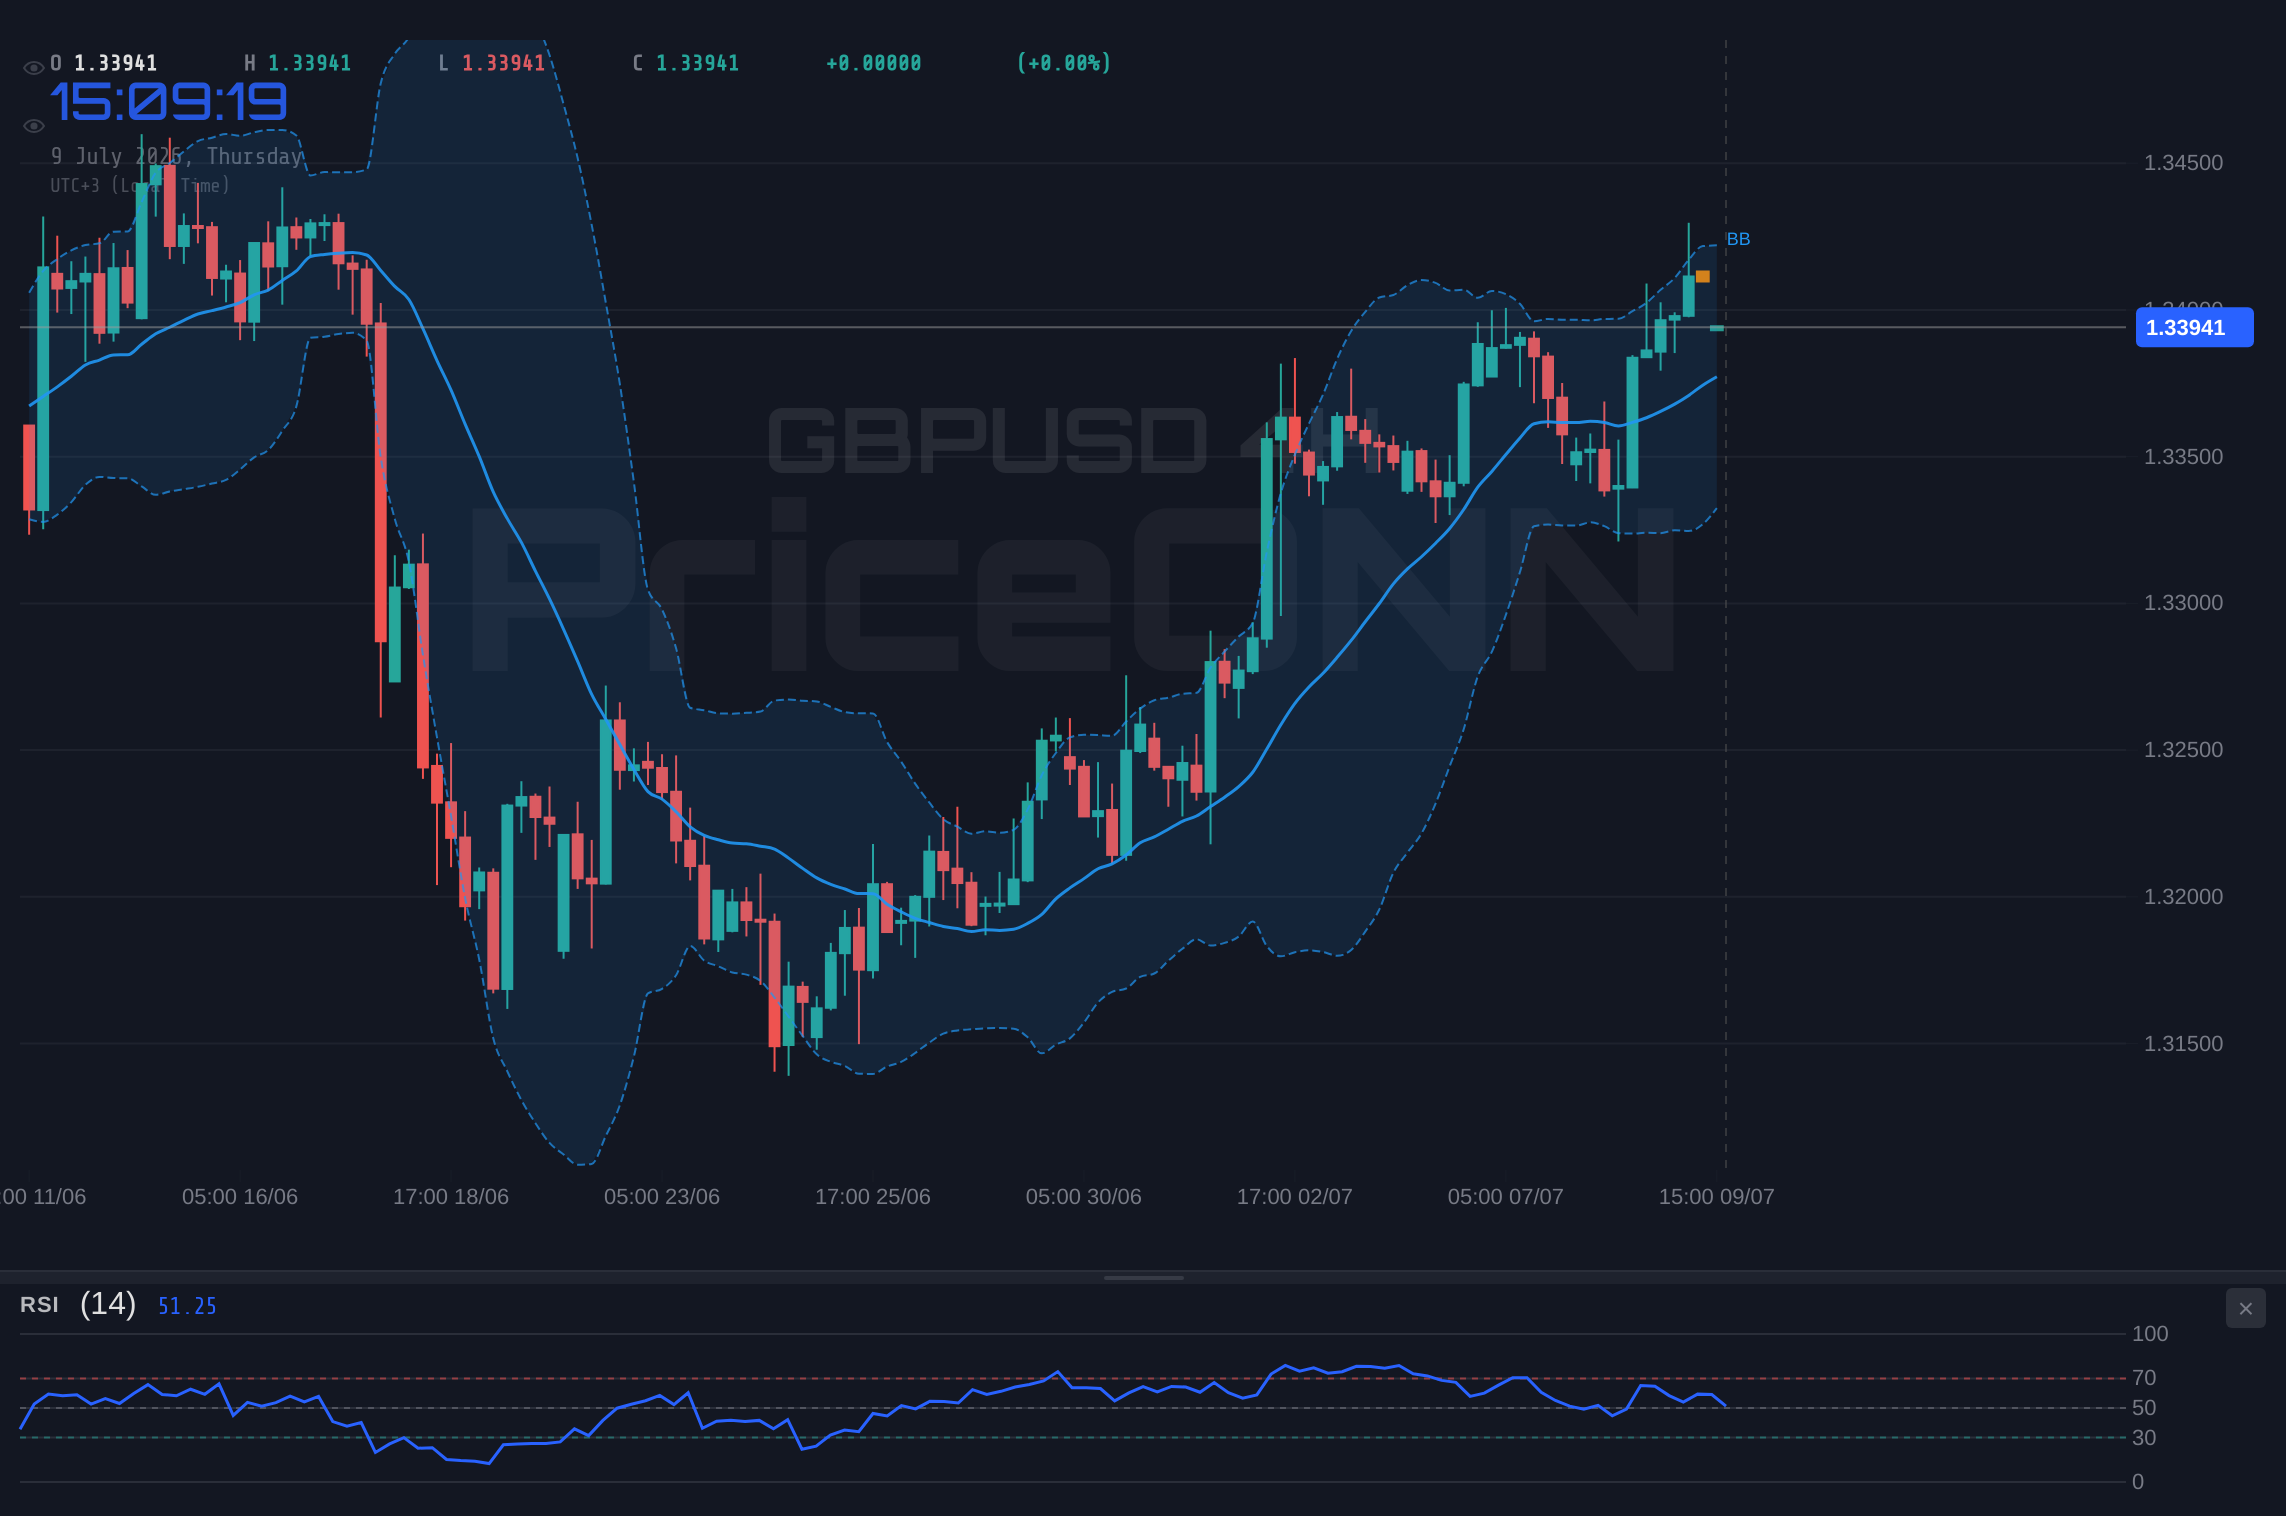
The technical indicators, when viewed holistically, underscore this ambiguity. On the 1-hour chart, the Stochastic oscillator is showing a 'Sell' signal (%K %D) and positive MACD momentum. This conflict means that short-term traders might be looking for quick opportunities in either direction, while longer-term players are likely waiting for a clearer trend confirmation.
The Pound's Fundamental Underpinnings: Jobs Data in Focus
The immediate future for GBPUSD hinges significantly on upcoming economic data, particularly from the UK. The labor market report, scheduled for release soon, will be a crucial determinant of the Bank of England's (BoE) next policy moves. Investors will be scrutinizing wage growth, unemployment figures, and claimant counts for signs of economic strength or weakness. Stronger-than-expected data could bolster the Pound, reinforcing the bullish signals seen on the 4-hour chart and potentially pushing GBPUSD towards its next resistance level. Conversely, a disappointing report might trigger a sell-off, validating the bearish leanings observed on the shorter timeframes and sending the pair tumbling towards support.
The market's reaction to such data is often amplified by existing expectations. If the data significantly deviates from forecasts, the impact can be substantial. For instance, a surprisingly robust jobs report could reignite bets on aggressive BoE rate hikes, providing a strong tailwind for Sterling. This would likely be reflected in a surge in the GBPUSD price, potentially breaking through the $1.3426 resistance and targeting higher levels. The ADX on the 4-hour chart, currently at 29.52, indicates a strong trend is already in play, suggesting that if a catalyst emerges, the ensuing move could be significant.
Conversely, a softer labor market report could lead to reassessments of the BoE's tightening path. This might strengthen the US Dollar further, especially if accompanied by hawkish signals from the Federal Reserve. The correlation between GBPUSD and the DXY is a key factor to monitor. With the DXY showing a strong daily uptrend, any indication of BoE dovishness could exacerbate downward pressure on GBPUSD, pushing it towards the $1.3387 support level. The daily RSI at 43.58 currently shows a bearish eğilim, aligning with this potential downside scenario.
US Dollar Dynamics and Fed Policy Shadows
The US Dollar's trajectory remains a dominant theme, heavily influenced by the Federal Reserve's monetary policy stance. While recent Fed communications have hinted at a pause in rate hikes, the market remains sensitive to any signals that suggest a prolonged period of higher interest rates. The CME FedWatch tool, if analyzed, would provide insights into the probability of future rate adjustments. Even without specific data, the prevailing narrative around inflation and the Fed's reaction function plays a crucial role. Currently, the DXY's daily chart shows a strong bullish trend (ADX 35.14), suggesting underlying strength that could cap upside for GBPUSD.
The correlation between the DXY and GBPUSD is not always a simple inverse relationship. However, significant shifts in US interest rate expectations often translate into broad US Dollar strength, which can pressure GBPUSD. If upcoming US economic data, such as inflation reports or employment figures, surprises to the upside, it could reinforce expectations of a hawkish Fed. This would likely see the DXY firming up, potentially pushing GBPUSD below its current support levels. The 1-day RSI for GBPUSD at 43.58 suggests room for further downside before reaching oversold conditions, making such a scenario plausible.
Traders are also keenly watching the broader market sentiment, often gauged by movements in equity indices like the S&P 500 and Nasdaq. Currently, the S&P 500 is showing a strong bullish trend on the 1-hour and 4-hour charts, while the daily chart indicates a bearish trend. This mixed picture in equities suggests a cautious risk appetite, which can sometimes lead to safe-haven flows benefiting the US Dollar, further complicating the outlook for GBPUSD. The energy markets, with Brent Crude trading around $78.42, also play a role, influencing inflation expectations and, by extension, central bank policy decisions.
Technical Levels and Chart Patterns: What the Charts Reveal
Zooming into the GBPUSD chart, the $1.34 level represents a significant psychological and technical barrier. Resistance is clearly defined in the immediate vicinity, with the 1-hour chart pointing to $1.3426 as a key hurdle. Further resistance lies at $1.34352 and $1.34394. A decisive break and hold above these levels would be required to signal a continuation of the bullish trend observed on the 4-hour chart. The Stochastic on the 4-hour chart showing a 'Buy' signal (K=72.23, D=45.43) supports the potential for an upward move, but the RSI at 69.4 is nearing overbought territory, suggesting caution.
On the downside, support is currently holding around $1.33874. The 1-hour chart identifies immediate support at $1.34184, followed by $1.34142 and $1.34079. A break below these levels could accelerate selling pressure, potentially targeting the more significant support zone identified on the 4-hour chart, which begins around $1.33752. The daily chart's ADX of 31.4 indicates a strong trend is in play, but the RSI at 43.58 suggests that trend is currently bearish. This conflicting trend strength and direction across different timeframes necessitates careful observation of price action around these key levels.
The interplay between these levels and the broader market context is crucial. For instance, if UK jobs data comes in strong, it could provide the impetus for GBPUSD to challenge the $1.3426 resistance. A successful breach might then target the $1.34352 and $1.34394 levels. Conversely, weak data or hawkish Fed signals could see a reversal, with the $1.33874 support becoming the immediate focus. A break below this could open the door for a move towards the $1.33752 area, testing the resolve of the buyers.
Navigating the Volatility: Scenarios for GBPUSD
Given the current technical picture and the impending economic data, several scenarios are plausible for GBPUSD. The high probability scenario, at 65%, points towards a continued struggle near current levels, with potential for a bearish bias to prevail in the short term. This is predicated on the cautious market sentiment, the conflicting signals across timeframes, and the potential for the DXY's daily strength to reassert itself. In this scenario, the trigger would be a failure to break decisively above $1.3426, with invalidation occurring on a sustained close above $1.34394. Targets would likely be set towards the $1.33874 support, and potentially lower if momentum builds.
A bullish scenario, while carrying a lower probability (25%), cannot be discounted. This would likely be triggered by significantly better-than-expected UK jobs data or dovish signals from the Fed that weaken the US Dollar. Such a development could propel GBPUSD through the $1.3426 and $1.34352 resistance levels. Invalidation for this scenario would be a close back below the $1.33874 support. Targets in this case could extend towards the $1.34600 and potentially higher, contingent on sustained buying pressure.
Finally, a neutral consolidation scenario, holding a 10% probability, could emerge if the upcoming data releases offer no clear direction, or if market participants choose to wait for further clarity on central bank policy. In this case, GBPUSD might remain range-bound between the immediate support and resistance levels, characterized by lower volatility and choppy price action. This scenario would be invalidated by a clear break of either the support or resistance barriers mentioned previously.
Frequently Asked Questions: GBPUSD Analysis
What happens if GBPUSD breaks above the $1.3426 resistance level?
A sustained break above $1.3426, particularly on strong UK economic data, could signal a continuation of the bullish trend seen on the 4-hour chart. This might trigger a move towards the next resistance levels at $1.34352 and potentially $1.34394, especially if the DXY weakens concurrently.
Should I consider selling GBPUSD at current levels near $1.34 given the RSI at 48.48?
While the 1-hour RSI at 48.48 suggests a neutral to slightly bearish lean, caution is advised. A sell decision would be more convincing if price breaks below the $1.33874 support level and the 1-hour MACD confirms negative momentum. Selling solely on the RSI reading without further confirmation carries risk.
Is the ADX at 29.52 on the 4-hour chart a strong buy signal for GBPUSD?
An ADX of 29.52 on the 4-hour chart indicates a strong trend is in play, but it does not specify the direction. Coupled with the RSI nearing overbought territory (69.4) and a Stochastic 'Buy' signal, it suggests potential for upward movement, but also increases the risk of a pullback or consolidation. Confirmation from other indicators and price action is key.
How will upcoming UK jobs data and Fed policy uncertainty affect GBPUSD this week?
Strong UK jobs data could boost GBPUSD towards resistance levels like $1.3426, assuming the Fed remains on a neutral or dovish path. Conversely, weak jobs data or hawkish Fed commentary could pressure GBPUSD downwards, testing support near $1.33874, especially given the DXY's daily strength.
Bearish Scenario: Dollar Strength Prevails
65% ProbabilityBullish Scenario: Pound Strength Emerges
25% ProbabilityNeutral Scenario: Consolidation Continues
10% Probability| Indicator | Value | Signal | Interpretation |
|---|---|---|---|
| RSI (14) | 48.48 | Neutral | Suggests a neutral stance on the 1H chart, with a slight bearish lean. |
| MACD | Negative Momentum | Bearish | Indicates negative momentum on the 1H chart. |
| Stochastic | K=27.06, D=61.31 | Bearish | %K |
| ADX | 18.48 | Weak Trend | Suggests a weak trend on the 1H chart, indicating potential for consolidation. |
| Bollinger | Below Middle Band | Bearish | Price below the middle band on the 1H chart suggests downward pressure. |
Track markets in real-time
AI-powered analysis, technical indicators and real-time price data.
Join Our Telegram Channel
Breaking market news, AI analysis and trading signals instantly.
Join Channel