

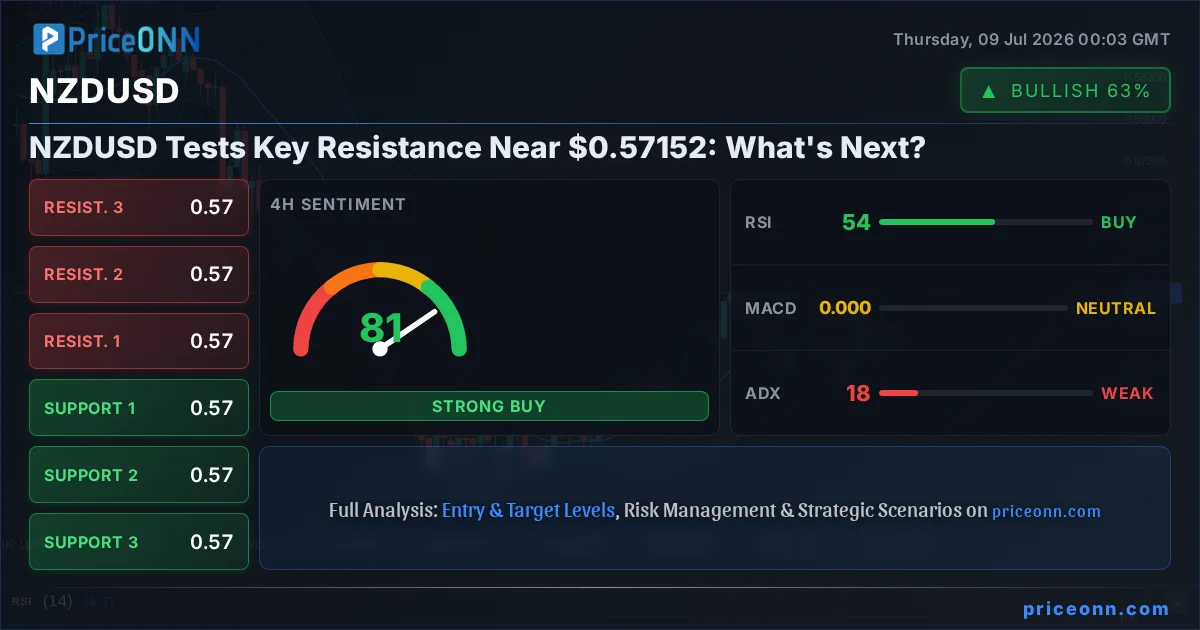
The narrative around NZDUSD is starting to get interesting, with the pair currently probing levels just above $0.57152. Having seen a notable push higher in recent trading sessions, the question on many traders' minds is whether this momentum can be sustained or if we're about to witness a classic case of resistance holding firm. This isn't just another daily fluctuation; the technical picture, when viewed across multiple timeframes, presents a complex tapestry of conflicting signals that demand careful interpretation. Understanding the interplay between short-term strength and longer-term trends is crucial for navigating the choppy waters that NZDUSD has been experiencing.
- RSI at 61.13 on the 1H chart signals overbought pressure, suggesting potential exhaustion for the current upward move.
- Critical resistance sits at $0.57116, tested multiple times this week, acting as a key barrier for further upside.
- The ADX at 14.28 on the 1H timeframe indicates a weak trend, suggesting the current price action might be consolidating rather than trending.
- Market sentiment for NZDUSD appears mixed, with daily signals leaning towards caution despite short-term bullish indicators.
The recent upward swing in NZDUSD has brought it tantalizingly close to a significant resistance zone. From a technical standpoint, the 1-hour chart shows the pair hovering around $0.57152, a level that has previously acted as a ceiling. The RSI(14) on this timeframe is sitting at 61.13, which, while not extreme, suggests that the buying pressure might be cooling off. This is a critical observation for short-term traders who might be looking for confirmation before committing to new positions. The MACD is showing positive momentum, and the Stochastic oscillator, with K at 79.98 and D at 73.19, is in overbought territory, hinting at a potential pullback. However, the ADX at 14.28 is a stark reminder that the overall trend strength is weak, implying that any move might lack conviction and could quickly reverse.
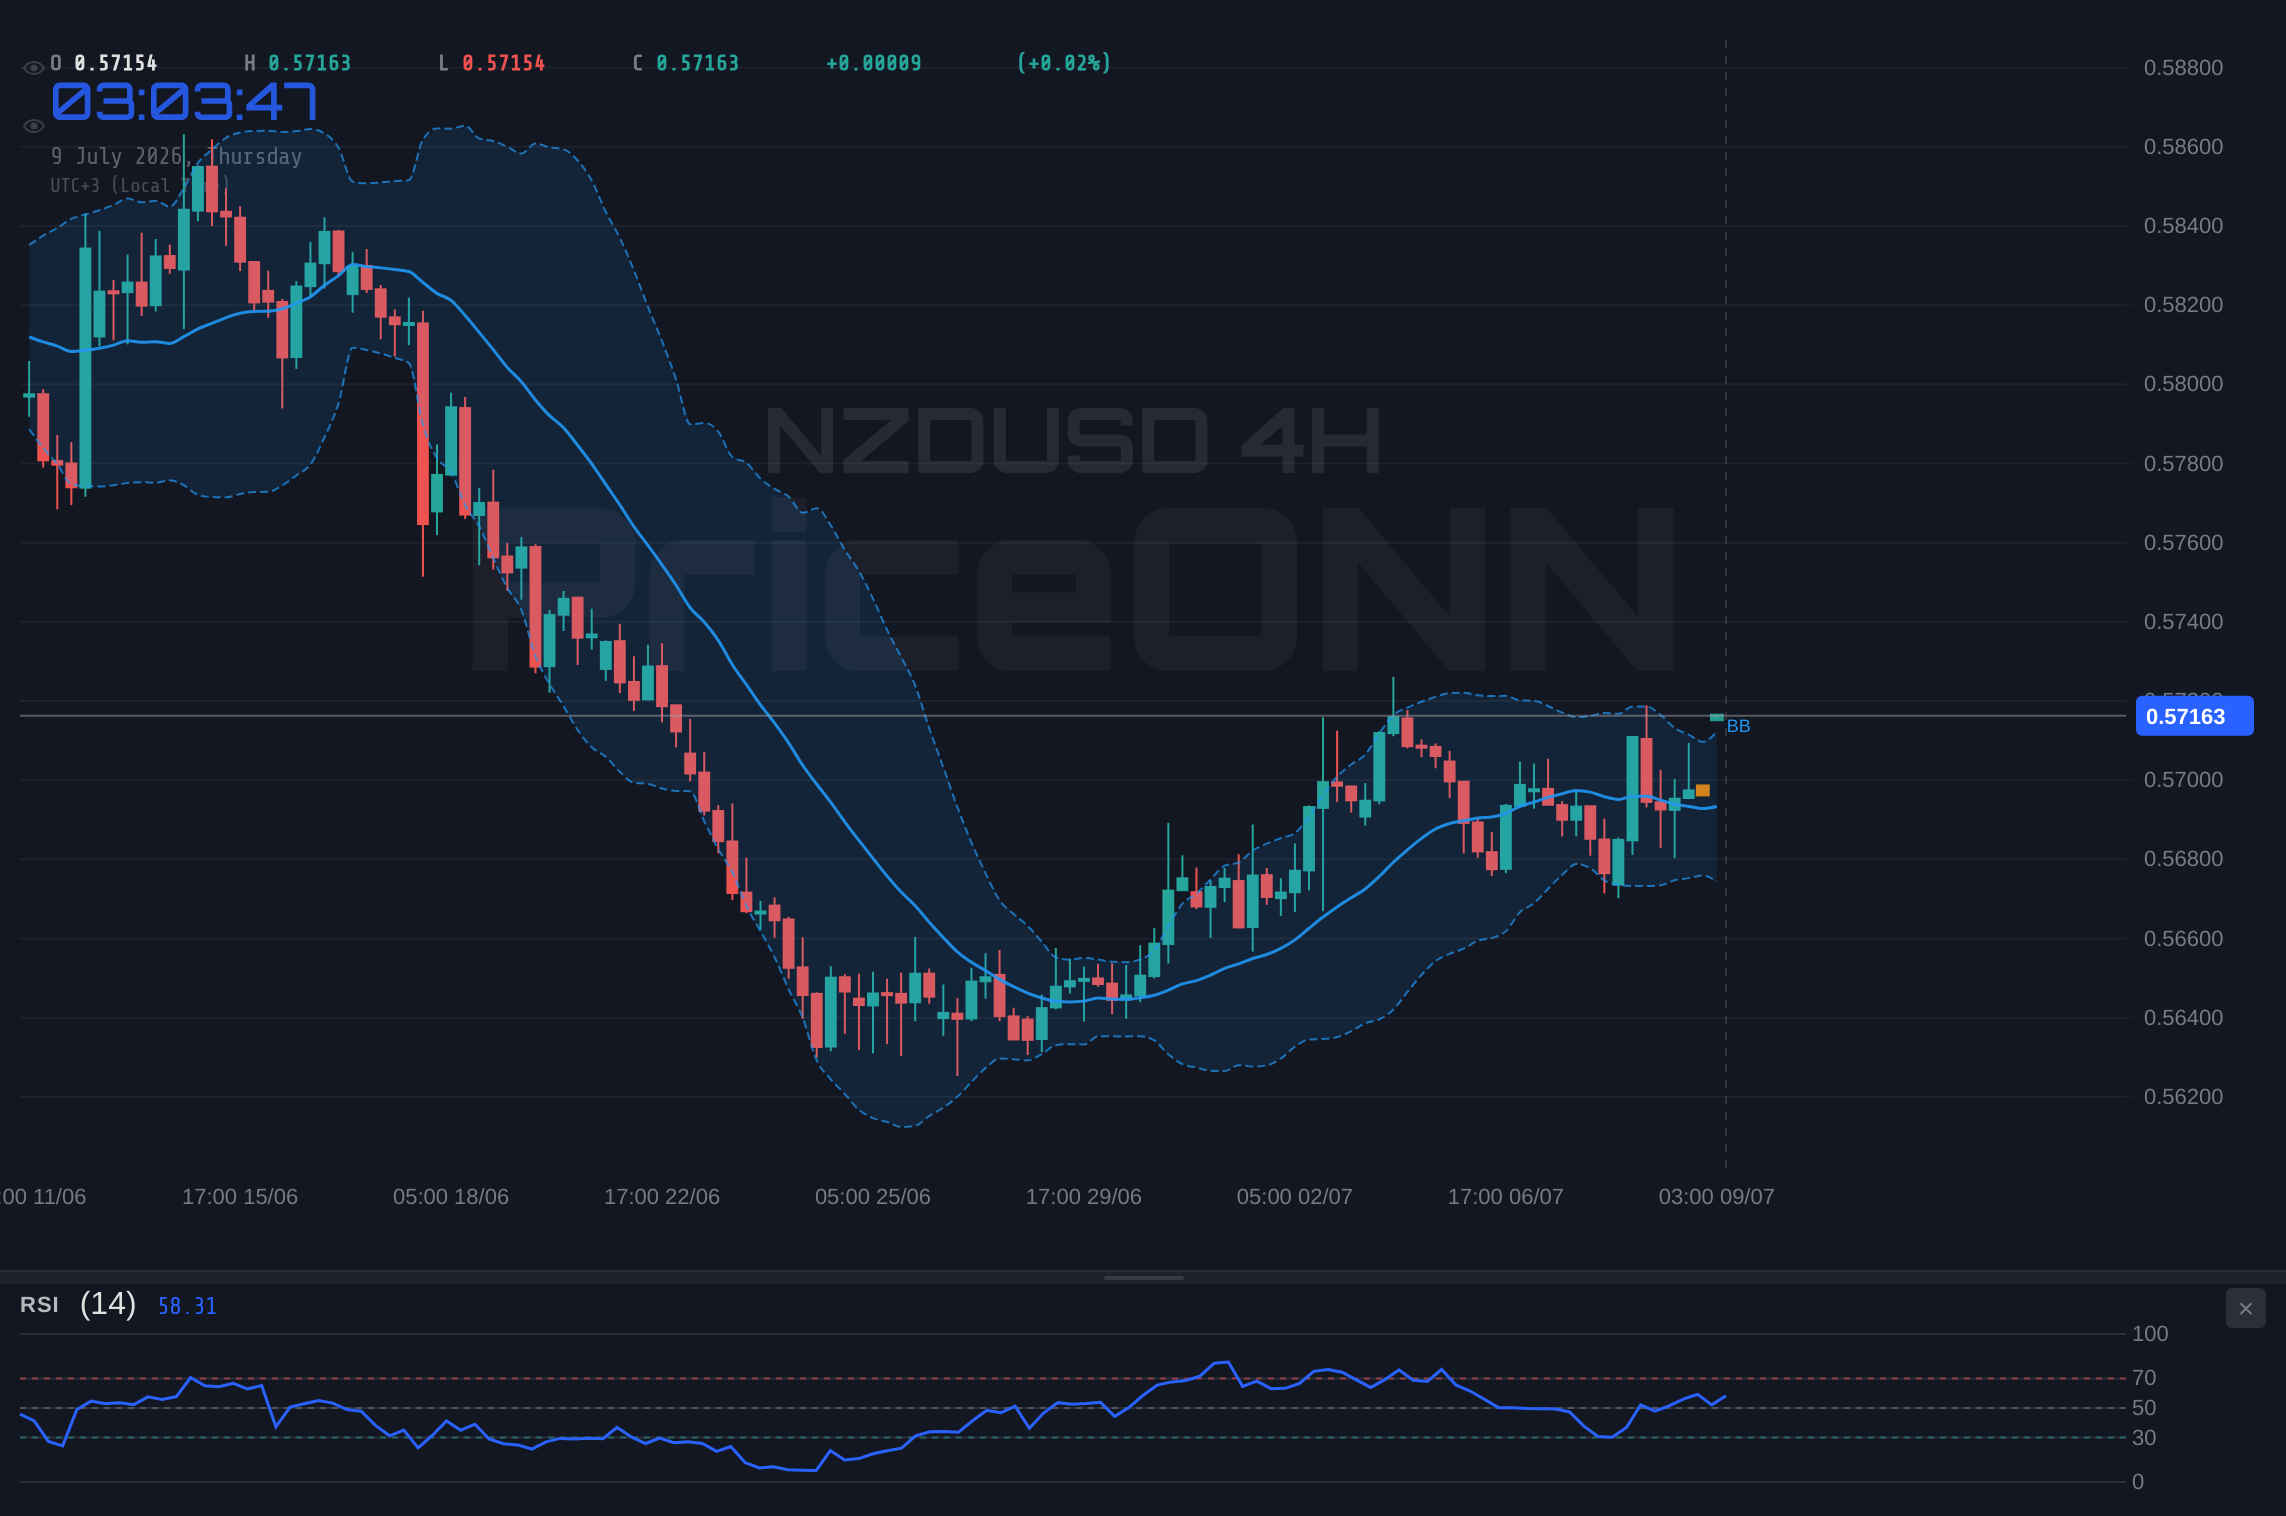
When we shift our gaze to the 4-hour timeframe, the picture becomes even more nuanced. Here, the trend is classified as neutral with moderate strength, and the RSI(14) is at 53.64, a more balanced reading that doesn't immediately signal overbought or oversold conditions. The MACD is showing momentum that is currently balancing, neither strongly positive nor negative. The Stochastic oscillators (K=51.13, D=51.83) are hovering around the midpoint, indicating a lack of clear direction or potential consolidation. The ADX here is also relatively weak at 17.6, reinforcing the idea that the market is in a choppy, range-bound phase on this timeframe. This suggests that while the 1-hour chart might be showing some signs of fatigue, the broader 4-hour structure doesn't yet offer a strong signal for a reversal or a continuation.
The Daily Perspective: A Conflicted Outlook
Moving out to the daily chart, the NZDUSD presents a decidedly neutral trend with a 50% strength rating. This is where the real ambiguity lies. The RSI(14) is at 42.63, indicating a bearish inclination but still well within the neutral zone. The MACD is showing positive momentum, with the MACD line above the signal line, which might seem bullish at first glance. However, this is juxtaposed against a Bollinger Band setup that shows the price beneath the middle band, suggesting a bearish bias in the longer term. The Stochastic is showing a bullish signal with K at 65.08 and D at 54.65, indicating potential for upward movement, yet the ADX at 32.02 signals a strong downward trend. This confluence of conflicting signals on the daily chart underscores the indecision currently gripping the pair.
The price action around the $0.57152 mark is critical. On the 1-hour chart, the immediate resistance levels are $0.5705, $0.57072, and $0.57116. Should the pair manage to break decisively above $0.57116 with strong volume and conviction, it could signal an attempt to challenge higher grounds. However, the immediate support levels at $0.56984, $0.5694, and $0.56918 are also important. A break below these could quickly negate any short-term bullish sentiment and send the pair tumbling back towards lower levels, potentially testing the 4-hour support zone.
Looking at the 4-hour timeframe, the support levels are more pronounced, sitting at $0.56836, $0.5672, and $0.56636. These represent significant areas where buying interest has historically emerged. Conversely, resistance on this timeframe is found at $0.57036, $0.5712, and $0.57236. The fact that the current price is hovering just below the 4-hour resistance suggests a battle is underway. A sustained move above $0.57236 would likely indicate a shift in sentiment, potentially opening the door for further gains. However, failure to overcome this resistance could lead to a retest of the aforementioned support levels.
On the daily chart, the support structure begins at $0.56635, followed by $0.56504, and then a more significant floor at $0.56295. These are longer-term levels that, if breached, would signal a more substantial bearish trend developing. The resistance levels on the daily chart are $0.56975, $0.57184, and $0.57315. The proximity of the current price to the daily resistance at $0.57184 is a key focal point. A daily close above this level would be a significant bullish development, suggesting a potential shift in the longer-term outlook.
The Dollar's Shadow: DXY's Influence
It's impossible to discuss NZDUSD without acknowledging the significant influence of the US Dollar Index (DXY). Currently trading around 101.04, the DXY is showing a mixed picture across timeframes. On the 1-hour chart, it's in a neutral trend with a bearish signal, RSI at 49.8, and MACD negative. However, the 4-hour chart flips this, showing a neutral trend with a bullish signal, RSI at 50.92, and positive MACD momentum. The daily chart, however, leans bullish again, with a strong ADX of 36.35 indicating a solid upward trend, even though the RSI is at 60.25 and the Stochastic is showing a bearish signal. This conflicting DXY data mirrors the indecision seen in NZDUSD, suggesting that the dollar's path is also unclear, adding another layer of complexity for currency traders.
When the DXY strengthens, it typically exerts downward pressure on pairs like NZDUSD, as a stronger dollar makes the New Zealand dollar relatively more expensive. Conversely, a weaker dollar can provide a tailwind for NZDUSD. Given the mixed signals from the DXY, it's likely contributing to the choppy price action we're observing in NZDUSD. If the DXY were to break decisively above its 4-hour resistance of 101.2, it could spell trouble for NZDUSD, potentially pushing it back towards its daily support levels. Conversely, a break below the DXY's 1-hour support at 100.84 might offer some relief to the kiwi.
Correlations and Contrasts: Equities and Oil
Beyond the dollar's influence, the broader market sentiment, often reflected in equity indices like the SP500 and Nasdaq, plays a role. The SP500 is currently showing a strong upward trend on the 1-hour chart (Price: 6572.87, Change: +0.74%) but a neutral stance on the 4-hour and a bearish trend on the daily. This divergence suggests underlying weakness despite short-term gains. The Nasdaq, similarly, shows a neutral 1-hour trend but a bearish 4-hour and daily trend. This mixed performance in US equities indicates a cautious risk appetite. Typically, a risk-off environment would see investors flee to safe-haven assets, potentially benefiting currencies like the USD or JPY, and perhaps even gold, while putting pressure on risk-sensitive currencies like the NZD.
Oil prices, particularly Brent Crude (Current Price: $78.69, Change: +3.97%), have seen a significant surge. This rise in oil prices, often seen as an inflation hedge and a bellwether for global demand, could have mixed implications. For commodity-linked currencies like the NZD, rising oil prices can sometimes be a positive sign, reflecting increased global economic activity. However, if this surge is driven by geopolitical tensions, as suggested by recent news of Iran's ceasefire being declared 'over', it could also contribute to broader market uncertainty and a flight to safety, which might counteract any positive impact on the kiwi. The sharp jump in oil prices also fuels inflation concerns, which could influence central bank policy expectations, a key driver for currency markets.
Navigating the Technical Crosscurrents
The conflicting signals across different technical indicators and timeframes for NZDUSD are the defining characteristic of the current market environment. On the 1-hour chart, we see overbought Stochastic readings and RSI nearing that zone, coupled with a weak ADX. This suggests the immediate upward momentum might be unsustainable. Yet, the MACD still shows positive momentum, and the overall signal is leaning towards 'BUY' on this timeframe. This is a classic 'head fake' scenario where short-term indicators might lure traders into a trade that the longer-term picture doesn't support.
The 4-hour and daily charts paint a more cautious picture. The neutral to bearish leanings on these longer timeframes, indicated by RSI levels below 50 and the ADX's persistent strength in suggesting a downward trend (32.02 on daily), cannot be ignored. The fact that the current price is bumping against resistance levels on both the 1-hour and 4-hour charts, while the daily resistance at $0.57184 looms large, creates a significant technical hurdle. Traders are essentially waiting for a catalyst to break this deadlock – either a strong push through resistance, backed by solid volume and fundamental news, or a decisive rejection that sends the pair back into its established trading ranges.
Scenario Analysis: What Could Happen Next?
Bearish Scenario: Resistance Holds Firm
60% ProbabilityNeutral Scenario: Consolidation Continues
30% ProbabilityBullish Scenario: Resistance Breakout
10% ProbabilityThe current technical setup for NZDUSD is a classic example of market indecision, where short-term momentum clashes with longer-term trends and key resistance levels. The mixed signals from indicators like RSI, MACD, and ADX across 1-hour, 4-hour, and daily charts create a scenario ripe for consolidation or a potential reversal if key levels fail to hold. Traders looking to capitalize on this situation must exercise extreme patience and wait for clear confirmation before entering any positions. Chasing the price action here without a defined edge is a recipe for frustration.
What Traders Should Watch For
The immediate focus remains on the price action around the $0.57116 to $0.57184 resistance zone. A failure to break through this area, especially on the daily chart, would likely reinforce the bearish bias suggested by the ADX and longer-term RSI readings. Conversely, a decisive breakout above $0.57184, particularly if accompanied by a surge in trading volume and positive news flow (perhaps related to RBNZ policy expectations or a significant shift in global risk sentiment), could signal the start of a new upward trend. However, given the current weak trend strength indicated by the ADX on shorter timeframes, such a breakout might be short-lived if not fundamentally supported.
The volatility in oil prices, driven by geopolitical news, adds another layer of complexity. A continued surge in oil could, in theory, benefit commodity-linked currencies like the NZD. However, if the surge is primarily due to escalating tensions, it might also trigger a broader risk-off sentiment, which typically favors safe-haven currencies like the USD, thus creating opposing forces on NZDUSD. Traders need to monitor the narrative surrounding oil and its impact on global risk appetite. Similarly, the mixed signals from the DXY mean that the dollar's direction is not a clear tailwind or headwind for NZDUSD at this moment, further contributing to the pair's sideways drift.
The key takeaway for any trader watching NZDUSD right now is the importance of the current resistance zone. Patience is paramount. Waiting for a clear break of resistance, ideally confirmed by daily candle closes and increasing volume, or a decisive rejection leading to a retest of support levels, will be crucial for identifying high-probability trading opportunities. Entering trades prematurely in this environment, based on conflicting short-term signals, is highly speculative and carries significant risk. The market is currently presenting a puzzle, and solving it requires a disciplined approach, waiting for the pieces to fall into place.
Frequently Asked Questions: NZDUSD Analysis
What happens if NZDUSD breaks above the $0.57184 daily resistance?
A sustained daily close above $0.57184, especially with increased volume, would likely invalidate the current bearish leanings and could signal a move towards higher resistance levels around $0.57315. This would suggest a shift in market sentiment, potentially driven by positive fundamental news or a change in global risk appetite.
Is the RSI at 61.13 on the 1H chart a sell signal for NZDUSD right now?
An RSI of 61.13 on the 1-hour chart suggests some upward momentum, but it's not yet in extreme overbought territory. While it indicates the buying pressure might be cooling, it's not a standalone sell signal. Confirmation from other indicators and price action, like a rejection from resistance at $0.57116, would be needed for a high-probability bearish trade.
How will the mixed DXY signals affect NZDUSD this week?
The conflicting signals from the DXY across different timeframes contribute to the indecision in NZDUSD. If the DXY strengthens, it could pressure NZDUSD lower. Conversely, a weaker dollar might offer some support. Traders should watch for a clearer trend emerging in the DXY before relying on it as a directional catalyst for NZDUSD.
Should I consider trading NZDUSD at current levels near $0.57152?
Trading NZDUSD at current levels near $0.57152 is highly speculative due to the mixed technical signals and proximity to resistance. A more prudent approach would be to wait for a clear break of either the $0.57184 resistance or a confirmed rejection leading to a test of support levels like $0.56984.
Technical Outlook Summary
| Indicator | Value | Signal | Interpretation |
|---|---|---|---|
| RSI (14) | 61.13 | Neutral | Slightly overbought on 1H, neutral on 4H, bearish bias on Daily. |
| MACD Histogram | Positive | Bullish | Positive momentum on 1H and Daily, balancing on 4H. |
| Stochastic | K=79.98, D=73.19 | Bearish | Overbought on 1H, neutral on 4H, bullish on Daily - conflicting signals. |
| ADX | 14.28 | Weak | Indicates a lack of strong trend on 1H and 4H, suggesting choppy conditions. |
| Bollinger | Middle Band | Watch | Price near middle band on 4H, below on 1H and Daily, suggesting mixed bias. |
Track markets in real-time
AI-powered analysis, technical indicators and real-time price data.
Join Our Telegram Channel
Breaking market news, AI analysis and trading signals instantly.
Join Channel