

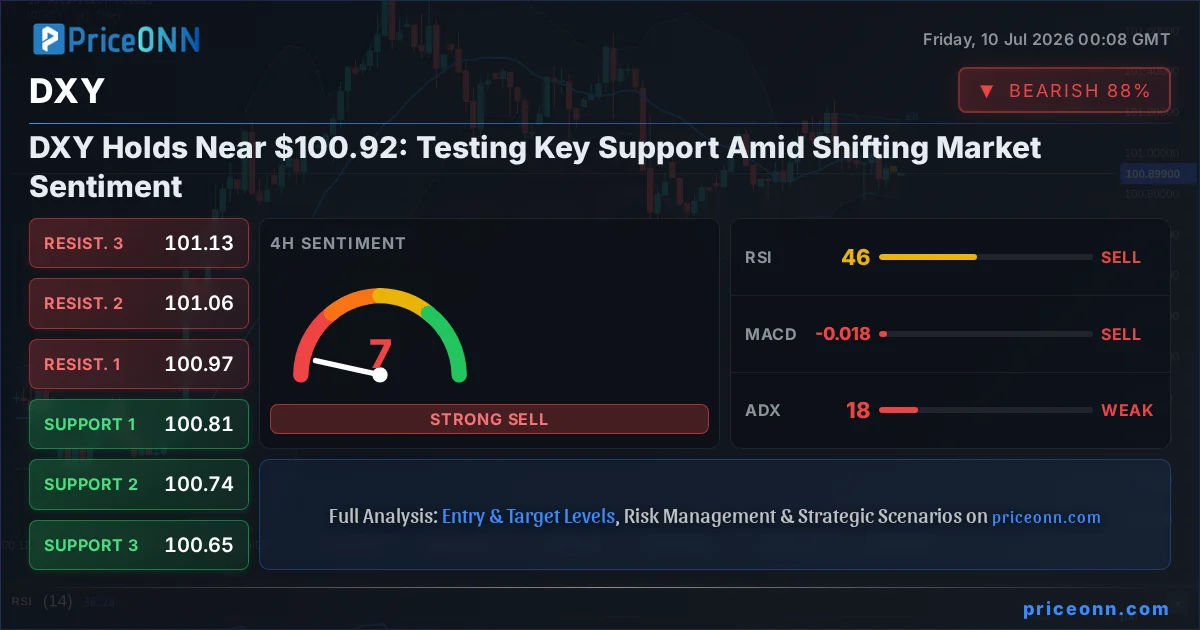
The US Dollar Index (DXY), a critical barometer of global currency strength, is currently navigating a delicate phase, trading near the $100.92 mark. This price point is more than just a number; it represents a crucial juncture where recent price action, technical indicators, and underlying economic narratives converge. As traders and analysts alike scrutinize every tick, understanding the forces at play around this level is paramount for deciphering the dollar's next move in the complex tapestry of global finance. The DXY's ability to hold or break below current support levels will not only dictate its short-term trajectory but also send ripples across major currency pairs, commodities like gold, and global equity markets.
- The DXY is trading at $100.92, testing critical support levels.
- RSI at 48.26 on the 1H chart indicates a neutral but leaning bearish momentum, while the 1D chart shows a stronger bearish trend (ADX 37.58).
- Key support levels are identified at $100.89, $100.85, and $100.82, while resistance looms at $100.96, $100.99, and $101.03.
- Recent news highlights a falling DXY due to cooling inflation fears, suggesting a potential shift in risk sentiment.
Navigating the Dollar's Current Stance: A Technical Perspective
On the 1-hour chart, the DXY presents a mixed technical picture, leaning slightly towards caution. The Relative Strength Index (RSI) hovers at 48.26, a level that suggests neither strong overbought nor oversold conditions, but the slight downward lean indicates a subtle bearish momentum is building. This is further corroborated by the MACD, which, while showing positive momentum on this short timeframe, is being closely watched for any signs of weakening against its signal line. The Bollinger Bands are currently positioned below the middle band, hinting at a bearish inclination in the immediate term. However, the Stochastic Oscillator, with %K at 43.29 and %D at 31.58, is flashing a potential bullish signal as %K has crossed above %D, suggesting a possible short-term bounce is brewing. The Average Directional Index (ADX) at 15.06 signifies a weak trend, indicating that the market is not strongly committed to a particular direction on this very short timeframe, leaving room for volatility.
Moving to the 4-hour timeframe, the narrative becomes clearer and leans more definitively bearish. The RSI here sits at 45.81, reinforcing the notion of bearish momentum continuing to build. The MACD histogram is negative and positioned below the signal line, a classic sign of bearish pressure gaining ground. The Bollinger Bands remain firmly below the middle band, underscoring the prevailing downward sentiment. The Stochastic Oscillator further solidifies this view, with %K at 33.47 and %D at 34.29, indicating a bearish crossover as %K dips below %D. The ADX reading of 18.37, while still in the 'weak trend' territory, points towards a market that is consolidating bearishly rather than trending strongly in either direction. This suggests that while a sharp downtrend isn't immediately evident, the path of least resistance appears to be downwards. The overall signal on this timeframe leans towards selling, with 1 sell signal and 7 neutral signals, reflecting this indecision within a bearish context.
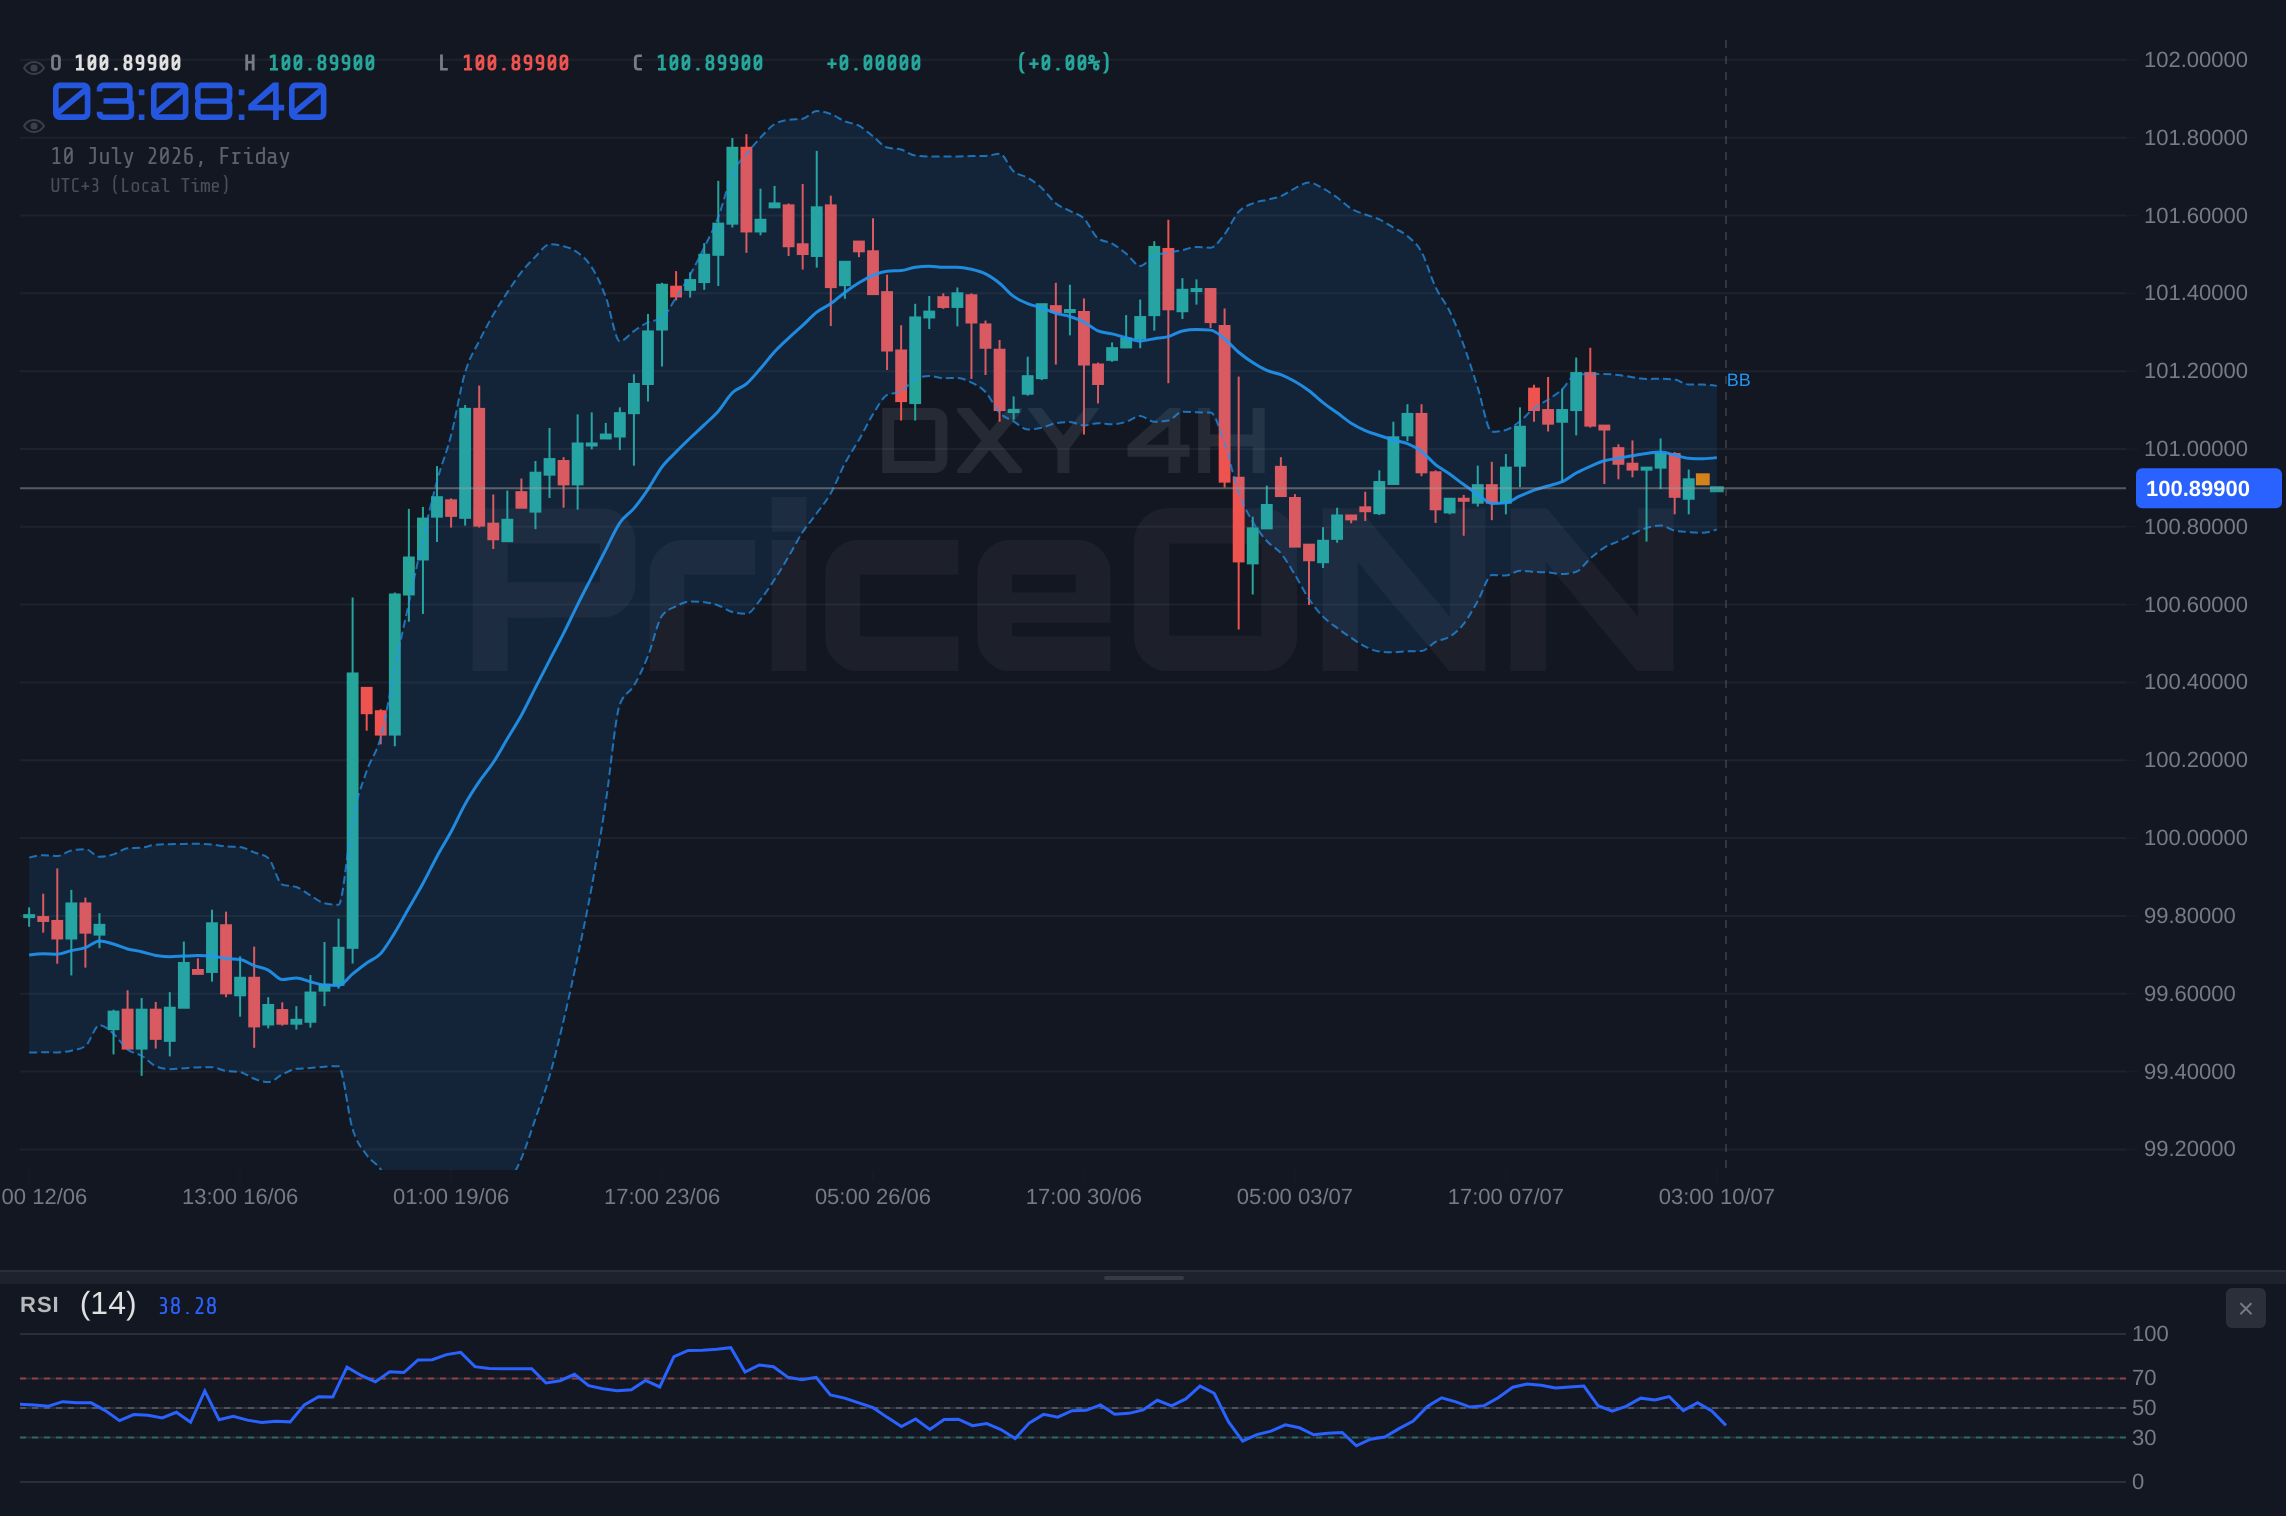
When we zoom out to the daily chart, the picture becomes even more compelling for dollar bears. The RSI is at 57.77, a level that, while still technically in neutral territory, is pushing higher and suggests growing bullish conviction on this longer timeframe. However, the MACD is firmly in negative territory, with its histogram below the signal line, indicating sustained bearish momentum. The Bollinger Bands are trading above the middle band, which on a daily chart can signal a shift towards a bullish trend or a strong upward move. The Stochastic Oscillator, with %K at 42.55 and %D at 36.67, shows a bullish crossover (%K above %D), reinforcing the potential for upward movement. Yet, the ADX stands out at 35.14, indicating a strong trend is in play. The confluence of these indicators, particularly the strong ADX and the bullish Stochastic crossover, suggests that while bearish sentiment may have dominated recently, there's a growing possibility of a reversal or a significant upward correction. The 'General Signal' of AL (6 buy, 2 sell, 0 neutral) on the daily timeframe strongly suggests that longer-term traders are beginning to favor the dollar, potentially anticipating a shift in monetary policy or a broader market move.
Key Levels and Price Action: The $100.92 Battleground
The immediate battleground for the DXY is clearly defined by the current price action around $100.92. On the 1-hour chart, the first line of defense for the dollar bulls lies at $100.89, followed by $100.85 and then the more significant support at $100.82. A decisive break below $100.82 on this short timeframe could trigger further selling pressure, attracting more bears into the market and potentially accelerating the move lower. Conversely, for the dollar to regain its footing, it needs to reclaim the immediate resistance at $100.96. Should it manage to push above this level, the next targets would be $100.99 and then the crucial $101.03. Holding above $101.03 could signal a more sustained recovery, invalidating the short-term bearish bias. The market sentiment here is clearly divided, with the conflicting Stochastic and MACD signals on the 1H chart reflecting this indecision.
Looking at the 4-hour chart, the support structure becomes more robust, but also more challenging to defend if the selling pressure intensifies. The primary support is found at $100.81, a level that has likely been tested. Below this, we have $100.74 and then $100.65. A sustained move below $100.65 on this timeframe would signal a significant bearish breakdown, potentially opening the door for a much deeper correction. The resistance levels on the 4-hour chart are equally important. The first hurdle is at $100.97, followed by $101.06, and then a more significant resistance at $101.13. Breaking decisively above $101.13 would be a strong bullish signal, suggesting that the dollar is entering a new phase of strength. The fact that the ADX is relatively low on this timeframe (18.37) indicates a lack of strong directional conviction, meaning that price action around these levels could be choppy until a clear catalyst emerges.
The daily timeframe provides a broader context for these intraday and intra-week struggles. The support levels here are considerably lower, starting at $100.89, followed by $100.72, and then $100.54. A fall to these levels would represent a significant downturn for the dollar. The resistance levels on the daily chart are also critical: $101.24, $101.42, and $101.59. A sustained push above $101.59 would signal a strong bullish reversal, potentially nullifying the bearish signals observed on shorter timeframes. The high ADX value of 37.58 on the daily chart is particularly noteworthy. It indicates a strong trend is in force, and given the prevailing signals from other indicators like the Stochastic and the Bollinger Bands, this strong trend could be interpreted as a powerful bearish trend that is currently experiencing a pullback, or conversely, a strong bullish trend that is consolidating before its next leg up. The market is essentially at a crossroads, and the resolution will likely be dictated by incoming economic data and central bank commentary.
Fundamental Crosscurrents: What's Driving the DXY?
The recent news flow offers crucial insights into the fundamental drivers behind the DXY's current positioning. A headline noting the "United States Dollar Index falls as Middle East calm cools inflation fears" directly links the dollar's recent weakness to a decline in geopolitical tensions and, consequently, a moderation of inflation expectations. This is a significant development. When geopolitical risks escalate, safe-haven assets like the dollar tend to strengthen as investors seek perceived stability. Conversely, a calming geopolitical environment, particularly in sensitive regions like the Middle East, can reduce demand for safe havens and allow riskier assets to flourish. This shift in sentiment can directly impact central bank policy expectations. If inflation fears cool, the Federal Reserve might feel less pressure to maintain an aggressive hawkish stance, potentially leading to a pause or even a pivot in monetary policy sooner than anticipated. This expectation alone can weigh on the dollar.
Furthermore, the interplay between the DXY and other major markets provides a vital layer of analysis. The strength in gold prices, trading near $4,110, and the recovery in silver (XAGUSD) around $59.99, are often inversely correlated with a strong dollar. While gold has seen some bearish trend lines forming, its recent recovery from lower levels suggests that investors are seeking alternative stores of value, perhaps anticipating a weaker dollar or hedging against potential economic uncertainties. The rise in oil prices, though currently facing headwinds, also plays a role. Brent crude is trading around $75.99 and WTI at $72.06. Higher oil prices can contribute to inflationary pressures, which, in turn, could influence Federal Reserve policy. However, the recent price action in oil suggests that current demand concerns or supply dynamics might be outweighing inflation fears for now. The performance of equity indices like the S&P 500 (6572.87) and Nasdaq (29697.06), which are showing resilience and even gains, also suggests a degree of risk appetite in the market, which typically does not favor a strong dollar as a primary safe-haven asset.
Central bank policy remains the ultimate arbiter of the dollar's fate. While the immediate narrative might be influenced by cooling inflation fears and geopolitical calm, the Federal Reserve's stance on interest rates is the dominant factor. Market participants are constantly digesting incoming economic data, such as employment figures and inflation reports, to gauge the Fed's next move. If recent data suggests persistent inflation or a robust labor market, the Fed could be compelled to maintain a hawkish tone, which would typically support the DXY. Conversely, any hint of economic slowdown or a more rapid-than-expected decline in inflation could lead to expectations of rate cuts, putting downward pressure on the dollar. The upcoming FOMC minutes, mentioned in recent market commentary regarding gold's recovery, will be a key event to watch for any clues about the Fed's internal deliberations and future policy direction. The market's interpretation of these minutes will be crucial in shaping the DXY's trajectory in the coming weeks.
The DXY's current price around $100.92 is a critical inflection point. Conflicting signals across different timeframes and indicators suggest a high probability of increased volatility. Traders should exercise caution and await clearer directional cues from upcoming economic data releases and central bank communications.
Strategic Considerations and Forward Outlook
For traders and investors, the current technical and fundamental landscape presents a complex, yet potentially rewarding, environment. The DXY's inability to decisively break higher and its current testing of support levels around $100.92 indicate a market grappling with competing narratives. On one hand, cooling inflation fears and a potential shift in Fed expectations could weigh on the dollar. On the other hand, the dollar's status as a safe-haven asset means that any resurgence in geopolitical tensions or a significant downturn in global risk appetite could quickly reverse the current trend and send the DXY higher. The strength of the dollar on the daily chart (ADX 35.14) cannot be ignored, suggesting that underlying bullish forces might still be present, even if temporarily overshadowed by short-term bearish pressures.
The upcoming economic calendar will be crucial in providing the clarity needed to navigate these choppy waters. Key data releases, such as inflation reports, employment figures, and manufacturing indices, will offer a clearer picture of the US economic health and, by extension, the Federal Reserve's likely policy path. Any deviation from expectations in these reports could trigger significant price movements in the DXY. For instance, a surprisingly strong jobs report might reignite hawkish Fed expectations, supporting the dollar, while a weaker-than-expected inflation print could fuel rate cut speculation, pressuring the dollar further. The market's reaction to these data points will be key, as it will reveal whether the current price action is a mere pullback within a larger bullish trend or the beginning of a more significant bearish reversal.
The correlation analysis also offers valuable insights. With the DXY currently at $100.92, its interaction with other major currency pairs like EURUSD (1.14338) and GBPUSD (1.34128) will be closely watched. Typically, a weaker dollar supports these pairs, while a stronger dollar tends to weigh them down. Similarly, the relationship between the DXY and gold (XAUUSD at 4124.8) is often inverse. If the dollar weakness persists, it could provide further tailwinds for gold, especially if safe-haven demand remains elevated due to underlying global uncertainties. Conversely, any significant dollar recovery could put pressure on gold prices. Understanding these intermarket dynamics is essential for a comprehensive trading strategy, as movements in one market often have predictable consequences in others.
Bearish Scenario: Dollar Under Pressure
65% ProbabilityConsolidation Scenario: Choppy Markets Ahead
25% ProbabilityBullish Scenario: Dollar Rebounds
10% ProbabilityFrequently Asked Questions: DXY Analysis
What happens if the DXY breaks below the $100.82 support level?
A break below $100.82 on the 4-hour chart would invalidate the short-term bullish signals and likely trigger further selling pressure, targeting the next major support at $100.72. This scenario gains probability if upcoming economic data disappoints or Fed rhetoric turns dovish.
Should I trade DXY at current levels of $100.92 given the mixed signals?
Given the conflicting signals across timeframes and the critical support being tested, entering at current levels carries significant risk. A high-probability setup would require a clear break above $101.13 resistance or a decisive fall below $100.82 support.
Is the RSI at 48.26 a sell signal for DXY right now?
An RSI of 48.26 on the 1-hour chart is in neutral territory but leans bearish. It does not constitute a standalone sell signal but indicates that momentum is not strongly bullish and that a reversal could occur if other bearish factors align, such as a break of key support levels.
How will upcoming Fed rate expectations affect DXY this week?
Stronger-than-expected inflation or employment data could increase expectations of a hawkish Fed, potentially pushing the DXY above $101.13. Conversely, softer data might fuel rate cut speculation, increasing the probability of a move towards $100.72.
The DXY's current positioning around $100.92 is a critical moment, demanding careful observation and strategic patience. While short-term indicators show some bearish leanings and conflicting signals, the longer-term daily chart still holds potential for a bullish reversal, especially with a strong ADX trend in place. The interplay of cooling inflation fears, potential shifts in Fed policy expectations, and ongoing geopolitical developments will ultimately determine whether the dollar finds solid ground at current support or succumbs to bearish pressures. As always, disciplined risk management and adherence to data-driven analysis will be the keys to navigating this complex market landscape. The market always presents opportunities; the wisdom lies in waiting for the right setup.
| Indicator | Value | Signal | Interpretation |
|---|---|---|---|
| RSI (14) | 48.26 | Neutral | Leaning bearish on 1H, bearish on 4H, bullish momentum on 1D. |
| MACD | Positive | Bullish | Mixed signals across timeframes, bearish momentum on 4H. |
| Stochastic | K=42.55, D=36.67 | Bullish | Bullish crossover on 1D, bearish on 1H & 4H. |
| ADX | 35.14 | Strong Trend | Indicates a strong trend on daily, weak on shorter timeframes. |
| Bollinger Bands | Middle Band | Watch | Below middle band on 1H/4H, above on 1D. |
Track markets in real-time
AI-powered analysis, technical indicators and real-time price data.
Join Our Telegram Channel
Breaking market news, AI analysis and trading signals instantly.
Join Channel