

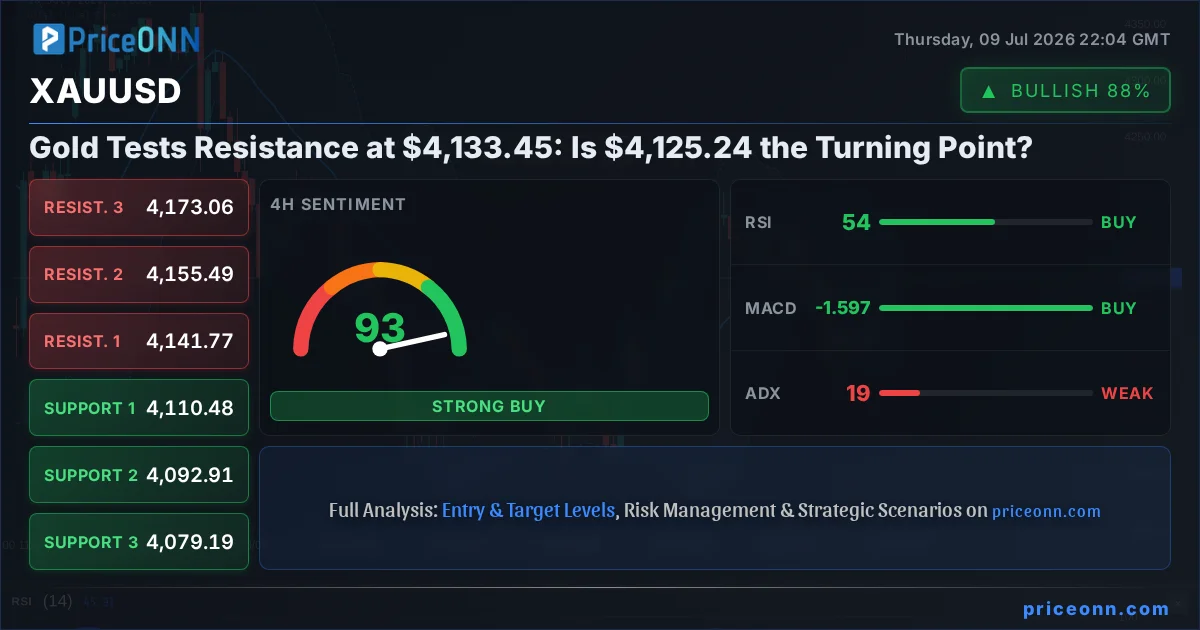
Is the current upward momentum in gold sustainable, or are we on the verge of a significant pullback? Gold prices are currently testing a critical resistance level around $4,133.45, with the precious metal trading at $4,125.24 as of the latest data. This juncture is pivotal, representing a battleground where bullish aspirations meet bearish pressures, and understanding the underlying drivers is paramount for any trader navigating this volatile market. The narrative surrounding gold is complex, weaving together inflation expectations, central bank policies, geopolitical tensions, and the overarching sentiment in broader financial markets. As we dissect the current price action, it's clear that multiple factors are at play, making the $4,133.45 level a key inflection point to watch.
- RSI at 60.84 on the 1-hour chart signals a neutral-to-bullish inclination, but caution is advised as it approaches overbought territory.
- Critical resistance sits at $4,133.45, a level that XAUUSD is currently testing and must convincingly break to sustain its upward trend.
- The ADX at 23.36 on the 1-hour chart indicates a moderately strong uptrend, but its lower value on the 4-hour (18.99) and daily (37.58) charts suggests waning trend strength in longer timeframes.
- The DXY at 100.95 is currently declining, which typically provides support for gold prices, but its own mixed signals warrant close observation.
- Upcoming economic data releases, particularly from the US, will be crucial in determining the next directional move for gold.
The Bull Case: Why Gold Could Push Higher
The current price action for XAUUSD paints a picture of resilience, with the metal trading at $4,125.24 and showing a clear upward trajectory on the shorter timeframes. The 1-hour chart, in particular, displays a bullish trend with a Power Strength of 87%, supported by a General Signal leaning towards 'BUY' (7 Buy, 1 Sell). Indicators like the RSI(14) at 60.84, while in neutral territory, are trending upwards, suggesting that buyers are still in the game. The MACD is also showing positive momentum, with the MACD line above the signal line, reinforcing the bullish sentiment on this timeframe. Furthermore, the price is trading above the middle Bollinger Band, indicating an upward bias. The Stochastic Oscillator, although showing a potential dip with %K below %D, remains in a range that doesn't scream immediate reversal. The ADX at 23.36 on the 1-hour chart points to a moderately strong trend, which bulls would aim to leverage.
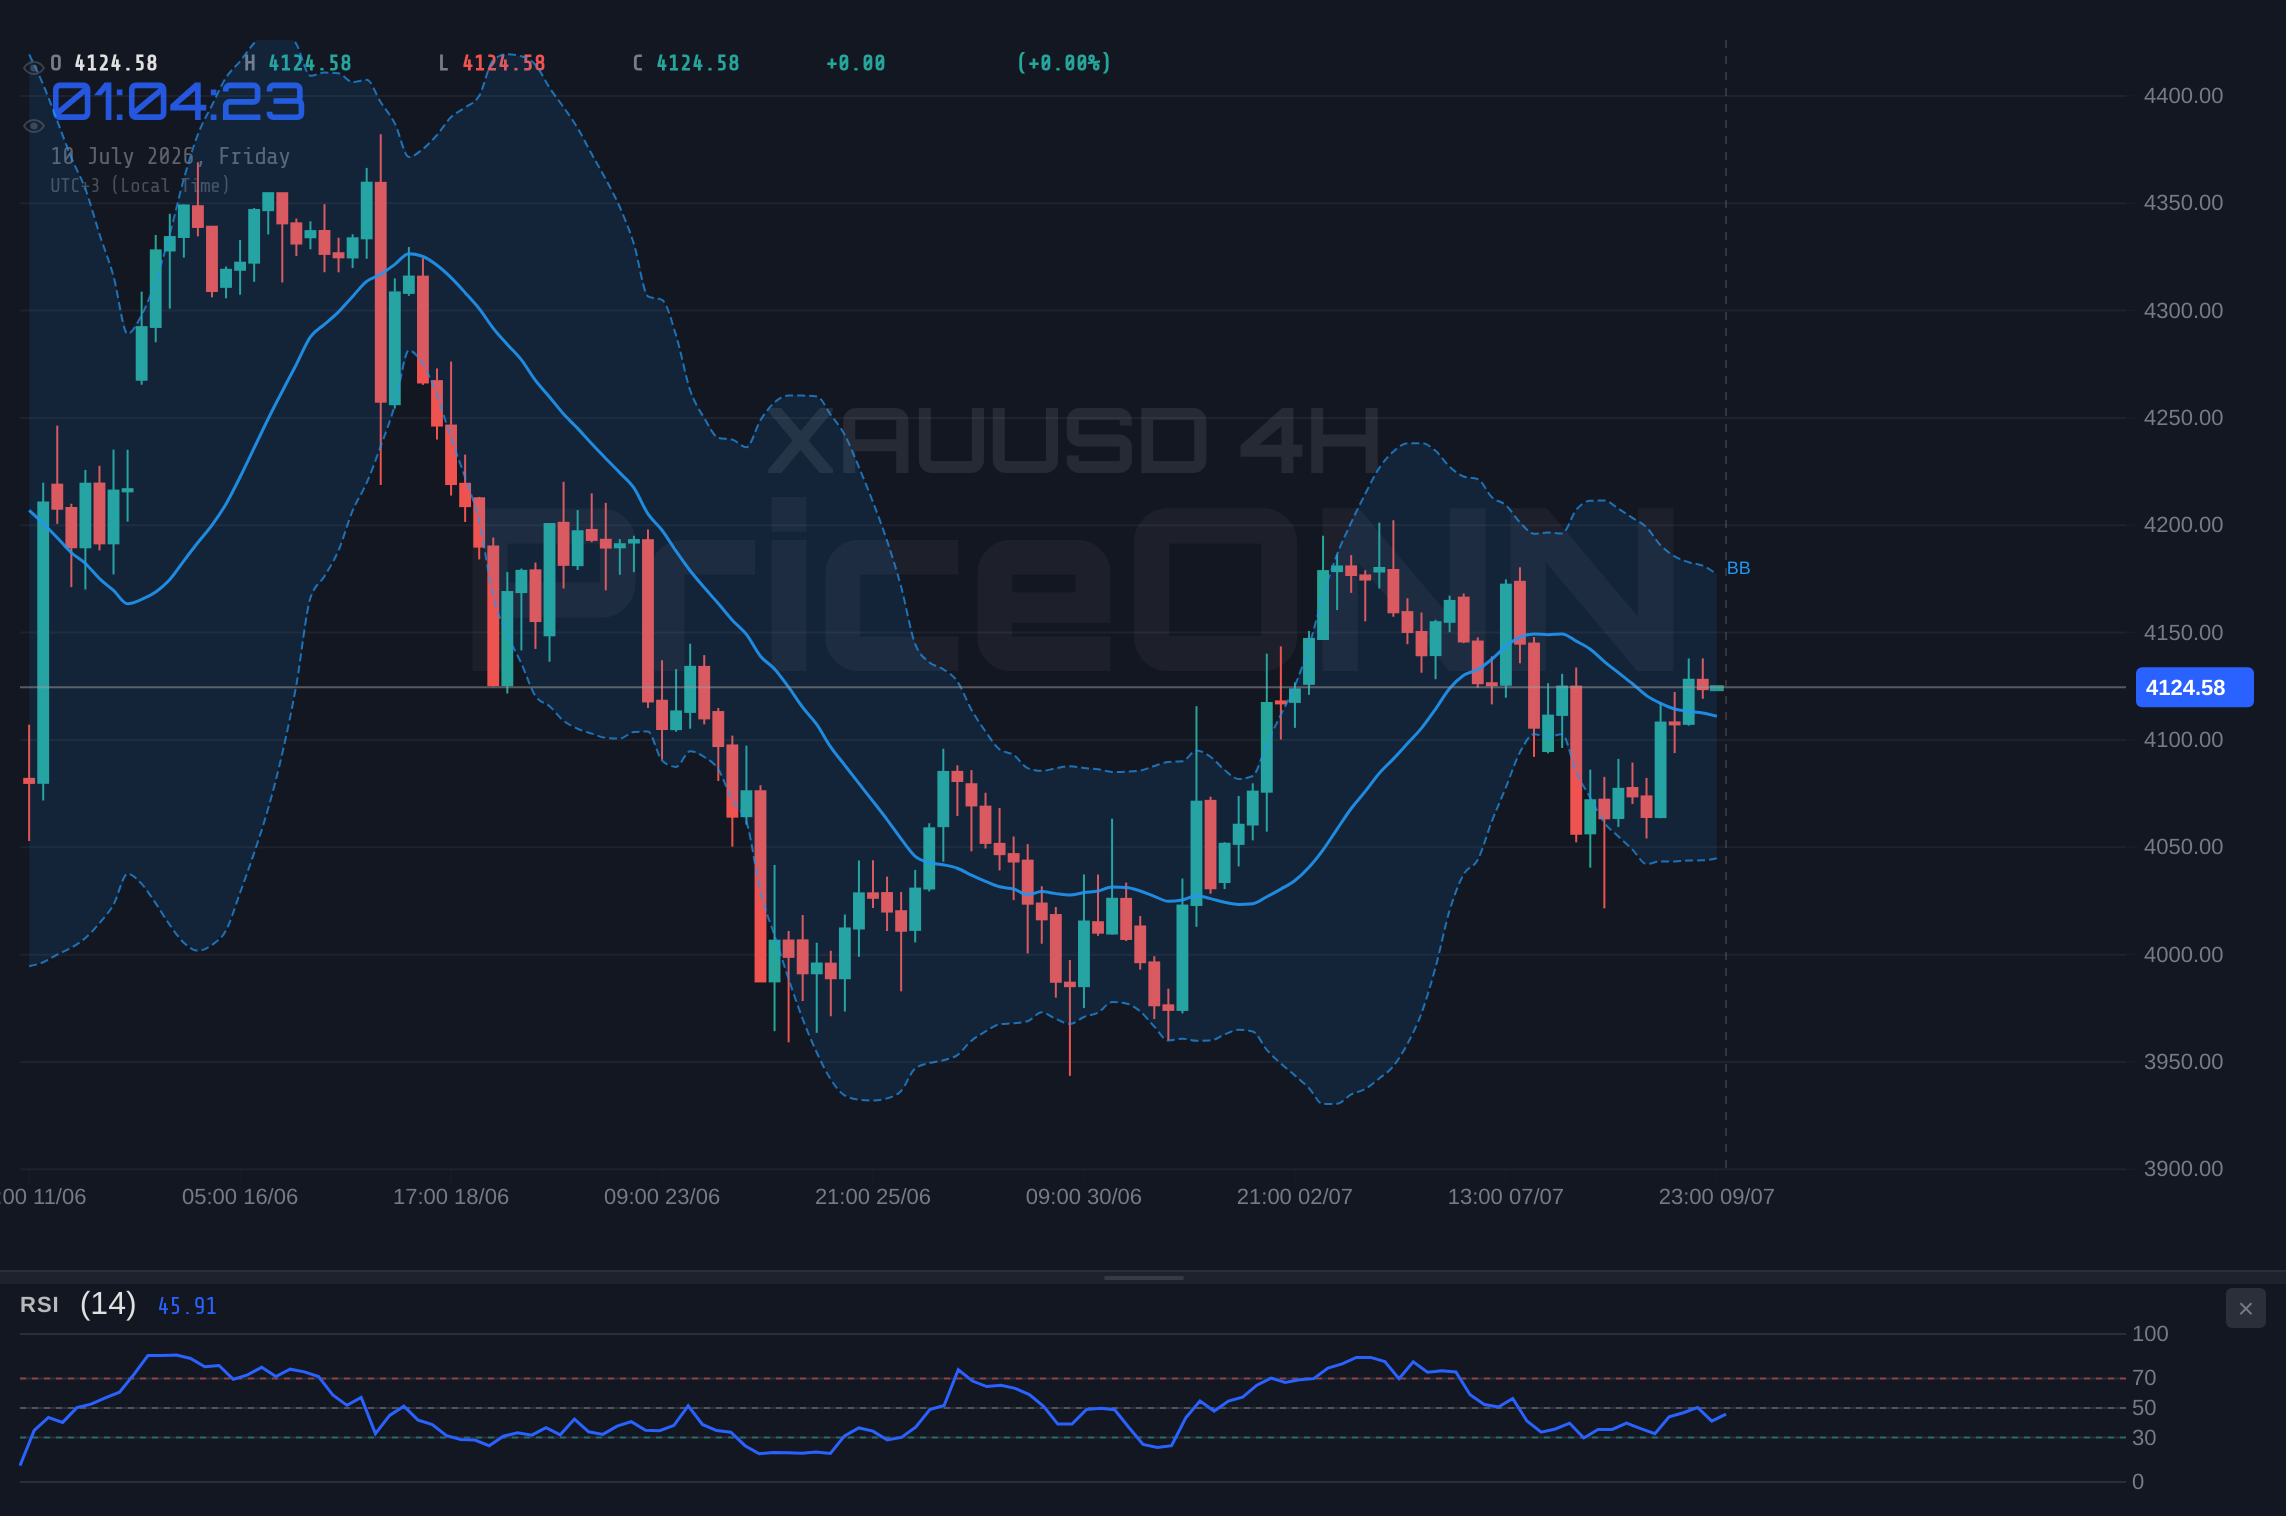
On the 4-hour timeframe, the trend remains bullish with a Power Strength of 84%. The RSI(14) at 54.13 is comfortably in the neutral zone, trending upwards, and the MACD continues to signal positive momentum. The Stochastic Oscillator here is more decisively bullish, with %K (85.73) significantly above %D (57.19), indicating strong buying pressure. While the ADX at 18.99 suggests a weaker trend on this timeframe, the confluence of other indicators still leans towards a continuation of the upside. This shorter-to-medium term strength provides a foundation for the argument that gold is poised to challenge higher resistance levels. The broader context of a declining DXY, currently at 100.95, also lends support to gold's upward move, as a weaker dollar typically translates to higher gold prices due to its inverse correlation.
From a fundamental perspective, several factors could be underpinning gold's strength. Geopolitical tensions, while perhaps easing slightly in some regions, remain a persistent undercurrent in global markets. News reports mentioning "Middle East calm cooling inflation fears" suggest a potential easing of one risk premium, but the overall geopolitical landscape remains fluid. Central bank policies also play a crucial role. If central banks are perceived to be nearing the end of their tightening cycles or contemplating rate cuts, this can reduce the opportunity cost of holding non-yielding assets like gold, making it more attractive. While specific central bank announcements are not detailed in the provided data, the general market sentiment often anticipates such policy shifts. Furthermore, ongoing inflation concerns, even if temporarily cooled, continue to position gold as a potential hedge against currency debasement and rising prices, especially if economic data points to persistent inflationary pressures in the future.
The Bear Case: Why Resistance Might Hold
Despite the shorter-term bullish signals, the longer-term picture for gold presents a more cautious outlook, forming the basis of the bear case. The daily timeframe paints a starkly different picture: the trend is neutral with only 50% strength, and the General Signal is leaning towards 'SELL' (2 Buy, 6 Sell). The RSI(14) at 44.82 is in the neutral zone but trending downwards, indicating weakening buying interest. More concerning for bulls, the MACD is showing positive momentum, but the Bollinger Bands are positioned below the middle band, suggesting a bearish bias on this longer timeframe. The Stochastic Oscillator here is also showing a bearish signal, with %K (61.51) below %D (64.74), indicating a potential downturn. Crucially, the ADX on the daily chart stands at a robust 37.58, signifying a strong trend, but this trend is currently identified as a 'downward' one, suggesting that any upward moves might be short-lived corrections within a larger downtrend.
The immediate resistance level at $4,133.45 is a significant hurdle. The data shows resistance levels at $4,126.66, $4,130.70, and $4,134.45 on the 1-hour chart. While $4,133.45 is within the immediate resistance zone, breaking convincingly above $4,134.45 would be a stronger signal. However, the daily resistance is listed at $4,133.45, $4,189.67, and $4,245.61. This means that the current price is right at the doorstep of the first major daily resistance. If gold fails to break through $4,133.45 and subsequently closes below the $4,118.87 support on the 1-hour chart, it could signal a reversal. The contradiction between the bullish signals on shorter timeframes and the bearish undertones on the daily chart creates a complex trading environment, where a failure to overcome immediate resistance could lead to a swift decline.
From a fundamental perspective, the cooling of inflation fears, as suggested by the falling US Dollar Index (DXY) and potentially calmer Middle East news, could reduce the demand for gold as a safe-haven asset and inflation hedge. If economic data, particularly upcoming US releases, indicates a stronger economy or persistent disinflation, it could bolster the case for the Federal Reserve to maintain a hawkish stance or delay rate cuts. This would increase the opportunity cost of holding gold and strengthen the dollar, both of which are bearish for the precious metal. The news that "Brent Above $80" might be a trigger for gold and silver bears suggests that a potential shift in energy markets could also influence commodity prices. While Brent is currently trading at $75.97, a sustained rise could reignite inflation fears, but a failure to break higher might signal a peak in risk premiums.
The conflicting signals from various indicators also fuel the bear case. For instance, on the 1-hour chart, while RSI is neutral-to-bullish, the Stochastic Oscillator shows %K
Weighing the Evidence: Technicals and Fundamentals
The battle between bulls and bears for control of XAUUSD is clearly depicted in the conflicting signals across different timeframes. The 1-hour and 4-hour charts present a generally bullish picture, driven by positive momentum and upward-trending indicators. However, the daily chart introduces a significant dose of caution. The RSI at 44.82 on the daily chart suggests room for further downside, and the ADX at 37.58, while indicating a strong trend, is aligned with a downward movement. This divergence is critical; it suggests that the current upward push might be a retracement rather than the start of a new sustained rally. The fact that the price is currently testing the $4,133.45 daily resistance level makes this tug-of-war even more pronounced. A failure to decisively break and hold above this level could trigger significant selling pressure, especially if it coincides with positive economic news from the US or a strengthening dollar.
Correlations with other markets provide further context. The DXY is currently showing a slight downward bias at 100.95. Historically, a weaker dollar tends to support gold prices. However, the DXY itself presents mixed signals across timeframes, with its daily chart showing a bullish signal despite its current dip. This suggests that the dollar's weakness might be temporary, and any resurgence could put pressure back on gold. Equity markets, like the S&P 500 (currently at 6572.87, showing a strong daily uptrend) and Nasdaq (29731.31, also in a strong uptrend), typically move inversely to gold when risk appetite is high. If these indices were to falter, it could increase demand for gold as a safe haven. However, their current strength suggests that risk sentiment is relatively robust, which might limit gold's appeal as a primary safe-haven asset at this moment.
The role of upcoming economic data cannot be overstated. While the provided news mentions "cooling inflation fears," the market remains sensitive to any indication of persistent inflation or hawkish central bank commentary. Upcoming releases such as Non-Farm Payrolls (NFP) or Consumer Price Index (CPI) data could significantly shift the narrative. If these reports indicate stronger-than-expected inflation, it could reignite safe-haven demand for gold. Conversely, data suggesting a cooling economy or disinflation could lead to a Fed pivot narrative, which might initially benefit gold but could also lead to dollar strength if it implies a more prolonged period of low rates. The Brent crude oil price, currently at $75.97 and showing a sharp daily decline, is also a factor. A sustained drop in oil prices can ease inflation concerns, but a rebound could signal renewed inflationary pressures, potentially boosting gold. The market is essentially waiting for a clearer signal from macro data and central bank communications to break this current deadlock.
The immediate technical levels are crucial. On the 1-hour chart, support is found at $4,118.87, $4,115.12, and $4,111.08. A break below $4,111.08 would be a strong bearish signal on this timeframe. Resistance is at $4,126.66, $4,130.70, and $4,134.45. The daily chart shows support at $4,021.29 and resistance at $4,133.45. The proximity of the current price to the $4,133.45 resistance level means that any move above it would be significant, but a failure to break it could lead to a rapid decline towards the daily support levels. The conflicting signals across timeframes suggest a market that is hesitant, waiting for a catalyst to break the current stalemate. The strength of the daily ADX (37.58) in signaling a downward trend is a significant factor that bulls must overcome.
The Verdict: A Cautious Approach at Resistance
Given the conflicting signals across timeframes and the critical resistance level being tested, a cautious approach is warranted for XAUUSD at $4,125.24. While shorter-term charts show bullish momentum, the longer-term daily timeframe presents a bearish bias with a strong downward trend indicated by the ADX at 37.58. The immediate resistance at $4,133.45 is a formidable barrier, and a failure to break it convincingly could see prices retreat significantly, potentially targeting the $4,111.08 support on the 1-hour chart or even lower daily support levels. The market sentiment appears to be at a crossroads, awaiting definitive fundamental catalysts to break the current indecision. The interplay between inflation data, central bank policy expectations, and geopolitical developments will be key in determining whether gold can push higher or if the bears will regain control.
The current technical setup, with strong daily downtrend signals (ADX 37.58) contradicting shorter-term bullish momentum, suggests that any upside breakout above $4,133.45 needs to be robust and sustained. Until then, the risk of a pullback remains elevated. Traders should pay close attention to the price action around $4,133.45 and the immediate support levels. A clear break above resistance, confirmed by multiple indicators and fundamental tailwinds, could signal a new upward leg. Conversely, a decisive break below key short-term supports might confirm the bearish outlook suggested by the daily chart. Patience and disciplined risk management are crucial as the market navigates this critical juncture.
Bearish Scenario: Resistance Holds Firm
65% ProbabilityConsolidation Scenario: Range-Bound Trading
25% ProbabilityBullish Scenario: Resistance Breakout
10% ProbabilityFrequently Asked Questions: XAUUSD Analysis
What happens if XAUUSD fails to break above the $4,133.45 resistance level?
If XAUUSD fails to decisively break above $4,133.45, the bearish signals from the daily chart, particularly the strong ADX at 37.58, could dominate. This could lead to a pullback towards the $4,118.87 support on the 1-hour chart, potentially extending lower if the selling pressure intensifies.
Should I buy XAUUSD at current levels around $4,125.24 given the mixed signals?
Buying at current levels requires caution due to the critical resistance at $4,133.45 and conflicting signals across timeframes. A high-probability setup would involve waiting for a confirmed breakout above resistance or a clear rejection and pullback to support levels, aligning with the dominant trend on the daily chart.
Is the RSI at 60.84 on the 1-hour chart a sell signal for XAUUSD?
An RSI of 60.84 on the 1-hour chart is generally considered neutral-to-bullish, indicating upward momentum but not yet extreme overbought conditions. However, when viewed alongside the bearish divergence on the daily chart and the proximity to resistance, it warrants close monitoring rather than being an immediate sell signal.
How will upcoming US economic data affect XAUUSD this week, given current inflation fears?
Upcoming US data, such as NFP or CPI, will be crucial. Stronger-than-expected inflation figures could boost XAUUSD by increasing safe-haven demand and potential Fed dovishness, while disinflationary data might strengthen the dollar and pressure gold prices. The market's reaction will depend on how the data influences Fed rate hike expectations.
Technical Outlook Summary
| Indicator | Value | Signal | Interpretation |
|---|---|---|---|
| RSI (14) | 60.84 | Neutral | Approaching overbought on 1H, but trending up. Daily RSI at 44.82. |
| MACD | Positive | Bullish | Positive momentum on 1H/4H, but daily MACD shows mixed signals. |
| Stochastic | K=64.28, D=78.26 | Bearish Crossover (1H) | 1H shows crossover, but 4H is bullish. Daily is also bearish crossover. |
| ADX | 23.36 | Moderate Trend | Strong trend on Daily (37.58) but bearish. 1H shows moderate uptrend. |
| Bollinger | Upper Band | Watch | Price is above middle band on 1H/4H, below on Daily. |
Key Levels
Track markets in real-time
AI-powered analysis, technical indicators and real-time price data.
Join Our Telegram Channel
Breaking market news, AI analysis and trading signals instantly.
Join Channel