

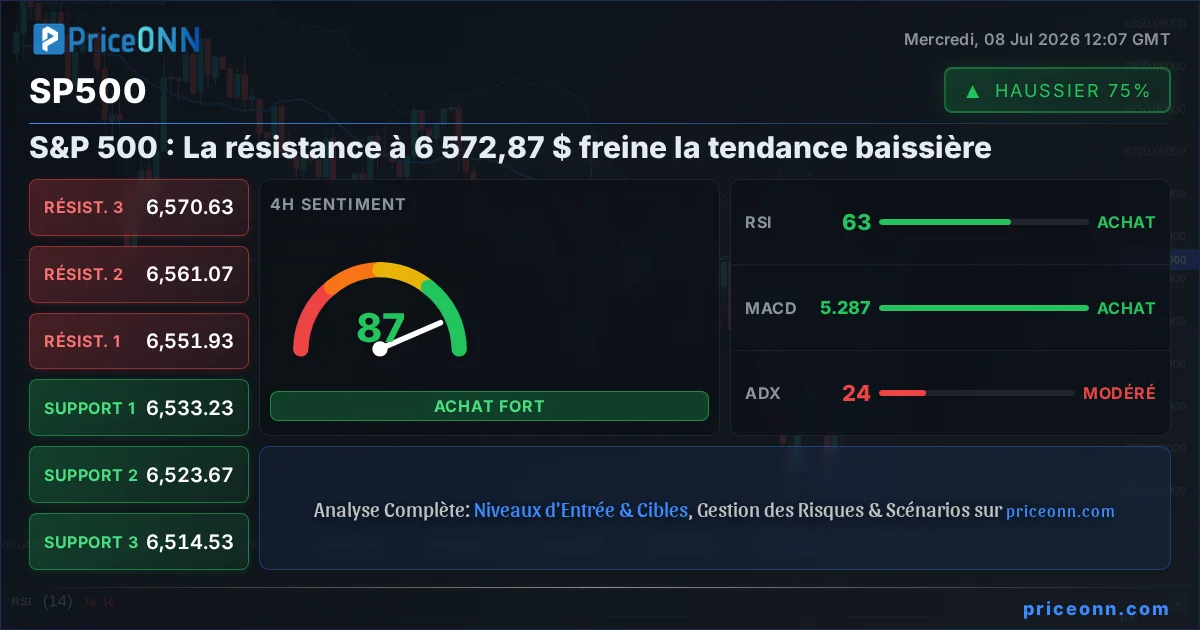
L'indice S&P 500 navigue actuellement un point critique, évoluant à 6 572,87 $ alors qu'une tendance baissière prononcée continue de dicter le sentiment du marché. Ce niveau représente une zone de résistance significative, un point où l'action des prix précédente a stagné et s'est inversée, suggérant que la voie de moindre résistance pourrait toujours être à la baisse. Investisseurs et traders examinent attentivement ce point de prix, conscients qu'un échec à le franchir de manière décisive pourrait encourager les vendeurs et prolonger la récente glissade. Le contexte macroéconomique prédominant, associé à une position prudente des banques centrales, continue de jeter une ombre sur les actifs à risque, faisant du prochain mouvement du S&P 500 un point de mire pour les acteurs du marché.
- Le S&P 500 évolue actuellement à 6 572,87 $, rencontrant une résistance à ce niveau clé.
- Le RSI à 45,35 sur le graphique journalier indique une inclinaison baissière, avec encore de la marge avant d'atteindre la zone de survente.
- L'ADX à 47,51 sur l'unité de temps journalière confirme une forte tendance baissière existante.
- L'analyse de corrélation montre que le DXY à 101,16 se renforce, exerçant potentiellement une pression sur les actions américaines.
Le paysage technique du S&P 500, observé sur plusieurs unités de temps, dépeint un marché sous pression. Sur le graphique horaire, la tendance est résolument haussière avec une force de 100 %, mais c'est souvent le signe d'un rebond à court terme au sein d'une tendance baissière plus large plutôt qu'un véritable renversement. L'indice rencontre une résistance immédiate à 6 568,73 $, avec d'autres obstacles importants à 6 577,27 $ et 6 589,83 $. Bien que l'Oscillateur Stochastique montre un signal haussier potentiel avec %K (65,73) au-dessus de %D (73,5), il s'agit d'un signal trompeur car %K est en fait en baisse par rapport à %D, suggérant un affaiblissement de la dynamique haussière. Plus important encore, l'ADX à 49,72 sur cette unité de temps signifie une tendance très forte, et compte tenu de la tendance baissière globale, cette force soutient probablement la continuation du mouvement baissier existant plutôt qu'une nouvelle phase haussière. Le RSI, bien que n'étant pas encore en territoire de surachat à 70,95, s'en approche, laissant entendre que toute nouvelle poussée haussière pourrait être accueillie par des prises de bénéfices.
L'examen de l'unité de temps de 4 heures offre une perspective plus large, révélant une tendance neutre avec une force de 50 %. Cela suggère une période de consolidation ou d'indécision, mais ne nie pas l'influence de la tendance journalière plus large. Les niveaux de résistance sont marqués à 6 551,93 $, 6 561,07 $ et 6 570,63 $. Le MACD montre actuellement une dynamique positive, avec la ligne MACD au-dessus de sa ligne de signal, mais cela doit être vu dans le contexte de l'environnement baissier général. L'Oscillateur Stochastique est en territoire de surachat extrême avec %K à 97,85 et %D à 86,96, une condition qui précède souvent un repli ou un renversement. Cette condition de surachat, associée à une lecture ADX journalière de 47,51 (indiquant une forte tendance baissière), renforce les perspectives baissières. Bien que le graphique de 4 heures puisse montrer de brèves périodes de force, la pression baissière sous-jacente reste dominante.
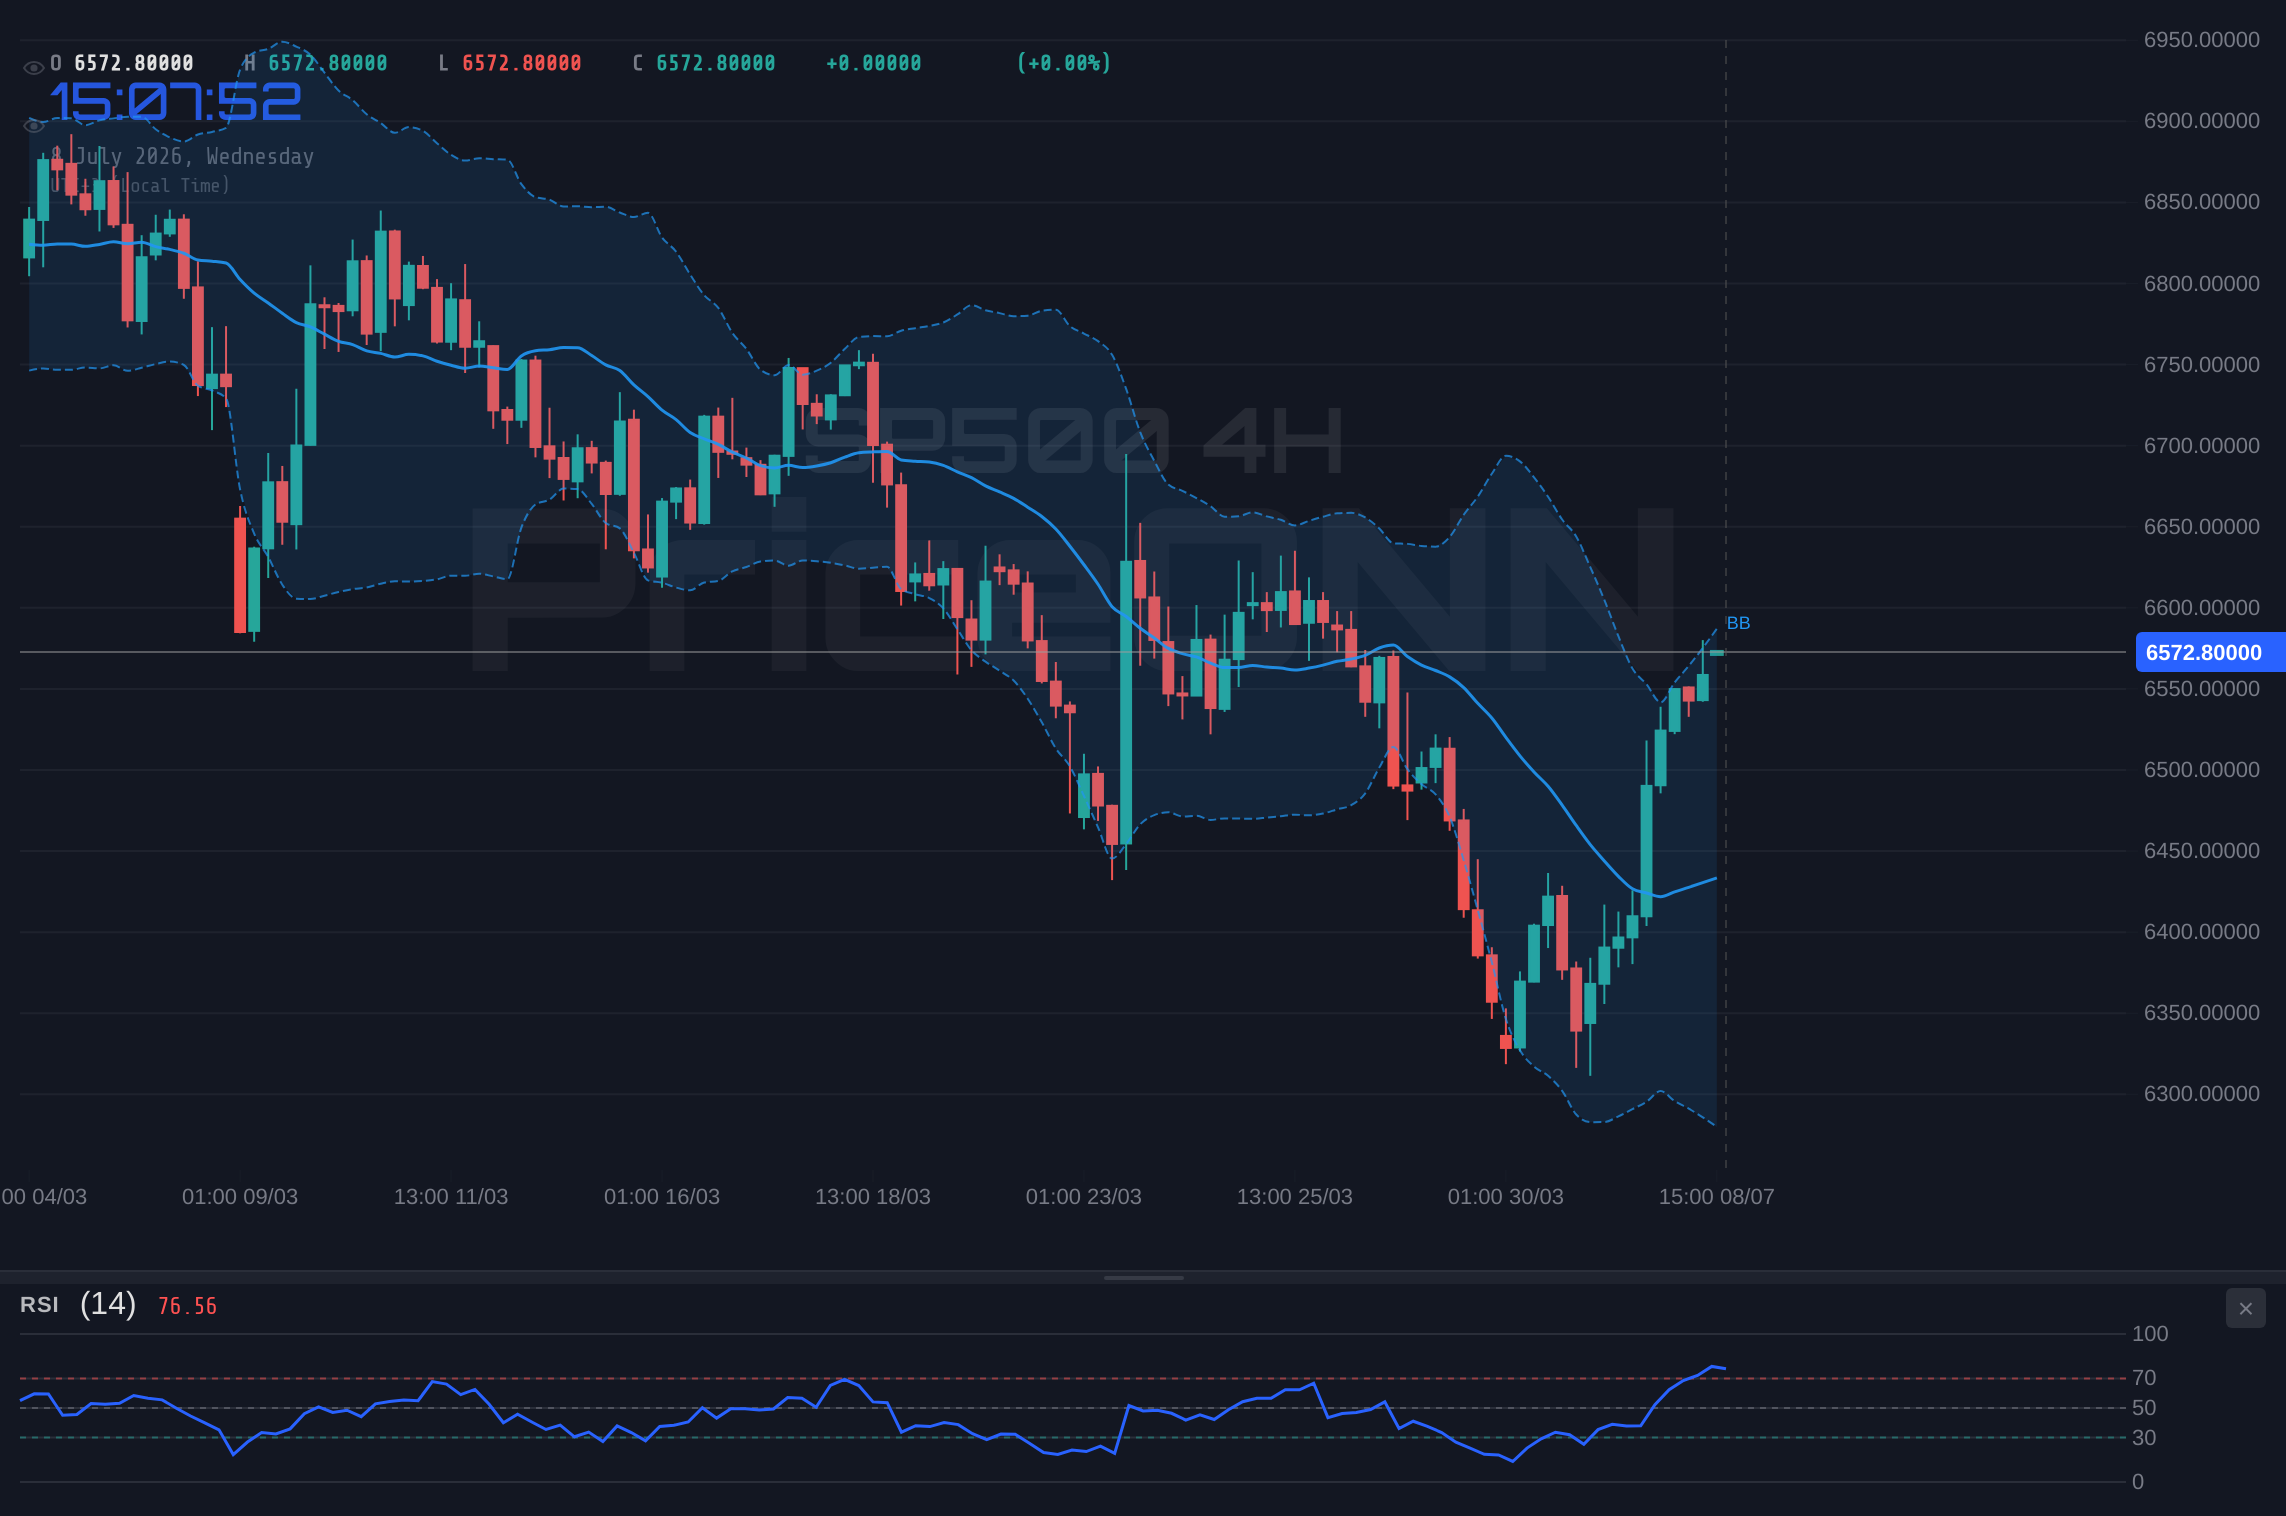
Le graphique journalier fournit le contexte le plus crucial pour la situation actuelle du S&P 500. Ici, la tendance est clairement baissière, avec une force de 100 %. L'indice se négocie en dessous de sa moyenne mobile sur 200 jours, un signal baissier classique qui indique souvent un changement de sentiment du marché vers l'aversion au risque. Les niveaux de support clés sont identifiés à 6 377,47 $, 6 230,63 $ et 6 149,87 $. Ce sont les niveaux que les haussiers doivent défendre pour même envisager un processus de creux potentiel. Du côté de la résistance, le niveau de 6 605,07 $, juste au-dessus du prix actuel, est le premier obstacle majeur. Une cassure décisive et un mouvement soutenu au-dessus de ce niveau seraient nécessaires pour contester le récit baissier. Cependant, avec le RSI à 45,35, il suggère qu'il y a encore une marge de manœuvre considérable pour que le prix baisse avant d'entrer en territoire de survente, validant davantage le biais baissier. Le MACD, tout en montrant une dynamique négative, se situe près de sa ligne de signal, indiquant un potentiel de consolidation ou un léger rebond, mais pas un renversement haussier soutenu sans confirmation supplémentaire.
La force de la tendance baissière est indéniable, comme en témoigne l'indicateur ADX. Sur le graphique journalier, l'ADX se situe à un solide 47,51, signifiant une tendance puissante et établie. Ce n'est pas un marché caractérisé par des mouvements latéraux ; c'est un marché en tendance, et actuellement, la tendance est à la baisse. Cette lecture ADX élevée implique que tout rebond contre-tendance est susceptible d'être de courte durée et de rencontrer une pression de vente significative, les acteurs du marché ayant manqué le mouvement descendant initial tentant d'entrer sur le marché. L'absence de divergence haussière claire sur des indicateurs comme le RSI ou le MACD soutient davantage l'idée que la faiblesse actuelle est plus susceptible de persister que de s'inverser brusquement. Il est donc conseillé aux traders de se méfier des achats dans la force, car le risque d'un renversement rapide reste élevé.
Lorsque nous examinons la corrélation avec l'indice du dollar américain (DXY), l'image devient plus claire. Le DXY évolue actuellement à 101,16 et montre une tendance de renforcement, particulièrement sur les graphiques de 4 heures et journaliers. Un DXY en hausse exerce généralement une pression à la baisse sur les actions américaines comme le S&P 500, car un dollar plus fort rend les biens américains plus chers pour les acheteurs étrangers et peut signaler une politique monétaire plus restrictive ou une fuite vers la sécurité. La force actuelle du DXY, associée au sentiment baissier du S&P 500, suggère une relation de renforcement en jeu. Cette corrélation implique que toute hausse supplémentaire du dollar pourrait exacerber la pression vendeuse sur l'indice, tandis qu'un repli significatif du DXY pourrait offrir un répit temporaire, bien que pas nécessairement un renversement complet de la tendance.
De plus, la performance des indices boursiers connexes fournit un contexte supplémentaire. Le Nasdaq 100, souvent considéré comme un baromètre des actions de croissance et technologiques, montre un schéma baissier similaire, en baisse de 1,02 % à 28 886,88. Ses graphiques horaires et de 4 heures indiquent de fortes tendances baissières, avec des lectures RSI dans la partie basse de la trentaine et des valeurs ADX confirmant la force de la tendance. Le Dow Jones Industrial Average, bien que présentant une image mitigée selon les unités de temps, rencontre également une résistance et présente des signaux baissiers sur les unités de temps plus courtes. Cette faiblesse généralisée sur les principaux indices américains renforce l'idée que l'environnement de marché actuel est celui de l'aversion au risque, où une pression vendeuse généralisée affecte plusieurs secteurs. L'interconnexion de ces indices signifie que la faiblesse de l'un se répercute souvent sur les autres, créant un effet domino qui pèse sur le sentiment général du marché.
En examinant les indicateurs économiques plus larges, l'action récente des prix sur le S&P 500 semble réagir à une interaction complexe de facteurs. Bien que les bénéfices des entreprises aient montré de la résilience dans certains secteurs, comme noté dans de récents commentaires de marché, les perspectives économiques globales restent incertaines. Les pressions inflationnistes, bien que potentiellement en modération, continuent d'être une préoccupation pour les banques centrales, conduisant à un ton hawkish qui atténue l'appétit pour le risque. La position de la Réserve fédérale, en particulier tout indice issu des prochains minutes du FOMC ou des déclarations, sera cruciale pour façonner les attentes du marché concernant la future politique des taux d'intérêt. Toute indication d'une période prolongée de taux plus élevés ou d'une réticence à baisser les taux pourrait peser davantage sur les valorisations des actions, en particulier pour les entreprises axées sur la croissance qui constituent une partie importante du S&P 500.
Le secteur de l'énergie, en particulier le Brent Crude évoluant à 77,91 $ et le WTI à 74,49 $, montre un contraste frappant avec une dynamique haussière significative. Ces prix du pétrole en hausse, dus aux tensions géopolitiques et aux préoccupations d'approvisionnement, peuvent contribuer aux pressions inflationnistes. Cela crée un dilemme pour les décideurs : des coûts énergétiques plus élevés pourraient alimenter l'inflation, obligeant potentiellement les banques centrales à maintenir, voire à augmenter, les taux d'intérêt, ce qui à son tour exercerait une pression supplémentaire sur les marchés boursiers comme le S&P 500. Cette dynamique met en évidence les forces macroéconomiques complexes en jeu, où la force d'une classe d'actifs peut devenir involontairement un vent contraire pour une autre, créant un environnement difficile pour les portefeuilles diversifiés.
La configuration technique actuelle sur le S&P 500, en particulier la confluence des niveaux de résistance et des indicateurs baissiers, suggère que la tendance baissière prédominante est susceptible de se poursuivre à court et moyen terme. L'échec à franchir de manière décisive la zone de résistance de 6 570 $ - 6 590 $ sur les graphiques horaires et de 4 heures, associé aux forts signaux baissiers sur l'unité de temps journalière (ADX élevé, RSI inférieur à 50, MACD négatif), indique une probabilité plus élevée de nouvelles baisses. Le niveau de support clé à surveiller sur le graphique journalier est de 6 377,47 $. Une cassure en dessous de ce niveau signalerait une accélération significative de la tendance baissière, ouvrant potentiellement la porte à de nouvelles baisses vers les prochains niveaux de support significatifs à 6 230,63 $ et 6 149,87 $. Inversement, une clôture forte et soutenue au-dessus de 6 605,07 $ serait nécessaire pour invalider la thèse baissière immédiate et suggérer un potentiel changement de momentum.
Scénario Baissier : Continuation de la Tendance
65% ProbabilitéScénario Neutre : Phase de Consolidation
25% ProbabilitéScénario Haussier : Rallye de Couverture de Ventes
10% ProbabilitéQuestions Fréquentes : Analyse du S&P 500
Que se passe-t-il si le S&P 500 casse sous le niveau de support de 6 377,47 $ ?
Une cassure sous 6 377,47 $ sur le graphique journalier confirmerait la continuation de la forte tendance baissière. Cela déclencherait probablement une pression vendeuse supplémentaire, menant potentiellement à des baisses vers les prochains niveaux de support significatifs à 6 230,63 $ et 6 149,87 $.
Les traders devraient-ils envisager d'acheter aux niveaux actuels de 6 572,87 $ compte tenu des signaux mitigés ?
Acheter aux niveaux actuels comporte un risque important en raison de la tendance baissière prédominante et de la résistance à 6 572,87 $. Bien que certains rebonds à court terme soient possibles, un signal haussier confirmé, tel qu'une clôture journalière au-dessus de 6 605,07 $, serait nécessaire pour justifier l'entrée dans des positions longues avec une probabilité de succès plus élevée.
Le RSI à 45,35 est-il un signal de vente pour le S&P 500 actuellement ?
Un RSI de 45,35 sur le graphique journalier n'est pas un signal de vente absolu mais indique une inclinaison baissière, avec une marge considérable pour une nouvelle baisse avant que les conditions de survente ne soient atteintes. Il suggère que les vendeurs contrôlent davantage que les acheteurs, renforçant le sentiment négatif général.
Comment les prochains minutes de la Fed pourraient-elles affecter le prix du S&P 500 autour de 6 572,87 $ ?
Des commentaires hawkish dans les minutes de la Fed pourraient accroître l'incertitude et l'aversion au risque, poussant potentiellement le S&P 500 plus bas à partir des niveaux actuels. Inversement, des signaux d'une pause potentielle ou de futures baisses de taux, bien qu'improbables compte tenu des données actuelles, pourraient offrir un soulagement temporaire et soutenir un rebond vers la résistance.
Suivez les marchés en temps réel
Analyses IA et données en temps réel.