

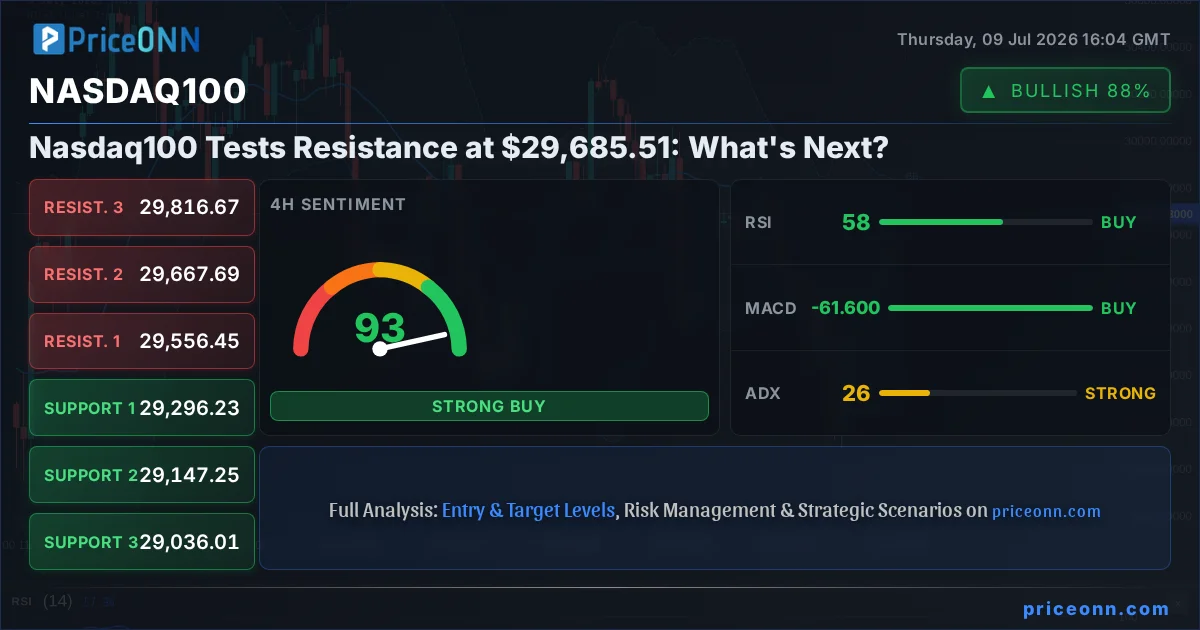
Nasdaq100 today analysis shows the index hovering precariously near resistance at $29,685.51. This critical juncture follows a significant rally, with bulls attempting to extend gains despite the looming technical hurdles. The question on every trader's mind is whether this upward momentum can overcome the overhead supply, or if a pullback is imminent. Examining the interplay of various timeframes and indicators is crucial to navigating this pivotal moment in the Nasdaq100's price action.
- RSI at 65.94 on the 1H chart signals overbought pressure is building, suggesting caution for further upside.
- The critical resistance level sits at $29,718.29, a barrier tested multiple times this week.
- MACD histogram shows positive momentum on the 1H chart, but on the 1D chart, it indicates negative momentum, suggesting conflicting signals.
- The strong ADX reading of 25.54 on the 1H chart points to a strengthening trend, but its lower value on the 1D chart (16.2) indicates a weaker trend over longer periods.
- Correlation with DXY at 100.88 is a key factor; a rising dollar could pressure tech stocks like those in the Nasdaq100.
The Nasdaq100's Ascent: A Technical Perspective
The Nasdaq100's journey towards $29,685.51 has been characterized by a determined bullish push, particularly evident across its shorter timeframes. On the 1-hour chart, the trend is unequivocally bullish with a power rating of 100%, indicating strong conviction behind the current move. This is supported by a confluence of technical signals: the MACD is printing positive momentum with the MACD line above its signal line, and the Stochastic oscillator's %K line is above its %D line at 82.96 and 79.21 respectively, indicating upward momentum, though nearing overbought territory. The RSI at 65.94, while not yet in the extreme overbought zone, suggests that the buying pressure is significant and has been sustained. The ADX at 25.54 further reinforces the idea of a trending market, though its strength is considered moderate. This upbeat short-term picture is encouraging for those betting on further upside, but the proximity to resistance levels warrants careful observation.
However, a deeper dive into the 4-hour and daily charts reveals a more nuanced, and potentially cautionary, narrative. While the 4-hour chart also shows a bullish trend (88% power), the daily chart presents a less clear picture, with a neutral trend strength of 50%. This divergence across timeframes is a classic sign that the market is at a crossroads. The daily MACD, for instance, shows negative momentum, with the MACD line below its signal line. This suggests that the longer-term trend might be losing steam, or that a period of consolidation could be on the horizon. The daily RSI at 51.43 sits squarely in neutral territory, offering little directional conviction. The ADX on the daily chart is only 16.2, indicating a very weak trend. This contrast between the aggressive short-term bullishness and the more subdued longer-term technicals creates a critical battleground around the current price levels.
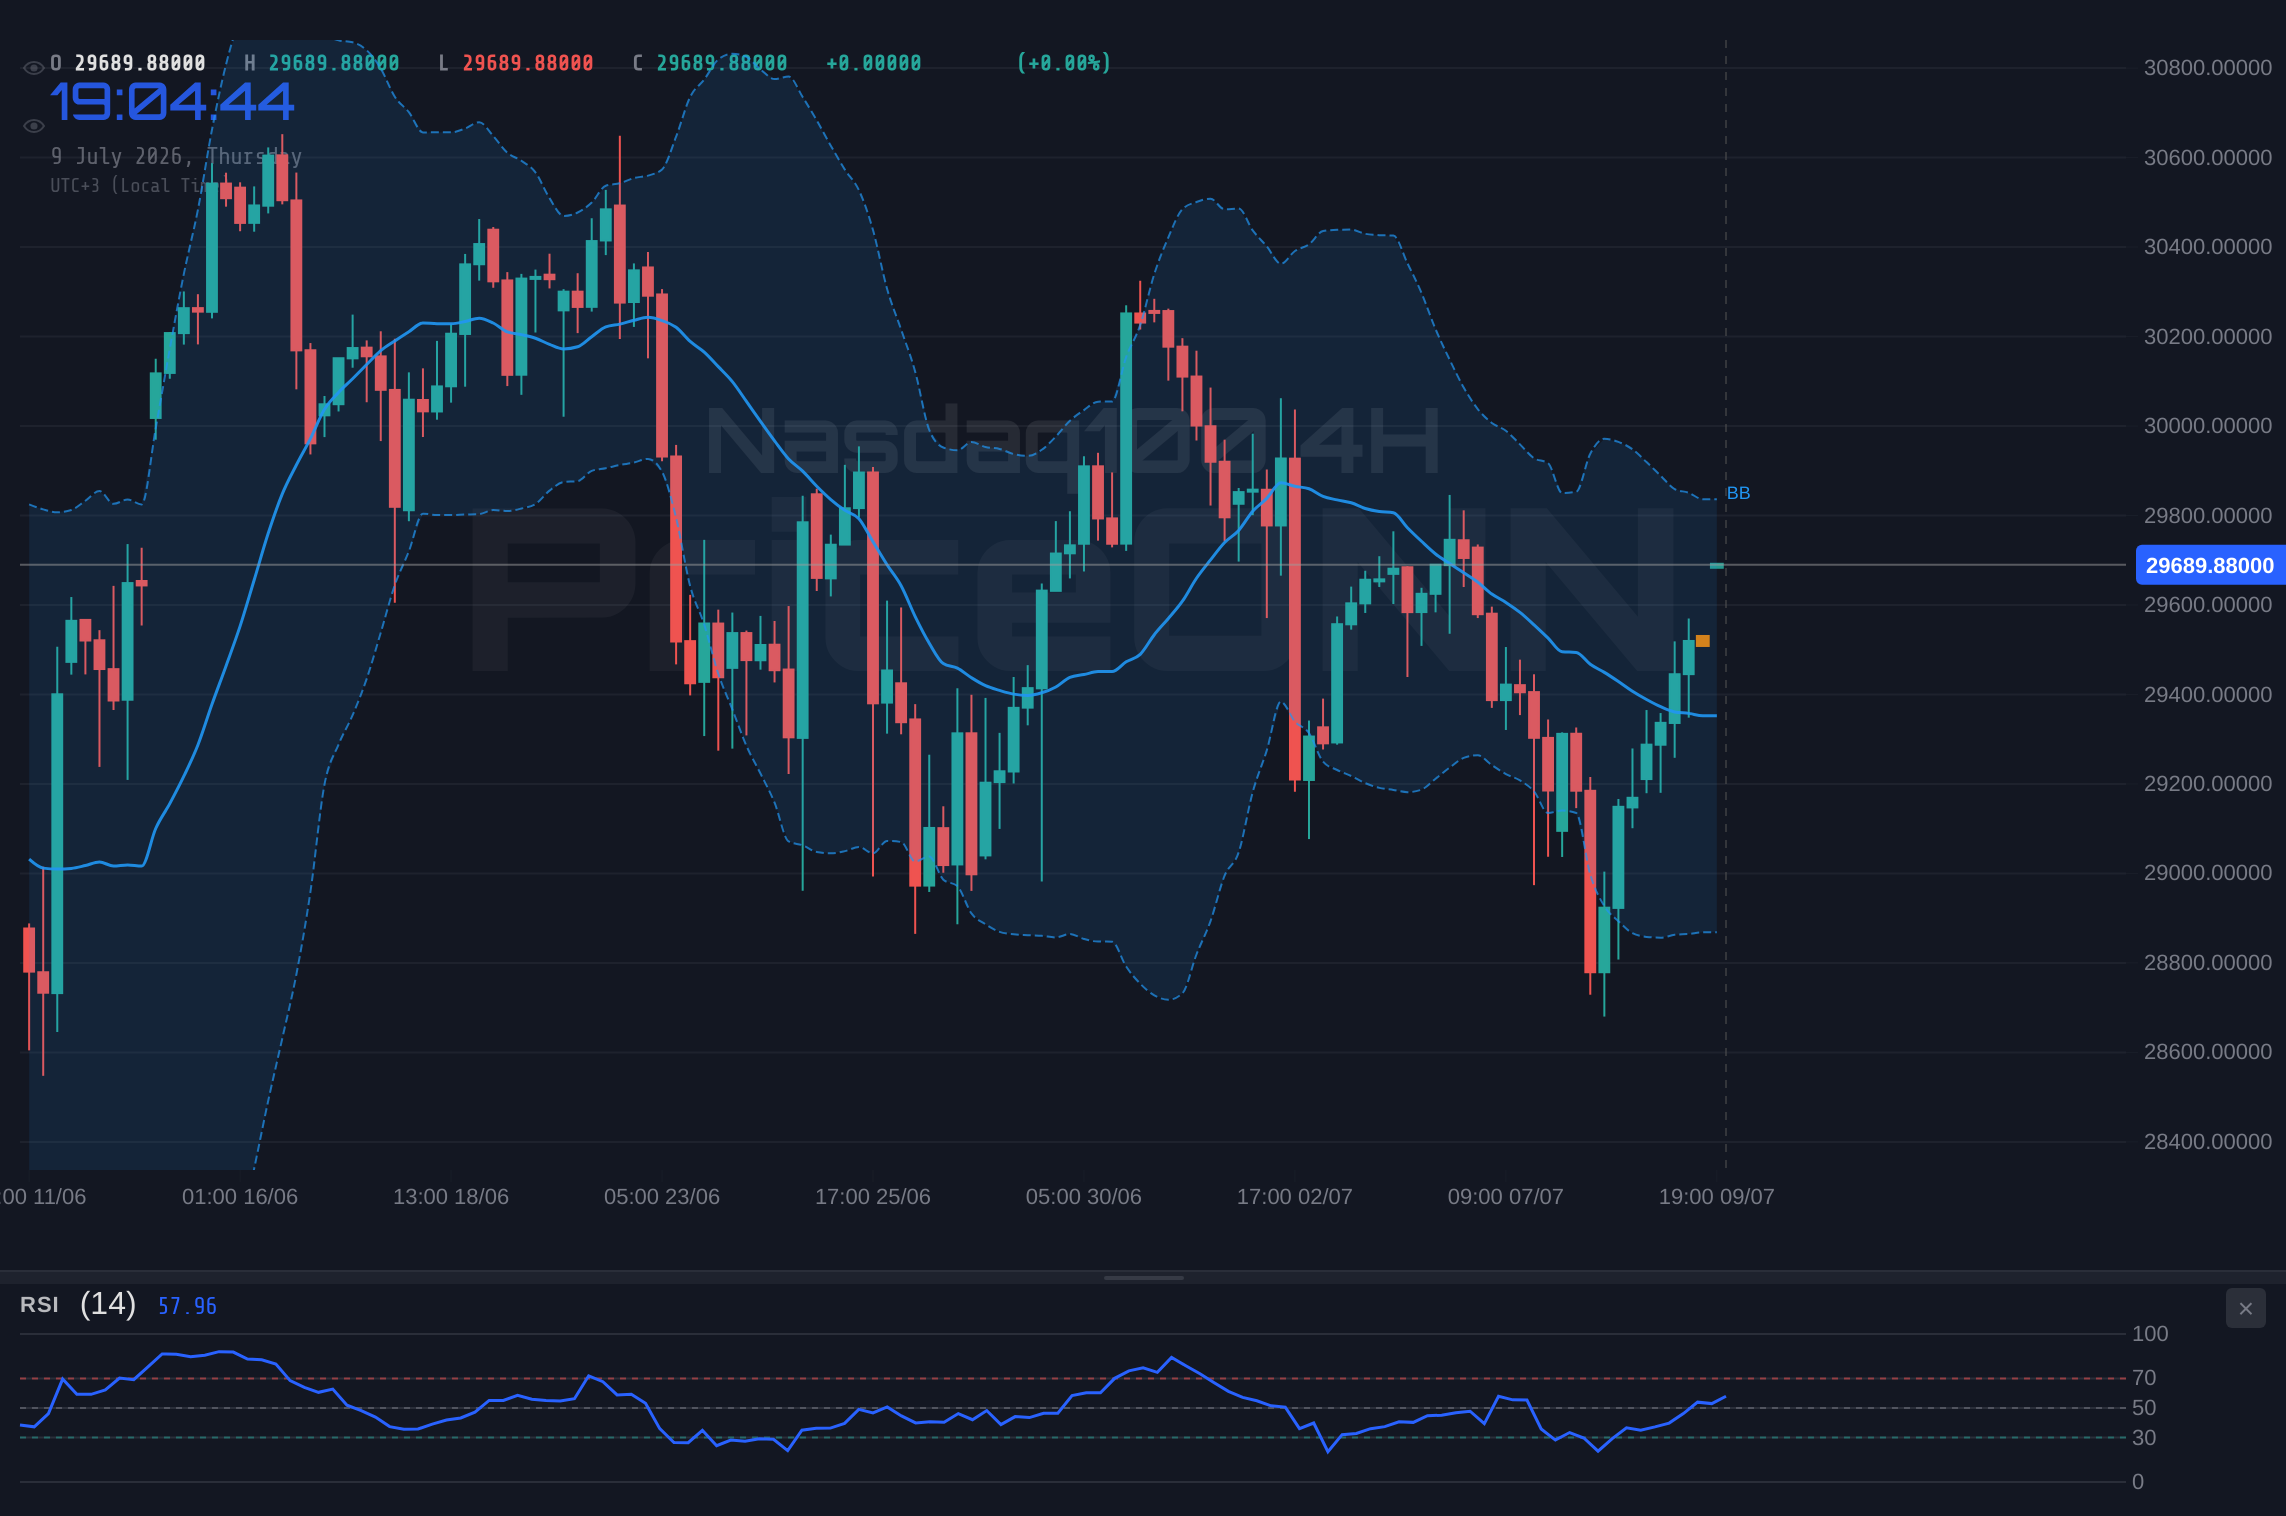
Navigating the Resistance at $29,718.29
The immediate price ceiling for the Nasdaq100 lies at the resistance level of $29,718.29. This is not just an arbitrary number; it represents a price point where selling pressure has historically emerged, stalling further upward advances. On the 1-hour chart, additional resistance levels are noted at $29,865.56 and $29,556.45, providing a layered defense for the bears. A decisive breach and sustained hold above $29,718.29 would be a significant bullish signal, potentially opening the door for a move towards $29,865.56 and even $30,025.15. Such a breakout would likely be accompanied by an increase in volume and a more robust bullish confirmation from indicators like the RSI moving decisively above 70 and the MACD histogram turning more positive on longer timeframes. Traders will be watching for this confluence of factors as confirmation of a sustained upward move.
Conversely, failure to decisively break through $29,718.29 could lead to a reversal. The 1-hour support levels at $29,411.43, $29,251.84, and $29,104.57 would then become the immediate targets for any downward price action. A close below $29,411.43, for example, could signal a short-term trend change, potentially triggering further selling as traders reassess their positions. The daily chart's support levels, starting from $28,790.68, represent more significant areas of interest for longer-term trend evaluation should a more substantial correction occur. The interplay between these support and resistance zones will dictate the Nasdaq100's path in the coming sessions.
Correlation Dynamics: DXY and Equities
Understanding the Nasdaq100's behavior necessitates looking beyond its own charts and considering its correlations with broader market forces. The Dollar Index (DXY) is currently trading at 100.88, showing a slight downtrend on the 1-hour chart but a stronger upward trend on the daily chart. Historically, a strengthening dollar, as suggested by the DXY's daily trend, often puts pressure on global equities, including the tech-heavy Nasdaq100, as it makes US assets more expensive for foreign investors. Conversely, a weaker dollar can fuel risk appetite and support stock markets. The current mixed signals from the DXY across different timeframes add another layer of complexity to the Nasdaq100's outlook. If the DXY resumes its upward trend, it could act as a significant headwind for the Nasdaq100, especially as it tests key resistance levels.
The correlation with other major US indices also plays a crucial role. The S&P 500 is currently trading at 6572.87, showing a strong bullish trend on the 1-hour chart but a bearish trend on the daily chart. Similarly, the Dow Jones Industrial Average is at 52504.5, with a bullish short-term trend but a bearish signal on the 4-hour chart. This divergence within the broader equity market mirrors the Nasdaq100's own mixed signals. A synchronized move higher across all major indices would provide stronger confirmation for the Nasdaq100's bullish continuation. However, if weakness emerges in the S&P 500 or Dow Jones, especially on their daily charts, it could quickly spill over and drag the Nasdaq100 lower, even if its short-term technicals appear robust. The current market sentiment, therefore, is a delicate balance of sector-specific strength and broader macroeconomic influences.
Assessing the Indicators: A Deeper Dive
The technical indicators offer a mixed bag of signals when viewed across different timeframes, underscoring the current indecision in the market. On the 1-hour chart, the RSI at 66.62 for XAUUSD is in neutral territory but trending higher, suggesting continued buying interest. The MACD is positive, and Stochastic is in overbought territory at 85.73, which could signal a potential pullback soon. The ADX at 20.29 indicates a moderately trending market. For XAGUSD, the 1H RSI is 68.11, also neutral but trending up, with Stochastic at a very high 93.61, pointing to potential overextension. The ADX at 23.17 suggests a moderate uptrend. These precious metals are showing some bullish signs on the shorter term, potentially benefiting from any risk-off sentiment that might emerge if the Nasdaq100 falters.
EURUSD's 1-hour chart shows an RSI of 58.02, indicating a bullish bias, supported by a positive MACD momentum. Stochastic at 59.64 is in the upper half of its range, and the ADX at 22.02 suggests a moderate uptrend. This suggests some strength in the Euro. Conversely, USDJPY's 1-hour chart presents a bearish picture with an RSI at 41.01, negative MACD momentum, and Stochastic at 31.07, all pointing downwards. The ADX at 16.84 signals a weak trend. This divergence between EURUSD and USDJPY indicates broader USD weakness against the Euro but strength against the Yen. GBPUSD's 1-hour RSI is 56.74, leaning bullish, with Stochastic at 39.91 and ADX at 15.23, indicating a weak uptrend. AUDUSD's 1-hour chart is bullish with RSI at 58.87, positive MACD, and Stochastic at 69.64, supported by an ADX of 12.38 signaling a weak trend. NZDUSD, however, shows a strong bullish trend on the 1-hour chart with RSI at 79.26 and Stochastic at 93.55, indicating extreme overbought conditions and a potential for a sharp reversal.
The broader market indices also paint a complex picture. The S&P 500's 1-hour chart shows an RSI of 70.95, indicating overbought conditions, and Stochastic at 65.73, also in the upper range. The ADX at 49.72 signifies a strong uptrend, but the negative MACD momentum warns of potential exhaustion. The Dow Jones 30 shows a mixed trend, with a bullish 1-hour RSI at 56.03, but a bearish 4-hour RSI at 46.67. The daily ADX for the Dow is strong at 30.6, suggesting a robust trend, but Stochastic at 52.5 indicates a neutral-to-slightly bullish stance. The conflicting signals across these major indices highlight the market's uncertainty and the need for traders to remain vigilant.
The Nasdaq100 is at a critical resistance level ($29,718.29). While short-term indicators show bullish momentum, longer-term charts and conflicting signals from broader indices suggest that a pullback is a distinct possibility. Traders should exercise caution and await clearer directional confirmation.
Trade Scenarios for the Nasdaq100
Given the current technical landscape, several scenarios could unfold for the Nasdaq100 as it grapples with the resistance at $29,718.29. The probabilities assigned below reflect the current technical picture, with a slight lean towards a bearish or neutral outcome due to the conflicting signals across timeframes and the presence of overbought conditions on shorter timeframes.
Bearish Scenario: Resistance Holds Firm
65% ProbabilityConsolidation Scenario: Range-Bound Action
25% ProbabilityBullish Scenario: Breakout Confirmation
10% ProbabilityThe Path Forward: What to Watch Next
The coming trading sessions will be crucial for the Nasdaq100. All eyes will be on the price action around the $29,718.29 resistance. A failure to break this level, coupled with a potential rise in the DXY or weakness in other major indices, could initiate a sell-off. Conversely, a decisive breakout above this resistance, supported by strong volume and positive daily indicators, would signal a continuation of the bullish trend. Traders should pay close attention to the economic calendar for any upcoming data releases that could influence market sentiment, such as inflation reports or central bank commentary, although none are immediately pressing according to the provided data. The interplay between short-term bullish momentum and longer-term technical caution defines the current trading environment.
Frequently Asked Questions: Nasdaq100 Analysis
What happens if Nasdaq100 fails to break above the $29,718.29 resistance level?
If the Nasdaq100 fails to break above $29,718.29, the bearish scenario becomes more probable. We could see price action retreat towards the 1-hour support levels, with the first target at $29,411.43 and a subsequent test of $29,251.84.
Should I buy Nasdaq100 at current levels of $29,685.51 given the RSI at 65.94?
Buying at current levels carries significant risk due to the proximity to resistance and the RSI nearing overbought territory. A more prudent approach would be to wait for a confirmed breakout above $29,718.29 or a pullback to a key support level like $29,411.43, with a 65% probability favoring a bearish move from current resistance.
Is the MACD's negative momentum on the 1D chart a sell signal for Nasdaq100?
The negative MACD momentum on the daily chart is a bearish signal that contrasts with the positive momentum on the 1-hour chart. While not an immediate sell, it suggests that the longer-term uptrend might be losing strength, warranting caution against aggressive long positions without further bullish confirmation.
How will the DXY at 100.88 affect Nasdaq100 this week?
With the DXY showing a stronger upward trend on its daily chart, it could exert downward pressure on the Nasdaq100. A strengthening dollar typically correlates with a risk-off environment, potentially capping upside for tech stocks as they test resistance near $29,718.29.
The Nasdaq100 stands at a critical juncture near $29,685.51. While short-term strength is evident, the confluence of resistance levels and mixed signals across different timeframes demands a cautious approach. Patience and disciplined risk management will be key for traders looking to navigate this potentially volatile period. The market's next move will likely be determined by its ability to decisively break through overhead resistance or respect the established selling pressure.
| Indicator | Value | Signal | Interpretation |
|---|---|---|---|
| RSI (1H) | 65.94 | Neutral | Nearing overbought, potential for pullback |
| MACD Histogram (1H) | Positive | Bullish | Positive momentum building |
| Stochastic (1H) | K:82.96, D:79.21 | Bullish | Strong upward momentum, near overbought |
| ADX (1H) | 25.54 | Bullish | Moderate uptrend strength |
| RSI (1D) | 51.43 | Neutral | No clear directional bias |
| MACD Histogram (1D) | Negative | Bearish | Negative momentum developing |
| ADX (1D) | 16.2 | Neutral | Weak trend strength |
Track markets in real-time
AI-powered analysis, technical indicators and real-time price data.
Join Our Telegram Channel
Breaking market news, AI analysis and trading signals instantly.
Join Channel