

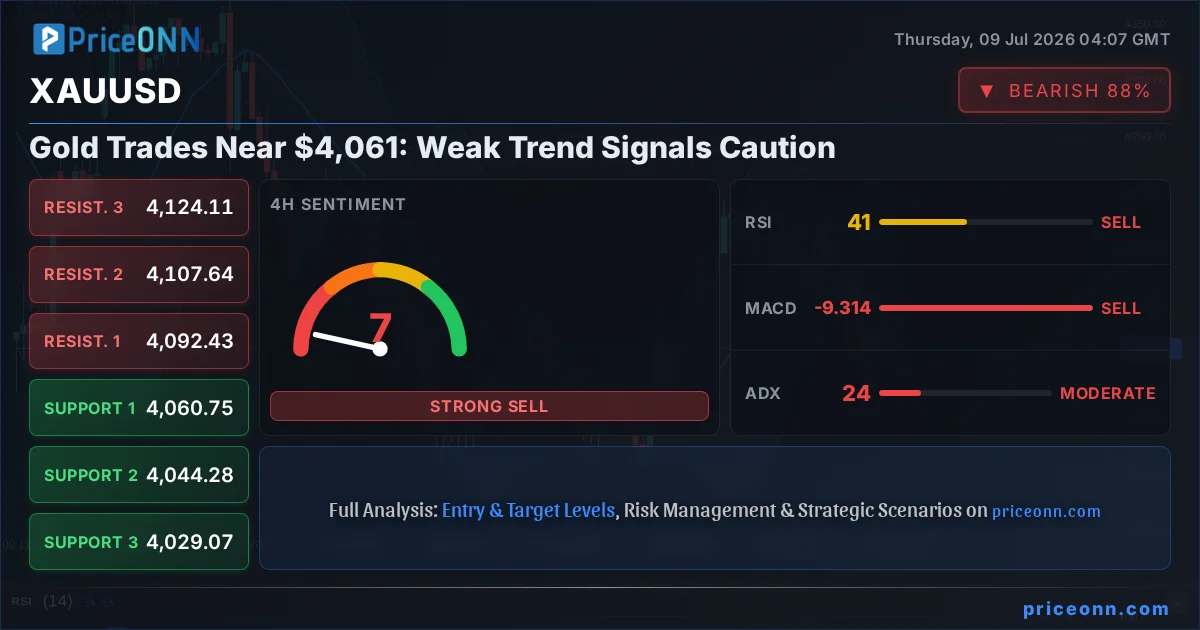
The relentless pursuit of new all-time highs for gold has hit a temporary pause, and frankly, this is where things get interesting. XAUUSD is currently trading around the $4,061.31 mark, a level that, while seemingly stable, is being scrutinized by traders looking for the next directional clue. For weeks, the market has been caught between the bullish narrative of inflation hedge and safe-haven demand, and the bearish counter-arguments stemming from a potentially strengthening dollar and shifting central bank policies. The current price action suggests a market in a state of flux, with neither the bulls nor the bears able to establish firm control. This indecision is precisely what we need to dissect to understand where the smart money might be positioning itself. Today's analysis dives deep into the technical underpinnings of gold's current position, examining the confluence of indicators and levels that will dictate its short-to-medium term trajectory.
- Gold's current price is $4,061.31, reflecting a neutral trend with a 1H sell signal and a 4H/1D sell signal, indicating downward pressure.
- Key support is identified at $4,021.29 on the daily chart, with critical intraday support at $4,058.57.
- Resistance is noted at $4,133.45 on the daily timeframe, with immediate intraday resistance at $4,076.64.
- The ADX reading across multiple timeframes (1H: 16.33, 4H: 24.08, 1D: 37.65) suggests a weak to moderate trend, indicating potential for consolidation or a breakout.
- Correlation analysis shows DXY at 100.99, currently showing a mixed signal across timeframes but with a dominant 1D buy signal, potentially capping gold's upside.
The narrative around gold has been a tug-of-war for months. On one side, we have the persistent inflation fears and geopolitical uncertainties that traditionally buoy the precious metal. On the other, the specter of higher-for-longer interest rates from major central banks, particularly the Federal Reserve, acts as a persistent headwind. This data suggests gold is currently caught in this crossfire. The 1-hour chart shows a 'SAT' (Sell) signal, which is reinforced by the 4-hour and daily charts also flashing 'SAT' signals, albeit with weaker ADX readings on the shorter timeframes. This suggests that while the immediate pressure is downwards, the conviction behind the move might not be as strong as the signals imply. The ADX on the 1-hour chart at 16.33 screams 'weak trend,' meaning that the current price action could be more noise than signal. However, the daily ADX at 37.65 paints a different picture, indicating a strong trend - but in which direction? This conflict across timeframes is the crux of our analysis today. We need to understand if this is a temporary lull or the precursor to a more significant move. Looking at the price action, gold has been trading within a range, and the current levels near $4,061.31 are crucial test points. A failure to hold the immediate support could see a swift move lower, while a surprising surge could re-test higher resistance levels.
Navigating the Crossroads: What the Indicators Are Saying
Let's cut straight to the chase: the technical indicators are painting a mixed, yet predominantly cautious, picture for XAUUSD. On the 1-hour timeframe, the RSI is sitting at 40.04, firmly in neutral territory but leaning towards the bearish side, suggesting that the downward momentum has some room to run before becoming oversold. The MACD, while showing positive momentum with its histogram above the signal line, operates within the context of a broader bearish trend on this short-term chart. Bollinger Bands are also indicating a bearish inclination, with the price trading below the middle band. The Stochastic oscillator, with K at 34.76 and D at 66.48, clearly signals a bearish cross, reinforcing the idea of selling pressure. However, the ADX at 16.33 is the real anomaly here. A reading this low suggests a lack of directional strength, implying that the current bearish signals might not have the conviction to drive a significant trend. This is the kind of environment where scalpers might find opportunities, but swing traders need to exercise extreme caution.
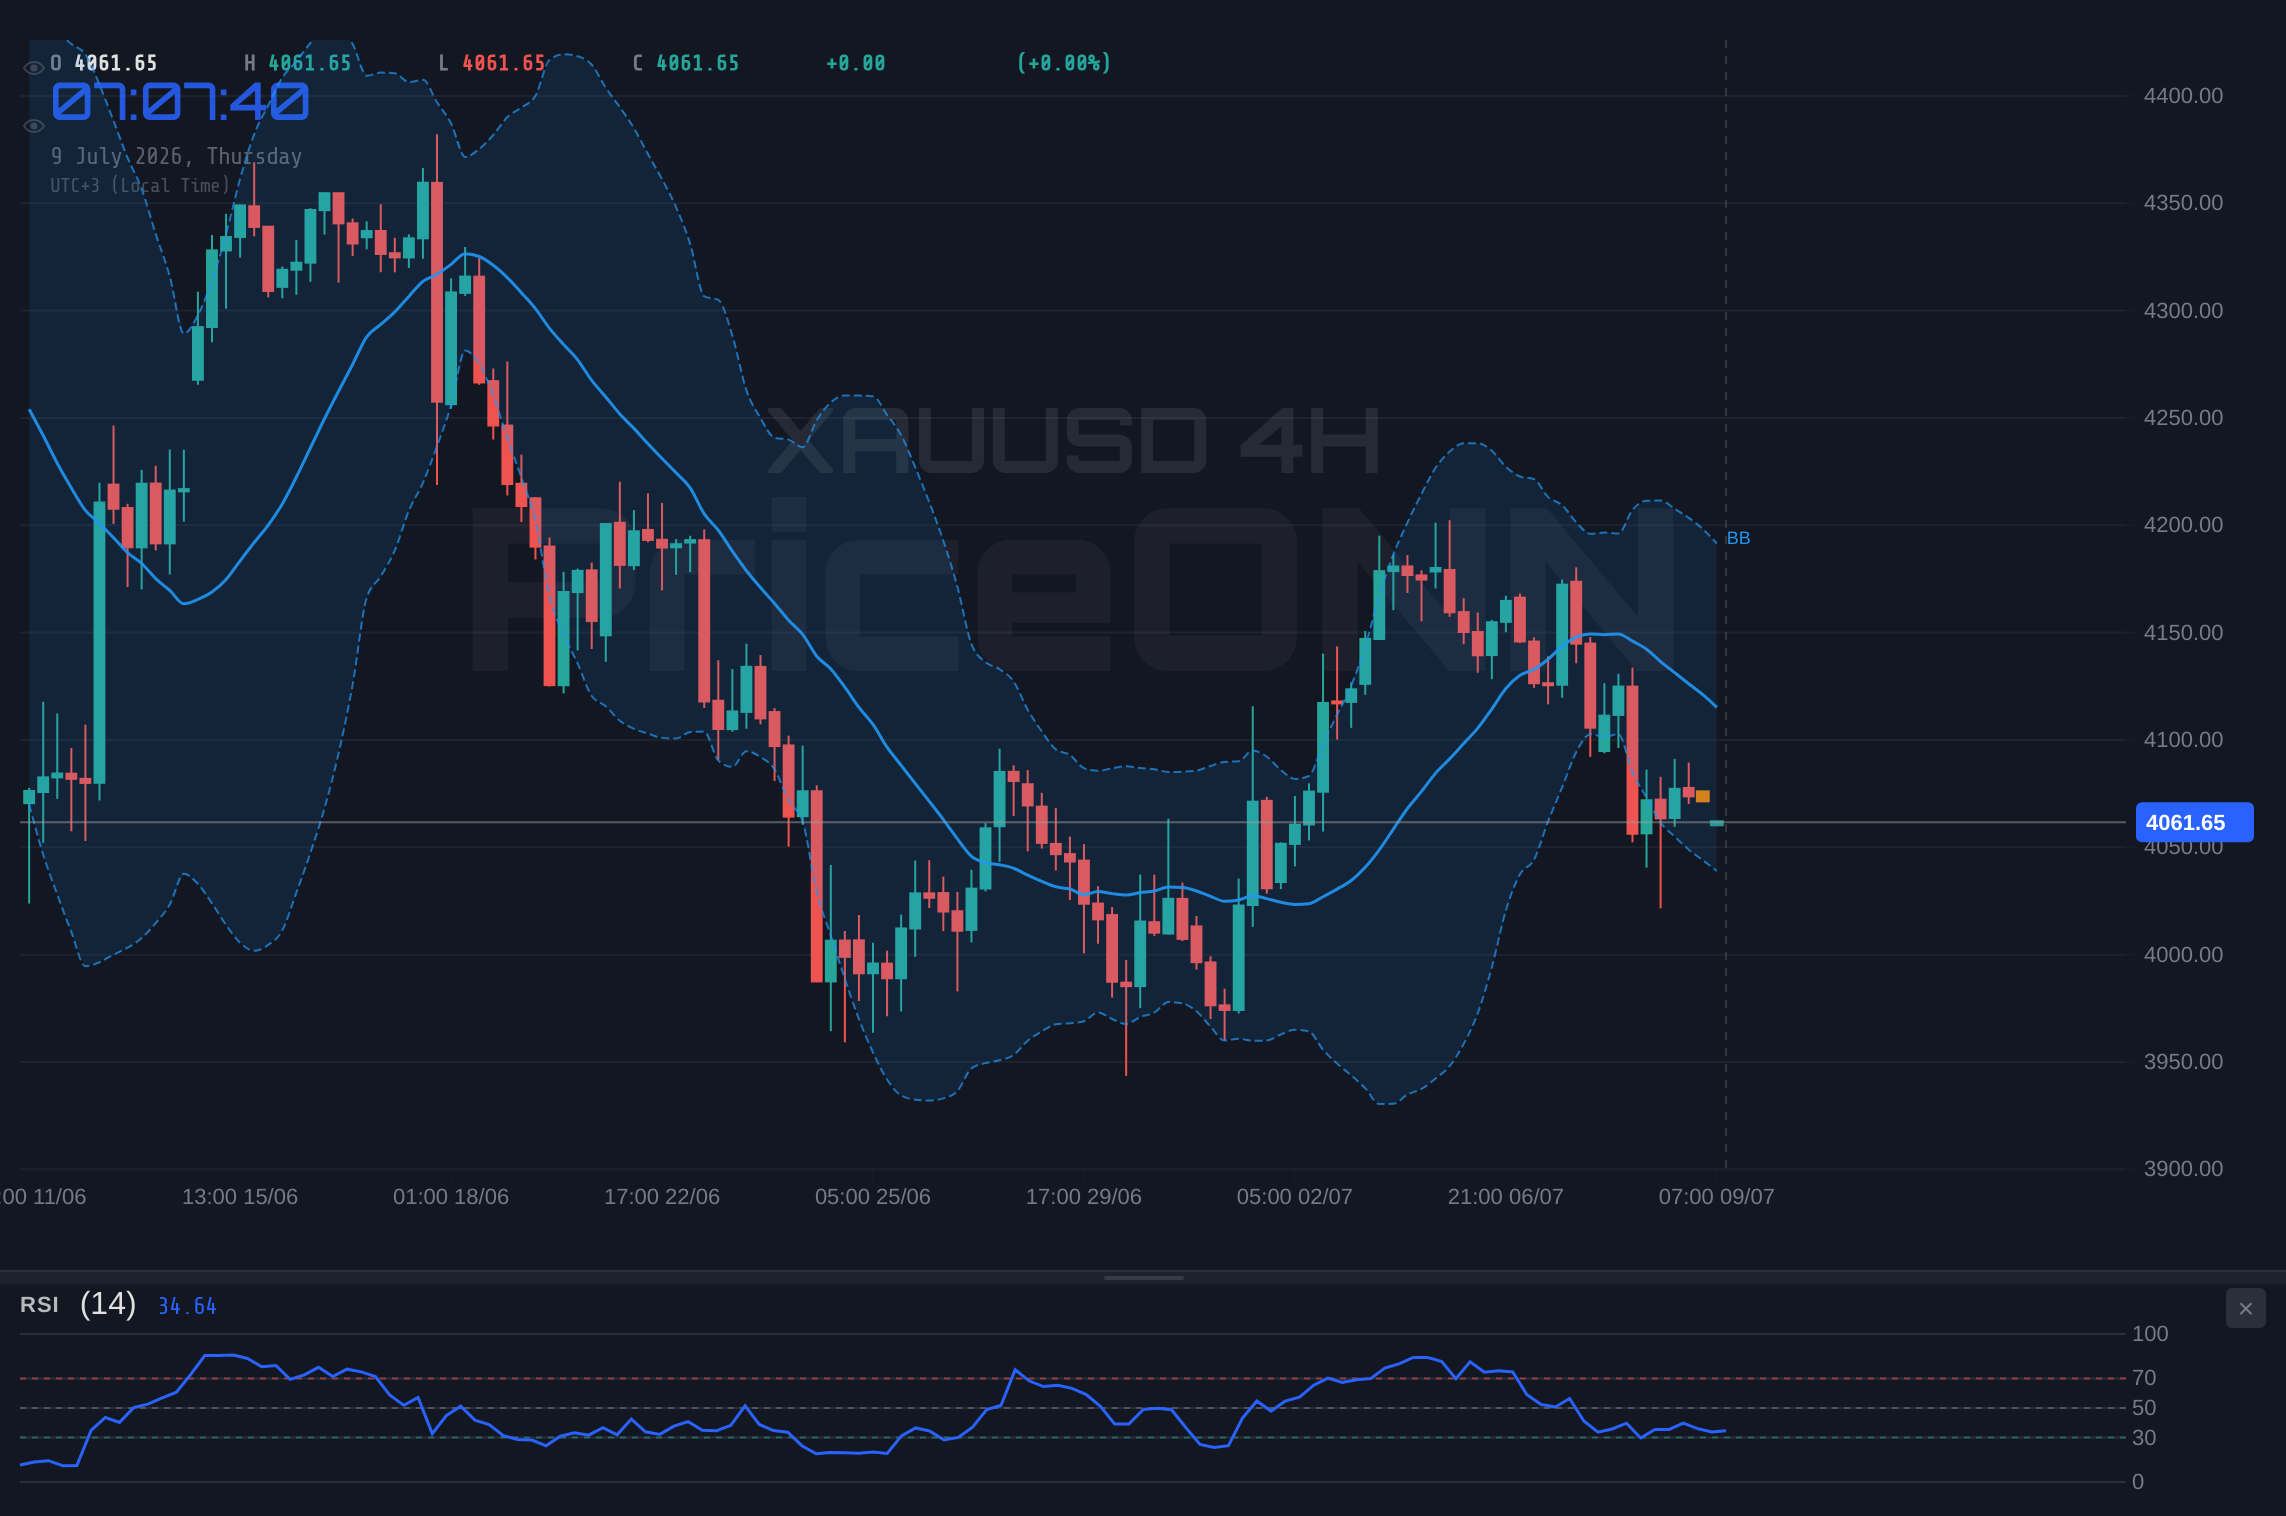
Shifting to the 4-hour chart, the picture becomes slightly more complex. The RSI at 41.36 continues the theme of neutral-to-bearish sentiment. The MACD here is negative, with the histogram below the signal line, indicating bearish momentum building. Bollinger Bands are again below the middle band, consistent with a bearish bias. Yet, the Stochastic oscillator presents a conflicting signal: K=28.82 and D=23.39 shows a potential bullish cross, suggesting a possible reversal or at least a pause in the downtrend. The ADX at 24.08 indicates a moderate trend strength, a step up from the 1-hour but still not indicative of a runaway trend. This divergence between the MACD and Stochastic on the 4-hour chart is a classic sign of a market consolidating its recent moves, potentially waiting for a catalyst to break the deadlock. The overall signal for the 4-hour is still 'SAT', but the conflicting Stochastic reading warrants attention. It tells us that while the path of least resistance might be down, there's a flicker of potential buying interest.
The daily chart, the most significant timeframe for long-term trend assessment, presents a scenario of 'Nötr' trend with 50% strength, yet the 'Genel Sinyal' is a stark 'SAT'. The RSI at 40.04 continues the downtrend bias. The MACD is positive, with the histogram above the signal line, which is a bullish sign on its own, but it must be interpreted within the context of the other indicators. Bollinger Bands are below the middle band, suggesting downward pressure. Crucially, the Stochastic oscillator shows K=53.27 and D=63.37, indicating a bearish cross and reinforcing the sell signal. However, the ADX reading of 37.65 is the most telling here. An ADX above 25 signifies a strong trend, and 37.65 is a substantial figure. This suggests that if a trend is indeed in play, it has considerable force behind it. The conflict between the daily MACD and the other indicators, particularly the Stochastic and RSI, highlights the current indecision. Despite the strong ADX, the overall signal across all timeframes leans towards selling, but the weak ADX on shorter timeframes and the conflicting MACD on the daily chart suggest that any bearish move might face significant headwinds or reversals.
The prevailing narrative of a strong US Dollar (DXY currently at 100.99, with a daily 1D Buy signal) and the ongoing uncertainty surrounding Fed policy are significant headwinds for gold. While geopolitical risks can provide a floor, sustained dollar strength typically weighs on the precious metal. Traders should monitor the DXY closely; any further upside could exacerbate downward pressure on XAUUSD.
Key Levels: The Battleground for Gold
When analyzing gold, understanding the critical support and resistance levels is paramount. These aren't just numbers; they represent psychological battlegrounds where the market's sentiment is tested. On the daily chart, the immediate support lies at $4,021.29. This is a significant level, and a clear break below it would likely trigger a cascade of selling, potentially leading to tests of $3,965.35 and even $3,909.13. The fact that these levels are provided with such precision underscores their importance in any trading strategy. If gold were to find a bottom and reverse, the first hurdle would be the resistance at $4,133.45. This level has acted as a ceiling before, and breaking above it decisively would signal a shift in momentum. Beyond that, higher resistance levels are marked at $4,189.67 and $4,245.61, representing targets for a more sustained bullish recovery. For the shorter term, the 1-hour chart provides immediate reference points: support at $4,058.57 and $4,052.37, and resistance at $4,076.64 and $4,088.51. These intraday levels are crucial for gauging the immediate sentiment and potential entry/exit points for scalpers and short-term traders. The current price of $4,061.31 sits precariously close to the first daily support, making the upcoming price action critical.
The interplay between these levels and the current indicator signals is what truly matters. For instance, if gold approaches the $4,021.29 support with RSI still in the mid-40s and a bearish MACD cross on the 4-hour chart, it might suggest that the support could eventually give way. Conversely, if gold tests this support while the Stochastic oscillator on the 4-hour chart is showing oversold conditions and a bullish cross, it might present a more compelling buying opportunity, provided other factors align. The ADX reading is also key here. A high ADX near a support or resistance level suggests that a breakout or breakdown is more likely to be sustained. A low ADX, however, indicates chop and potential false moves. Currently, the daily ADX at 37.65 points to a strong trend, but the conflicting signals across timeframes mean we need to be vigilant. The intraday levels are essential for managing risk on shorter-term trades, while the daily levels define the broader market structure. The fact that gold is currently trading just above the $4,058.57 intraday support level means that the immediate reaction to any news or data release could be sharp. A close below this level on the 1-hour chart would likely accelerate the move towards the daily support at $4,021.29.
Correlations and Macroeconomic Undercurrents
To get a true sense of gold's potential direction, we must look beyond its own charts and consider its correlations with other major markets. The US Dollar Index (DXY) is a primary driver, and its current reading of 100.99, coupled with a strong daily buy signal, presents a significant challenge for gold. Historically, a rising dollar tends to put downward pressure on gold, as it increases the cost for holders of other currencies and signals a potential shift towards risk-on sentiment that favors dollar-denominated assets. While gold has sometimes decoupled from this inverse relationship, especially during periods of extreme geopolitical tension or inflation spikes, the current technical picture for the DXY suggests it could be a significant factor in capping gold's upside. A DXY holding firm or pushing higher would add considerable weight to the bearish signals we're seeing on gold's shorter-term charts.
Equities, represented by the SP500 and Nasdaq, also play a crucial role. The SP500 is trading at 6572.87 with a strong daily sell signal, despite a 1H buy signal, and the Nasdaq is at 29293.14 with a mixed daily picture but a strong 1H buy signal. Generally, a downturn in equities signals a 'risk-off' environment, which should theoretically boost safe-haven assets like gold. However, the current data shows a complex picture. The SP500's daily chart is bearish, suggesting potential headwinds for risk assets, which could support gold. Yet, the Nasdaq's 1H chart is bullish, indicating some resilience in tech stocks. This mixed signal from equities means their influence on gold is currently ambiguous. If the broader stock market sentiment turns decisively risk-averse, we could see gold benefit. But if the market remains divided, the dollar's influence might dominate. Oil prices, currently around $78.59 for Brent and $74.58 for WTI, are also relevant. While lower oil prices can sometimes signal weakening demand and potentially reduce inflation expectations (a negative for gold), the current geopolitical context, with reports of the Iran ceasefire being 'over', could inject volatility and safe-haven demand into commodities, including gold. The interplay between these three (DXY, Equities, Oil) creates a complex backdrop against which gold's price action must be interpreted.
Trade Scenarios: Charting the Path Forward
Given the current technical setup and market correlations, we can outline three potential scenarios for XAUUSD. These are not predictions, but rather frameworks for navigating the market based on the data available.
Bearish Scenario: Trend Continuation
65% ProbabilityNeutral Scenario: Consolidation and Re-evaluation
25% ProbabilityBullish Scenario: Short-Covering Rally
10% ProbabilityThe bearish scenario carries the highest probability due to the alignment of sell signals on multiple timeframes and the persistent strength of the DXY. A break of the immediate 1-hour support at $4,058.57 would be the key catalyst. This would likely lead to a test of the daily support at $4,021.29. The neutral scenario assumes a period of consolidation, where the market digests recent moves and waits for clearer direction, likely trading within the established intraday support and resistance levels. The bullish scenario, while having the lowest probability, cannot be entirely dismissed. A short-covering rally, perhaps fueled by unexpected geopolitical news or a dovish hint from the Fed, could push prices higher. However, for this to gain traction, gold would need to decisively break through the immediate resistance at $4,076.64 and then target higher levels. It's crucial to remember that the ADX readings, particularly on the shorter timeframes, suggest that strong, sustained moves might be difficult to achieve without a significant shift in market sentiment or a clear breakout from the current range.
The Trader's Edge: Actionable Insights
So, what does this all mean for the active trader right now? The current price of $4,061.31 places XAUUSD in a precarious position, teetering on the edge of key intraday support. The overwhelming sell signals across multiple timeframes, coupled with a strong dollar and a weak trend on shorter timeframes, suggest that caution is the primary virtue. The $4,058.57 level on the 1-hour chart is your immediate line in the sand. A close below this level would likely validate the bearish scenario and open the door for a move towards the daily support at $4,021.29. For those looking to trade this potential downside, waiting for confirmation - such as a clear break of $4,058.57 with increasing volume or a bearish MACD cross on the 4-hour chart - is essential. Trading against the prevailing short-term signals without confirmation is a high-risk endeavor. Conversely, a sustained hold above $4,076.64 could signal a short-covering rally, but this appears less probable given the current market dynamics. Patience appears to be rewarded here. Waiting for a clear break of either the intraday support or resistance, or a significant shift in the daily ADX and MACD, will provide a much higher probability setup than trying to guess the market's next move at these current levels.
The key takeaway is that while the daily chart might show signs of a strong trend (ADX 37.65), the shorter timeframes and conflicting indicators suggest consolidation or a potential reversal is more likely in the immediate term. The $4,021.29 daily support level remains the most critical price point for the medium term. Until gold can decisively break above the immediate resistance at $4,076.64 and sustain it, or confirm a breakdown below $4,058.57, expect choppy price action. The smart money is likely waiting for clearer signals, and so should you. Manage your risk diligently, wait for your setup, and don't chase the market. The market always gives a second chance, and clarity will emerge from these current ambiguous levels.
Frequently Asked Questions: XAUUSD Analysis
What happens if XAUUSD breaks below $4,058.57 support?
A break below $4,058.57 on the 1H chart would likely trigger a move towards the daily support at $4,021.29. This aligns with the predominant bearish signals, suggesting further downside is probable.
Should I buy XAUUSD at current levels of $4,061.31 given the mixed signals?
Buying at current levels requires caution. While some indicators show potential for a short-covering rally, the overall trend leans bearish. Confirmation above $4,076.64 is needed for a higher-probability bullish setup.
Is the RSI at 40.04 a sell signal for XAUUSD right now?
An RSI of 40.04 on the daily chart indicates a bearish bias, suggesting downward momentum. However, it's not yet oversold, and the weak ADX on shorter timeframes implies this signal might lack strong conviction.
How will the strengthening DXY at 100.99 affect XAUUSD this week?
A strong US Dollar Index (DXY) typically pressures gold prices. With the DXY showing a daily buy signal, it could exacerbate downward pressure on XAUUSD, potentially capping any upside attempts and favoring the bearish scenario.
Track markets in real-time
AI-powered analysis, technical indicators and real-time price data.
Join Our Telegram Channel
Breaking market news, AI analysis and trading signals instantly.
Join Channel