

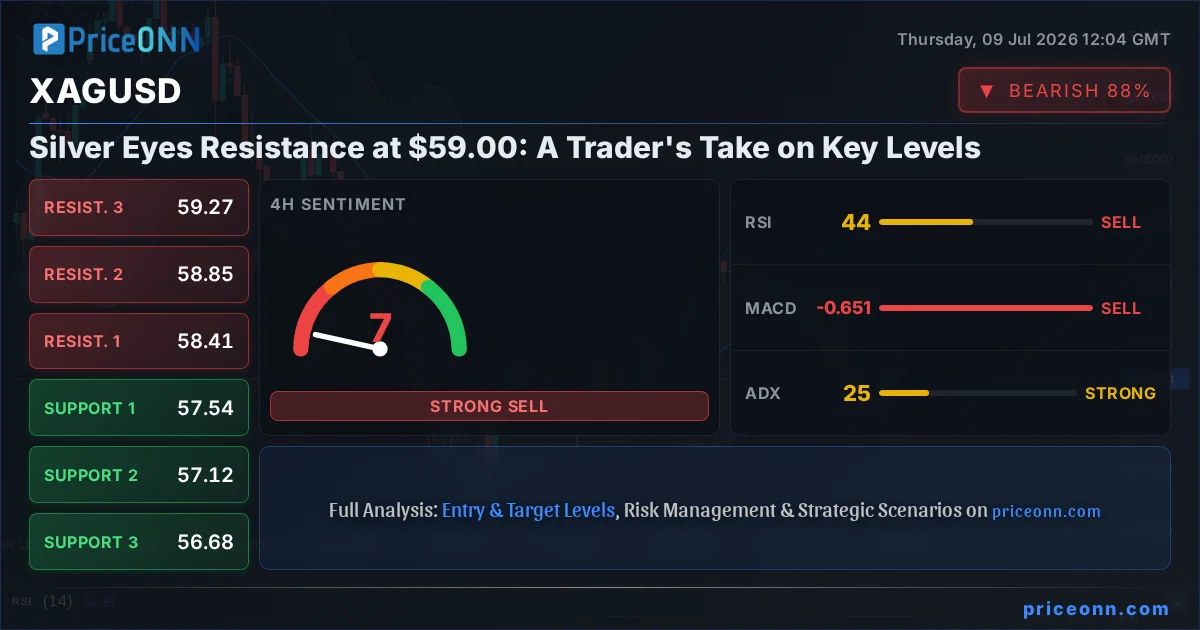
Right now, the silver market is at a fascinating crossroads, and if you're a trader, this is precisely where you need to be paying attention. XAGUSD is hovering around the $59.00 mark, nudging against a significant resistance level. This isn't just another day at the office; the confluence of technical indicators suggests we're at a critical juncture that could dictate the next significant move. Having tracked XAGUSD through its recent volatility, it's clear that the price action around $59.00 is more than just a number – it's a battleground for bulls and bears.
- XAGUSD is currently trading near the critical resistance level of $59.00, with the 1H RSI at 52.8 indicating a neutral but slightly upward-leaning momentum.
- The ADX across multiple timeframes (1H: 21.15, 4H: 25.12, 1D: 39.18) suggests a weakening trend on the hourly and 4-hour charts, but a strong trend on the daily, creating conflicting signals for immediate direction.
- Key support for XAGUSD is identified at $58.61 (1H) and $57.54 (4H), while resistance looms at $59.09 (1H) and $58.41 (4H), according to the latest market data.
- The divergence between Stochastic Oscillator signals (downtrend on 1H, uptrend on 4H) and the overall mixed signals from MACD across timeframes demand careful risk management and a clear scenario-based trading approach.
The daily chart paints a somewhat different picture, showing a stronger trend with an ADX reading of 39.18, suggesting that while short-term signals might be mixed, the longer-term direction is still developing with conviction. However, it's the immediate 1-hour and 4-hour charts that are screaming for attention right now. On the 1-hour timeframe, the RSI is sitting at 52.8, which is comfortably in neutral territory but leaning towards bullish momentum. The Stochastic Oscillator, however, is flashing a warning sign: K=75.34 and D=83.05, indicating a potential downturn as %K is below %D. This kind of divergence between indicators is exactly what separates a profitable trade from a costly mistake. It’s a classic case of conflicting signals that requires a seasoned trader’s eye to navigate.
What's truly interesting is how these signals are playing out around the $59.00 price point. On the 1-hour chart, resistance is clearly defined at $59.09. A decisive break above this level, coupled with sustained buying pressure, could signal a continuation of the upward move. Conversely, rejection from this level, especially with the Stochastic Oscillator hinting at a pullback, could see XAGUSD retrace towards its immediate support at $58.61. This level is crucial; a failure to hold here could open the door for a deeper correction towards the 4-hour support at $57.54. The market is essentially telling us that $59.00 isn't just a price; it's a psychological barrier that needs to be cleared for the bulls to regain significant control.
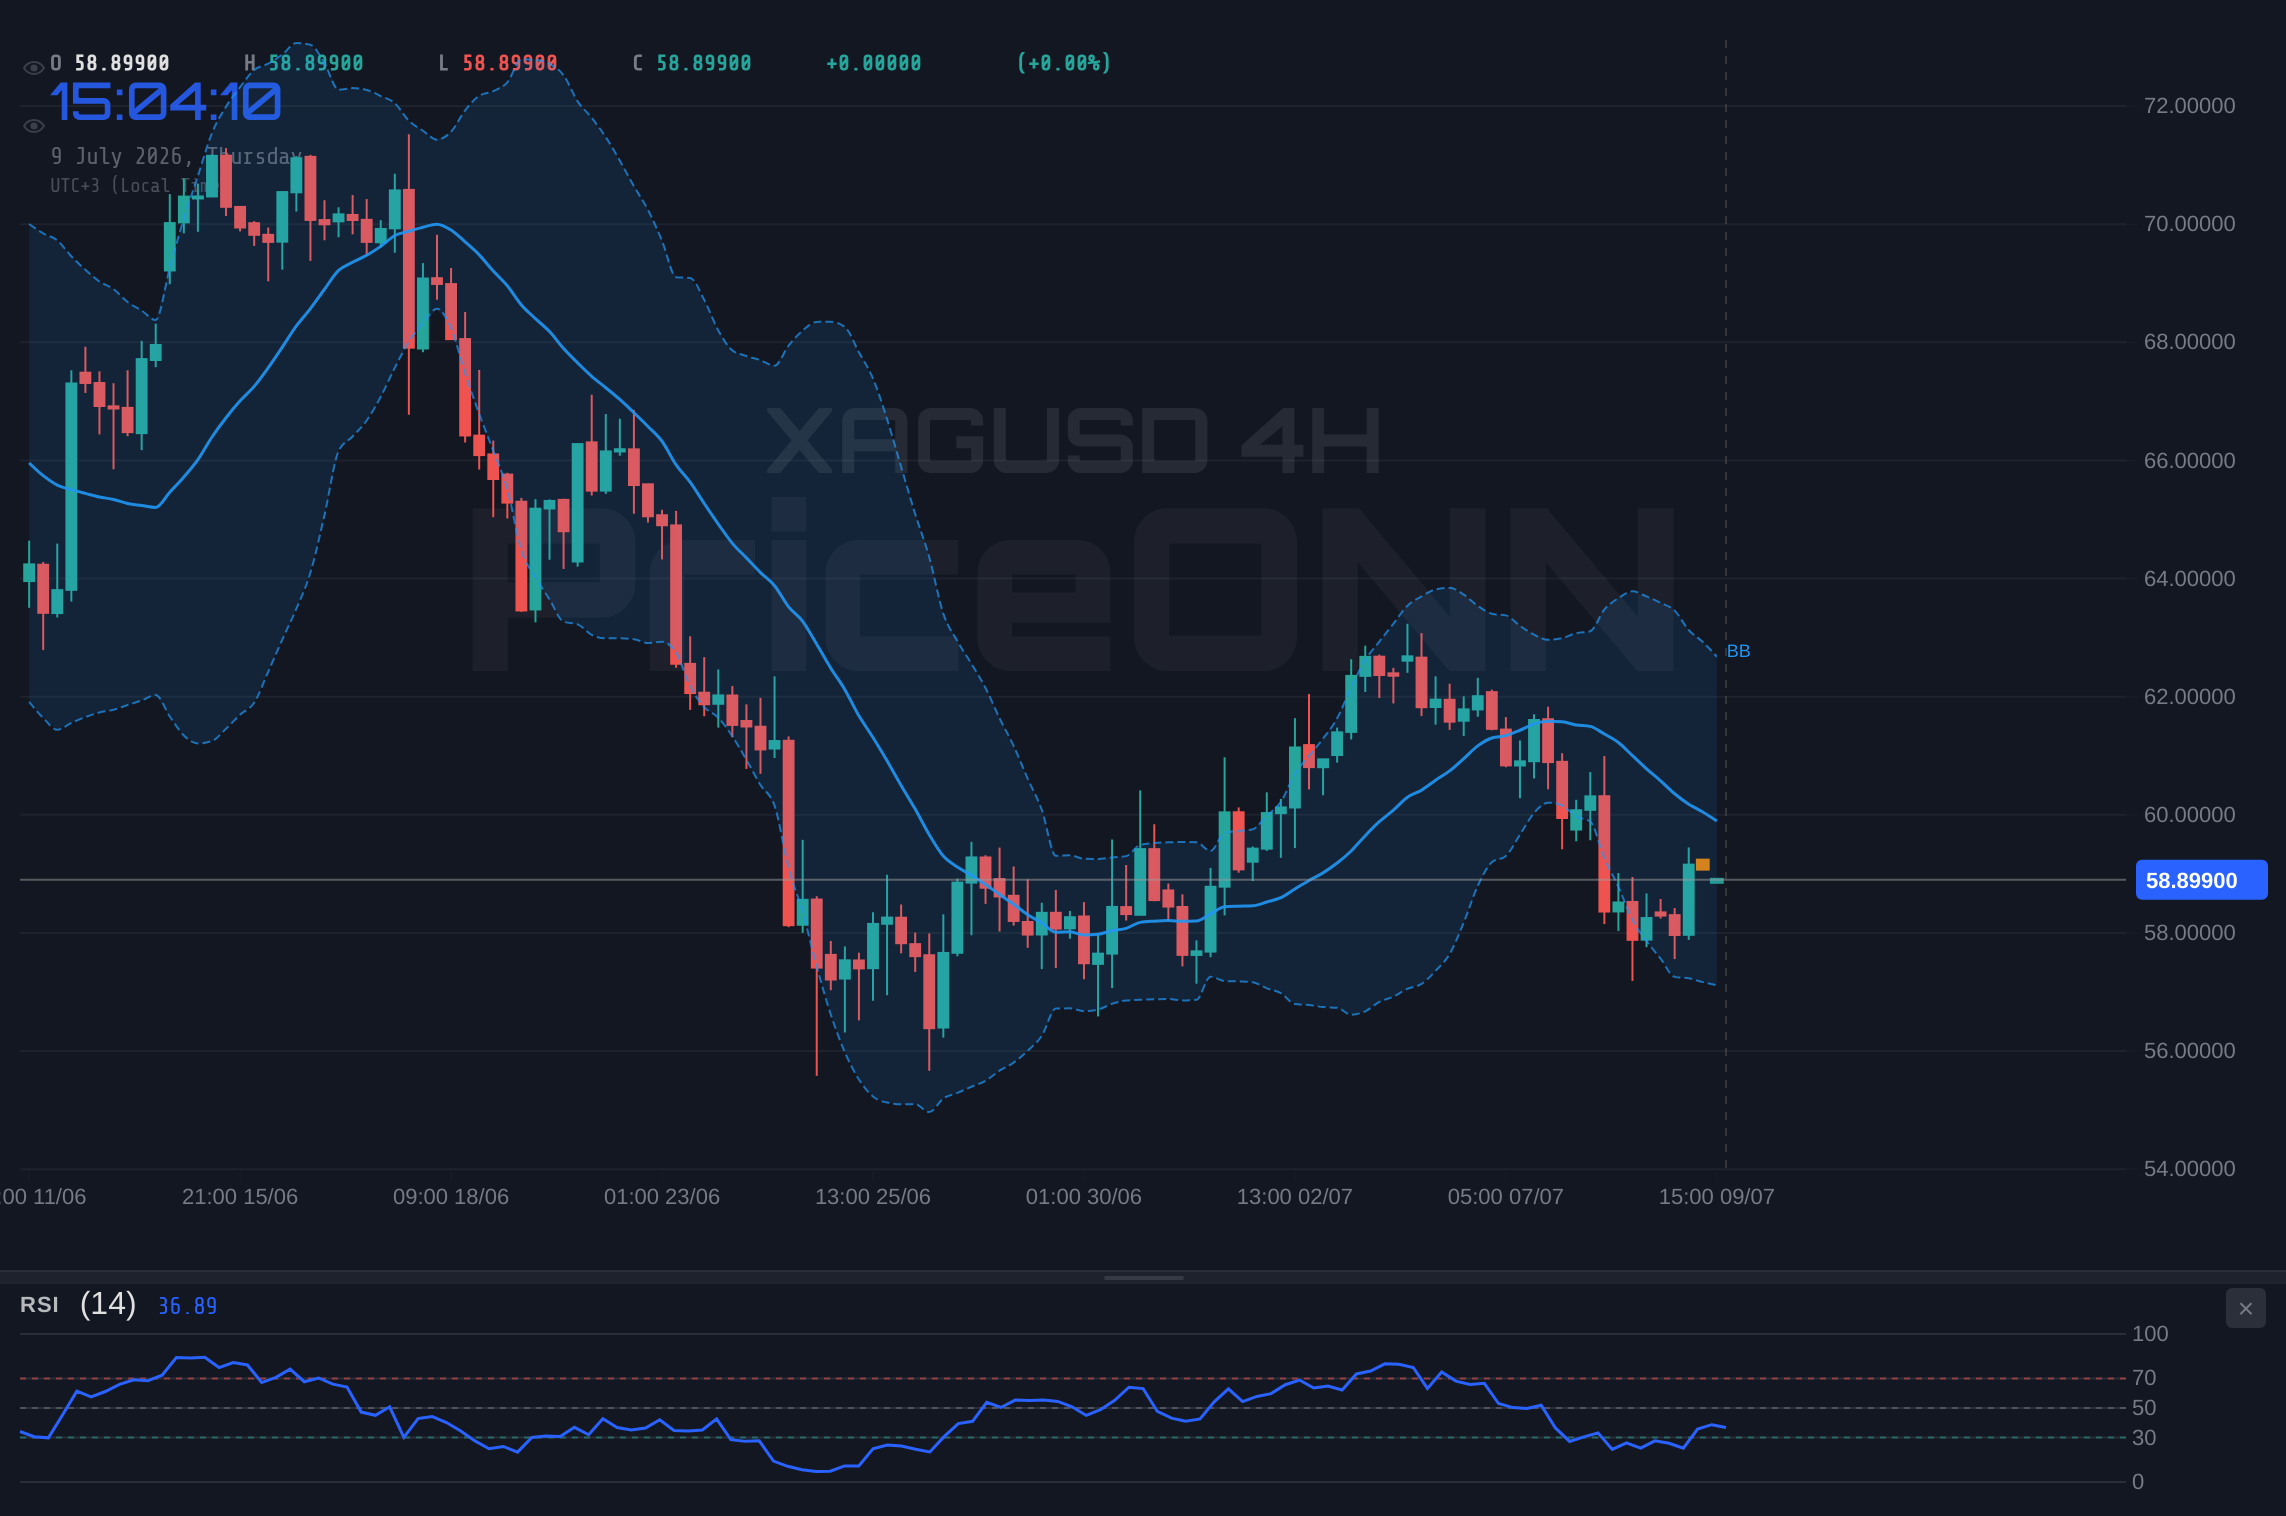
Looking at the 4-hour chart, the picture becomes a bit more complex, and frankly, more intriguing. Here, the ADX at 25.12 suggests a moderately strong trend, but the RSI is at 44.06, leaning towards bearish. The MACD shows negative momentum, and the Bollinger Bands are hugging the middle band, hinting at a potential consolidation or reversal. Yet, the Stochastic Oscillator here is bullish, with %K above %D. This internal conflict on the 4-hour chart is a trader's playground if they approach it with a defined strategy. It highlights a market that’s trying to make up its mind, and the $59.00 level is acting as a key pivot point in this indecision.
The Battle for $59.00: What the Indicators Are Saying
The current price of $59.00 for XAGUSD is pivotal. On the 1-hour chart, the trend strength is neutral (ADX: 21.15), but the overall signal leans towards BUY (7 Buy, 1 Sell). This is driven by a RSI at 59.2 and positive MACD momentum. However, the Stochastic Oscillator’s %K
In contrast, the 4-hour timeframe shows a neutral trend (ADX: 22.86) but an overall SELL signal (5 Sell, 3 Buy). The RSI at 44.06 and negative MACD momentum point downwards. The Stochastic Oscillator, however, is in a bullish phase (%K > %D). This conflict is key. If price action fails to decisively break through the $59.09 (1H) resistance and instead falters, we could see a move back towards the 4H support levels. The immediate 4H support is at $58.41, followed by $57.54. A close below $58.61 on the 1-hour chart would be the first indication that the bears are gaining traction and might be eyeing these lower levels. The market's reaction to $59.00 is the immediate focus.
The daily chart adds another layer to this complex narrative. With an ADX of 37.65, the trend is clearly defined as strong, and the signal is overwhelmingly SELL (1 Buy, 7 Sell). The RSI at 43.5 and the MACD histogram below the signal line both reinforce a bearish outlook on the daily scale. The Bollinger Bands are also below the middle band, indicating downward pressure. However, the Stochastic Oscillator is showing a potential buy signal (%K > %D). This stark contrast between the strong daily downtrend signal and the short-term indicators, particularly around the $59.00 mark, creates significant uncertainty. It suggests that while the longer-term trend might be bearish, the current price action is in a critical battle zone where short-term sentiment could override the daily picture temporarily.
Intermarket Analysis: Gold, Dollar, and Equities
Understanding XAGUSD's movements also requires looking beyond the silver chart itself. The DXY (Dollar Index) is currently trading around 100.98, showing a slight downtrend on the 1H and 4H charts but a strong uptrend on the daily. Historically, a strengthening dollar often puts pressure on precious metals like silver. If the dollar index continues to slide from its intraday highs, it could provide some tailwind for XAGUSD, helping it push past the $59.09 resistance. Conversely, any sign of dollar strength, especially if it breaks back above the 101.00 level, would likely add headwinds for silver.
Equities, represented by the SP500 and Nasdaq100, are showing a mixed but generally positive picture on the shorter timeframes. The SP500 is up 0.74% and Nasdaq100 by 1.06% in early trading. This risk-on sentiment could, in theory, dampen demand for safe-haven assets like silver. However, the correlation isn't always direct, especially when inflation fears or specific commodity-driven narratives take hold. The fact that silver is showing resilience near resistance despite a generally positive risk appetite suggests that underlying demand for the metal might be stronger than typical risk-on correlations would imply. It's a subtle but important nuance for traders to consider.
Recent news flow also provides context. Reports suggest that gold (XAUUSD) recoveries are likely to be capped as its 20-day EMA slopes lower, trading near $4,110. This could indirectly influence silver, as the two metals often move in tandem. Furthermore, news from July 9th mentioned that "Gold and Silver Bears Need One More Trigger: Brent Above $80." While Brent crude is currently trading around $78.35, below that $80 threshold, any significant move higher in oil prices could reignite inflation concerns, potentially boosting precious metals. The narrative around inflation and central bank policy remains a crucial backdrop, even if immediate price action is driven by technical levels.
Navigating the $59.00 Conundrum: Scenarios and Strategy
Given the conflicting signals across timeframes and indicators, a clear, scenario-based approach is essential for trading XAGUSD around the $59.00 level. The market is currently in a state of flux, and predicting the next move with certainty is a fool's errand. Instead, we must prepare for multiple outcomes and define our entry, exit, and risk management strategies for each. The ADX readings provide a clue: while it's weak on the 1H and 4H, it's strong on the daily. This suggests that the current price action might be a temporary consolidation before a more significant trend emerges, or it could be a battleground where short-term momentum clashes with longer-term sentiment.
The current technical setup on the 4-hour chart, with its mix of bearish RSI and MACD momentum alongside a bullish Stochastic, is particularly noteworthy. It highlights a potential conflict zone where volatility could increase. The key is to watch how price reacts to the immediate resistance at $59.09 and support at $58.61 on the 1-hour timeframe. A failure to break higher could lead to a test of the 4-hour support levels, while a decisive move above $59.09 might signal a continuation towards higher resistance targets. The ADX at 25.12 on the 4H chart indicates that a trend is present, but its strength is moderate, meaning breakouts could be volatile and require careful management.
The daily chart's strong SELL signal (ADX 37.65, RSI 43.5) cannot be ignored. It suggests that any upward moves might be temporary corrections within a larger downtrend. Therefore, while we identify potential bullish setups on shorter timeframes, the overarching daily context warrants caution. This means that any long positions should have tight stops, and traders should be prepared for a swift reversal if the daily bearish sentiment reasserts itself. The probability of a sustained move higher is likely lower than a move lower from current levels, given the daily timeframe's disposition.
Bearish Scenario: Testing Lower Support
65% ProbabilityNeutral Scenario: Consolidation Around $59.00
25% ProbabilityBullish Scenario: Breaking Resistance
10% ProbabilityFrequently Asked Questions: XAGUSD Analysis
What happens if XAGUSD fails to break above $59.09 resistance?
If XAGUSD fails to decisively break and hold above the $59.09 resistance level, particularly with bearish signals from the Stochastic Oscillator on the 1-hour chart, the probability of a move lower increases significantly. This could lead to a test of the immediate 1-hour support at $58.61, and potentially a deeper decline towards the 4-hour support zone starting at $57.54.
Is the current RSI reading of 52.8 a buy signal for XAGUSD at $59.00?
An RSI of 52.8 on the 1-hour chart is generally considered neutral, leaning slightly bullish, but it's not a standalone buy signal, especially when considering conflicting indicators like the Stochastic Oscillator. While it suggests some upward momentum, traders should wait for confirmation, such as a break above resistance or a bullish divergence, rather than relying solely on the RSI value.
How does the ADX reading of 39.18 on the daily chart impact the XAGUSD outlook?
The strong ADX of 39.18 on the daily chart indicates a well-established trend, currently pointing towards a bearish sentiment with a SELL signal dominating the daily timeframe. This suggests that while shorter timeframes might offer trading opportunities, any upward moves could be counter-trend rallies within a larger potential downtrend, warranting caution for bullish positions.
How will the current DXY levels around 100.98 affect XAGUSD trading near $59.00?
The DXY's current position around 100.98, showing mixed signals across timeframes, creates an uncertain environment for XAGUSD. A continued slide in the dollar index could provide support for silver, helping it push higher, while any strengthening of the dollar could add pressure on XAGUSD, potentially contributing to a rejection from the $59.00 resistance level.
Track markets in real-time
AI-powered analysis, technical indicators and real-time price data.
Join Our Telegram Channel
Breaking market news, AI analysis and trading signals instantly.
Join Channel