

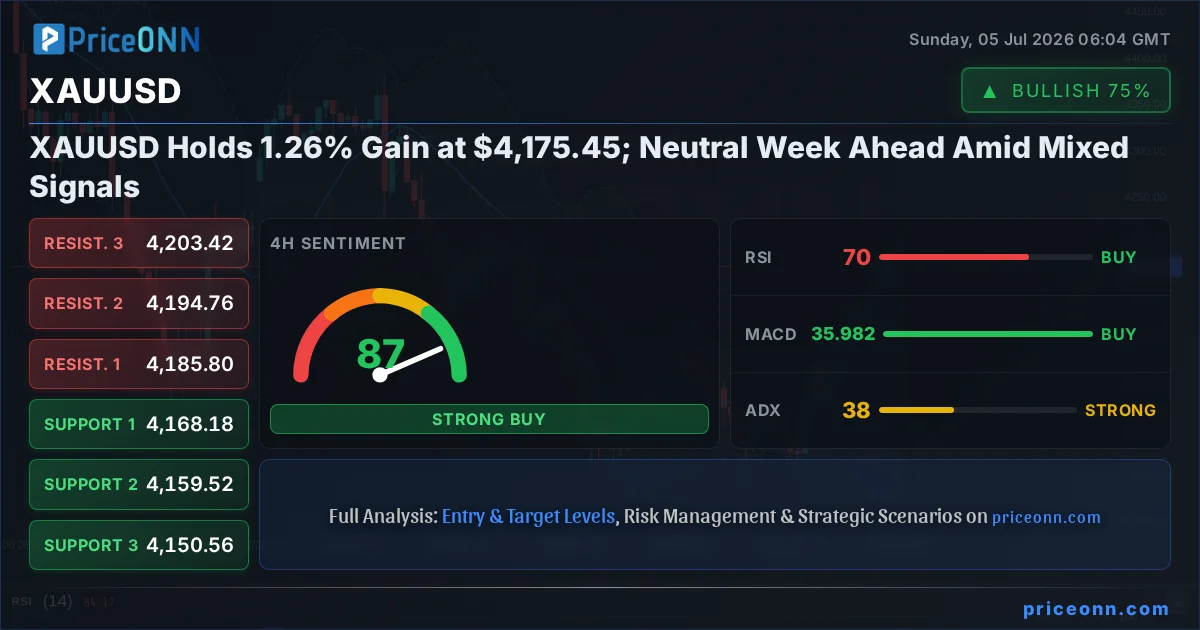
The yellow metal, XAUUSD, has managed to hold onto a significant 1.26% gain, currently trading around the $4,175.45 mark as the market digests a week of fluctuating sentiment and prepares for a potentially neutral trading environment in the upcoming week. After a volatile period, the precious metal has found a temporary footing, but the confluence of mixed technical signals across different timeframes presents a complex picture for traders. While the 4-hour chart still flashes a strong bullish trend, the daily indicators are painting a more cautious, even bearish, picture, highlighting the critical need for traders to navigate this period with precision and a clear understanding of the key levels that will dictate the next significant move. The current price of $4,175.45 is a crucial point, sitting just below the immediate resistance level and above the short-term support, making it a pivotal zone for market direction.
- RSI at 62.42 on the 1H chart signals neutral momentum, but the daily RSI at 46.83 indicates a potential downward bias.
- The immediate resistance for XAUUSD is identified at $4,171.19, with a decisive break needed to confirm further upside.
- Key support is holding firm at $4,161.33, a level that has been tested and maintained, preventing a sharper decline.
- The US Dollar Index (DXY) at 100.82 is showing a slight downward trend, which typically supports gold prices, but the overall correlation remains dynamic.
The past week has been a testament to the intricate dance between macroeconomic expectations and market reactions, particularly for gold. While a notable 1.26% jump, adding $51.89 to its value, has been consolidated around the $4,175.45 level, the underlying technical structure reveals a market at a crossroads. The 1-hour chart displays a neutral trend with a strong 50% power rating, indicating indecision among short-term traders. However, the immediate support at $4,161.33 and resistance at $4,171.19 define a tight range that is currently holding price action. This suggests that while the immediate sentiment might be consolidating, the underlying forces are still at play, and any deviation from this narrow band could trigger significant price discovery. The daily analysis, however, introduces a layer of caution, with an RSI of 46.83 hinting at a potential downward pressure, even as the MACD shows positive momentum. This divergence in signals across timeframes is precisely why a neutral outlook for the upcoming week seems most probable, demanding a keen eye on confirmation.
Delving deeper into the technical landscape, the 4-hour timeframe paints a more bullish picture, with a strong 94% trend power and ADX at 37.61 reinforcing a robust uptrend. This timeframe shows support at $4,168.18 and resistance at $4,185.80. The RSI here is at 69.55, nearing overbought territory but still indicative of bullish momentum. Stochastic oscillators are in the overbought zone, suggesting a potential pullback, yet the overall signal remains 'BUY'. This dichotomy between the short-term neutral stance and the medium-term bullish trend is a classic sign of a market consolidating before its next major move. Traders are likely waiting for a clearer signal, perhaps from upcoming economic data or a decisive break of these key levels, to commit to a new direction. The current price of $4,175.45 is nestled precisely within this zone of uncertainty, making it a critical juncture where short-term profit-taking might meet longer-term buying interest.
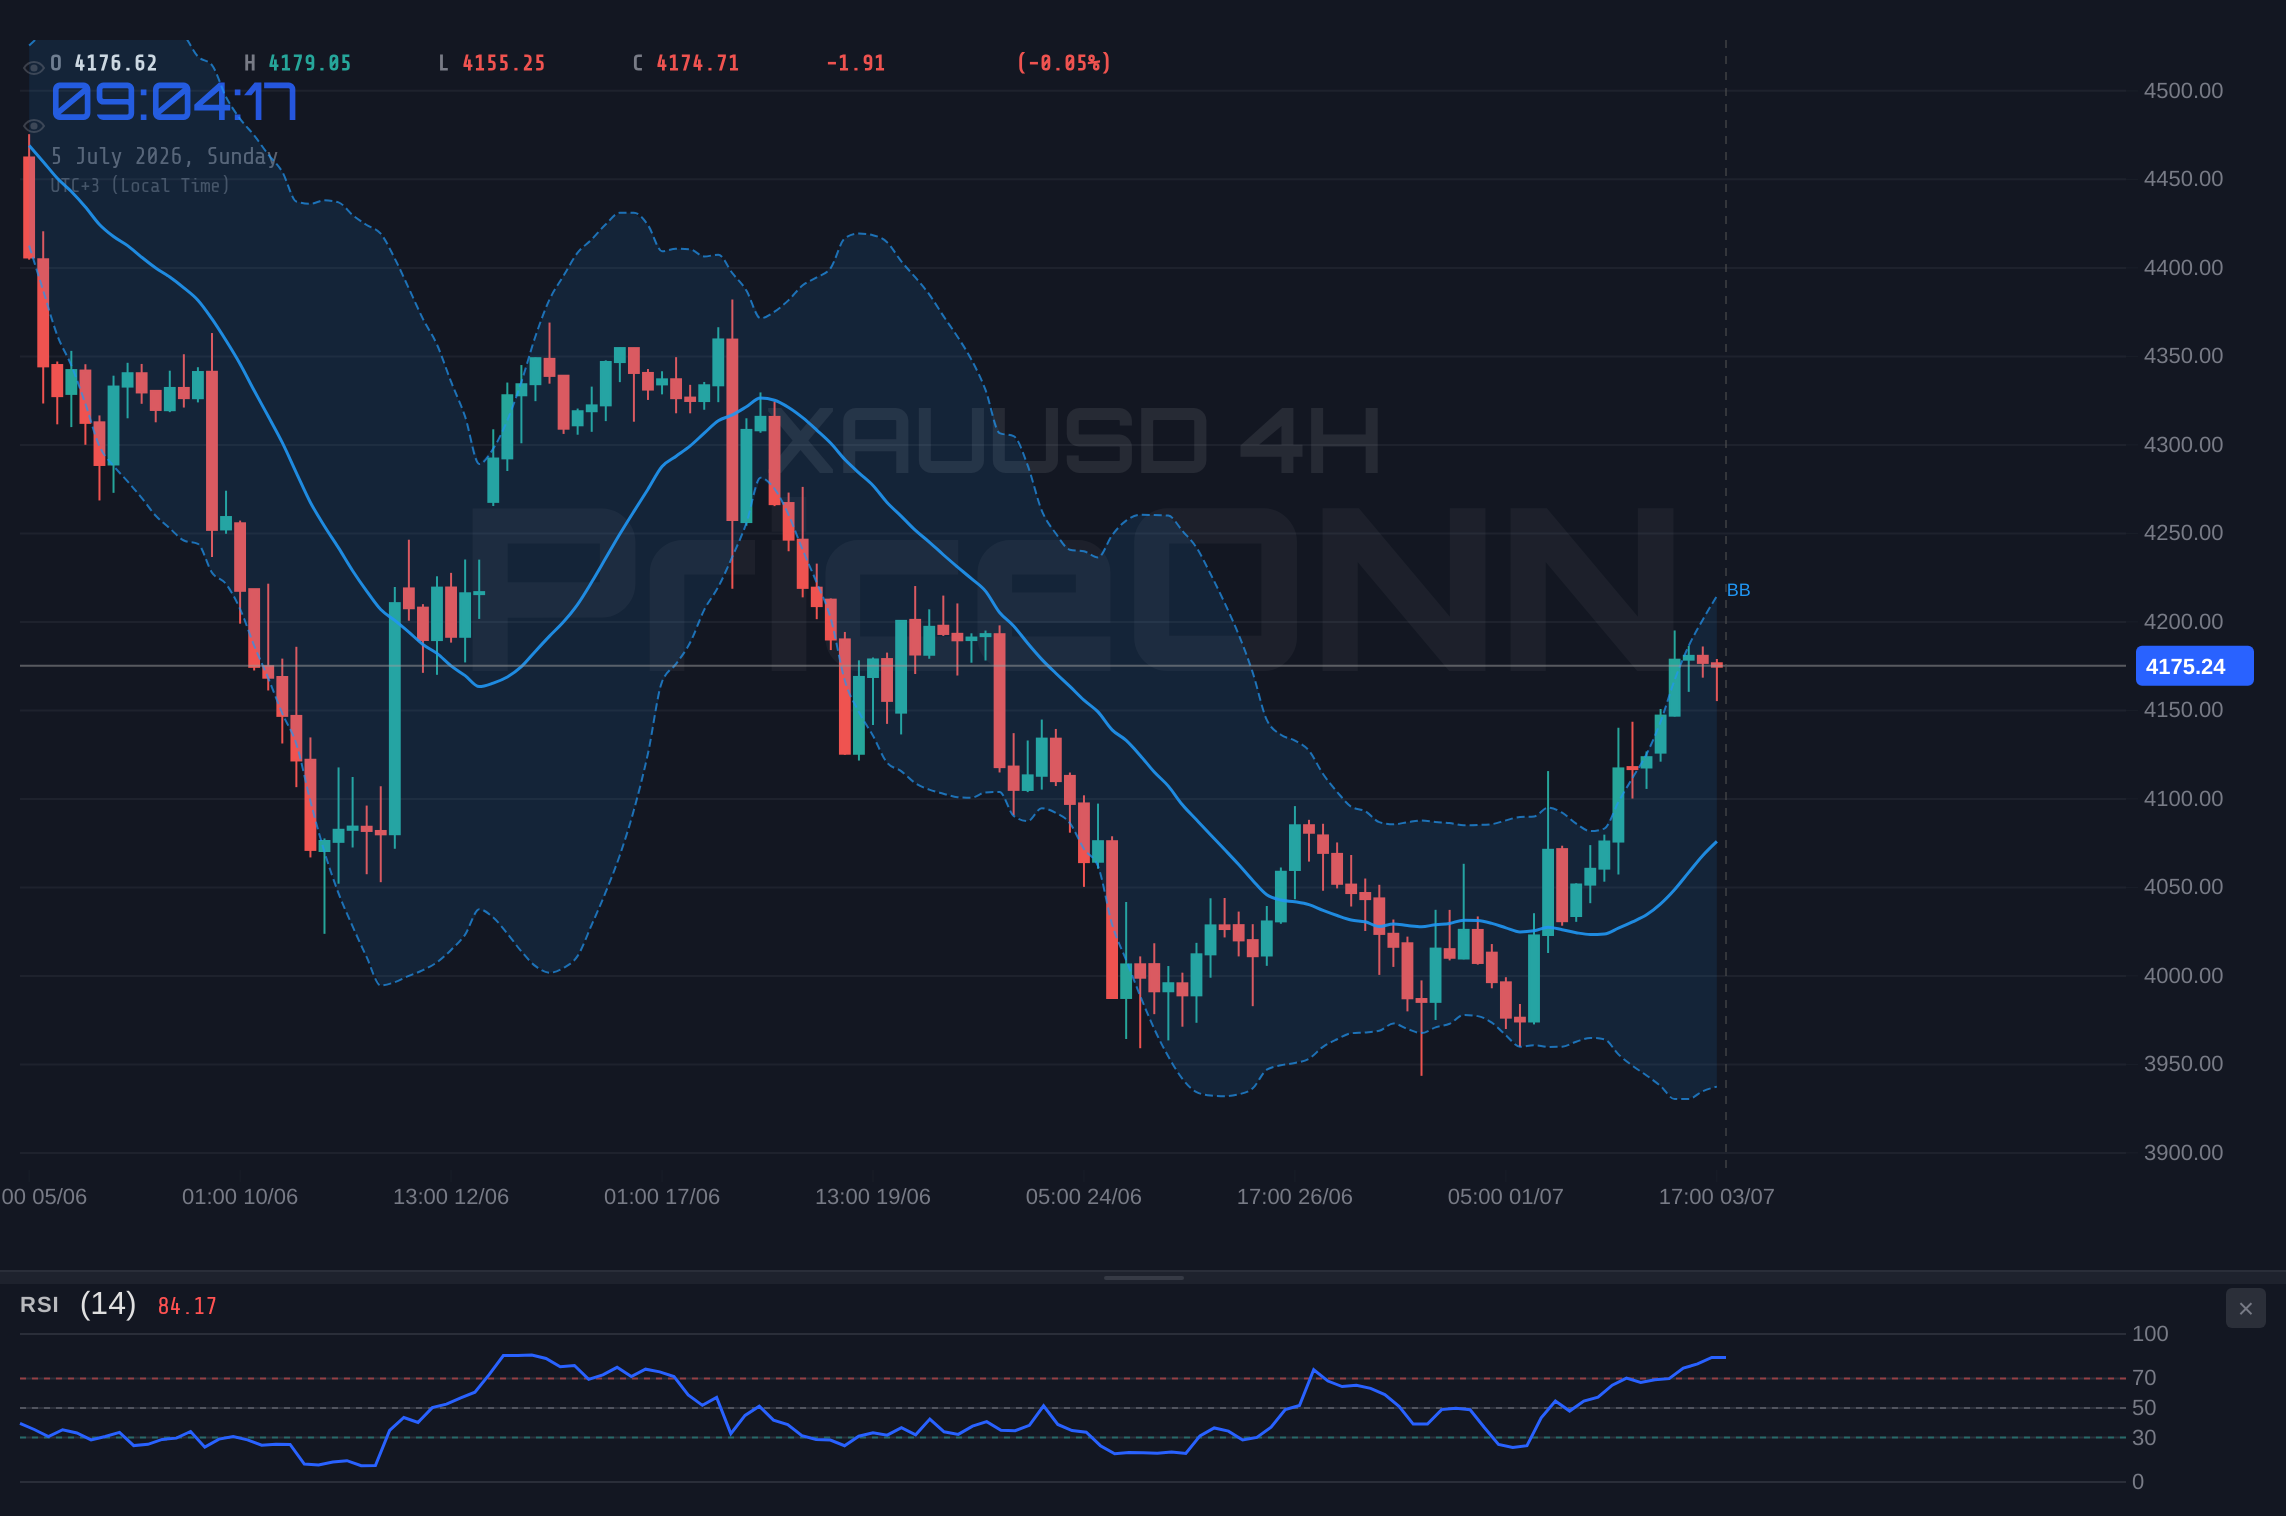
The daily chart, however, introduces a significant counterpoint to the bullish narrative observed on the 4-hour timeframe. Here, the trend is classified as neutral with only 50% power, and the RSI reading of 46.83 suggests a bearish inclination, a stark contrast to the higher timeframes. The ADX at 40.35, while indicating a strong trend, is paradoxically associated with a 'downward' trend on this daily perspective, a common occurrence during periods of significant volatility where trend strength indicators can lag or misinterpret shifts. Support levels on the daily chart are much further down, at $4,054.87, $3,986.19, and $3,941.83, implying substantial room for decline should bearish forces gain traction. Resistance is seen at $4,167.91, $4,212.27, and $4,280.95. The MACD, while showing positive momentum, is still below its signal line on the daily chart, adding to the mixed signals. This daily perspective suggests that the recent rally might be losing steam, and a deeper correction is a plausible scenario if key daily support levels are breached. The current price of $4,175.45 is hovering just below the daily resistance, making this area a battleground between the bulls trying to extend the rally and the bears looking to capitalize on potential exhaustion.
Correlating XAUUSD's movements with the broader market context reveals a dynamic interplay of factors. The US Dollar Index (DXY), currently at 100.82 and showing a slight downward trend on the 1-hour chart, typically provides a tailwind for gold. A weaker dollar generally makes gold cheaper for holders of other currencies, thus increasing demand. However, the DXY’s daily chart shows a different story, with a strong upward trend (ADX: 39.37) and an RSI of 57.43, indicating potential for dollar strength ahead. This divergence in DXY trends across timeframes mirrors the complexity seen in gold itself. Similarly, equity markets, represented by the SP500 and Nasdaq, are showing mixed signals. The SP500's 1-hour chart is bullish, but the daily chart shows a strong downtrend (ADX: 47.51). The Nasdaq 100, while showing a neutral 1-hour trend, also exhibits a bearish bias on its 4-hour chart. This broader risk-off sentiment, suggested by the daily equity trends, could theoretically bolster safe-haven assets like gold. Yet, the conflicting signals mean that these correlations are not providing a clear directional bias for gold at $4,175.45, emphasizing the need to monitor these indices closely for confirmation.
The energy sector, particularly Brent crude oil at $71.89 and WTI at $69.02, plays a significant role as an inflation barometer. Both commodities are showing a slight upward bias on their 1-hour charts, but their daily charts present a strong bearish trend. Brent's daily RSI is deep in oversold territory at 26.85, suggesting a potential bounce, while WTI's RSI is at 28.27. If oil prices were to fall further, it could signal easing inflation expectations, potentially reducing the urgency for central banks to maintain hawkish policies, which could, in turn, be supportive of gold. Conversely, any geopolitical tensions in the Middle East, which could drive oil prices higher, might also increase safe-haven demand for gold. The current price of $4,175.45 for gold is thus influenced by a complex web of correlated assets, each displaying its own set of conflicting signals, making a clear directional call challenging without further catalysts.
Analyzing the short-term 1-hour technicals for XAUUSD reveals a market in consolidation, hovering around $4,175.45. The RSI at 62.42 is in neutral territory, suggesting neither extreme buying nor selling pressure. The MACD is currently showing negative momentum, with the MACD line below the signal line, which typically indicates bearish pressure, although this can be fleeting in a consolidating market. The Bollinger Bands show the price above the middle band, hinting at a bullish inclination, but the Stochastic oscillator (K=47.22, D=50.7) is flashing a bearish signal, with the %K line below the %D line, suggesting potential downside from current levels. The ADX at 38.5 indicates a strong trend, but the conflicting MACD and Stochastic signals temper this, suggesting the current trend might be losing conviction. The overall signal aggregation leans towards 'BUY' (6 buys, 2 sells), but the nuances suggest caution is warranted. Immediate support at $4,161.33 and resistance at $4,171.19 are the key levels to watch in this timeframe.
Moving to the 4-hour timeframe provides a more robust bullish outlook for XAUUSD. The trend is firmly identified as bullish with a high power of 94%, supported by an ADX of 37.61. The RSI at 69.55 is approaching overbought conditions, but still within a zone that has historically supported further upward movement in strong trends. The MACD is positively aligned, with the MACD line above the signal line, confirming bullish momentum. The Stochastic oscillators are in the overbought region (K=88.51, D=90.14), which often precedes a pullback, but in a strong trend, these can remain elevated for extended periods. The Bollinger Bands are showing price above the middle band, aligning with the bullish trend. The overall signal is a strong 'BUY' (6 buys, 2 sells). Key levels to monitor on this timeframe are support at $4,168.18 and resistance at $4,185.80. The price at $4,175.45 is currently trading within this range, but the strong trend indicators suggest a bias towards testing the upper bounds.
The daily chart, however, presents a different narrative, classifying the trend as neutral with 50% power and an ADX of 40.35. This signifies a strong underlying trend, but its direction is unclear on this timeframe. The RSI at 46.83 is below 50, indicating a bearish bias, and the MACD, while showing positive momentum, is below its signal line. The Stochastic is showing a bullish signal (%K > %D) with K at 62.59, but this needs to be viewed in context of the overall daily trend which appears to be struggling. The Bollinger Bands are showing price above the middle band, suggesting some bullishness, but this is in conflict with the RSI and MACD signals. The 'NEUTRAL' signal aggregation (4 buys, 4 sells) reflects this indecision. Key daily support levels are significantly lower at $4,054.87, $3,986.19, and $3,941.83, while resistance is seen at $4,167.91, $4,212.27, and $4,280.95. The current price of $4,175.45 is sitting just below the first daily resistance level, making this an area of significant contention. A failure to break convincingly above $4,167.91 could signal a move towards the lower support levels.
The recent news flow, particularly concerning central bank policies and geopolitical events, adds another layer of complexity to the XAUUSD outlook. Reports suggesting that the Fed might be nearing the end of its rate-hiking cycle, as indicated by softer economic data and easing inflation concerns, have generally been supportive of gold. However, the market's reaction is often nuanced. While lower rates can decrease the opportunity cost of holding non-yielding assets like gold, persistent inflation fears or unexpected geopolitical escalations can simultaneously drive safe-haven demand. The recent subtle shifts in DXY momentum and the mixed performance of equity indices reflect this ongoing uncertainty. Geopolitical tensions in the Middle East, while potentially supportive of gold as a safe haven, have not yet reached a fever pitch that would trigger a massive flight to quality, especially with oil prices showing a bearish trend on their daily charts. The upcoming release of the FOMC meeting minutes, mentioned in the economic calendar, will be crucial for deciphering the Fed's current stance and providing a clearer direction for gold.
Given the conflicting signals across different timeframes and the broader market uncertainty, a neutral scenario appears to be the most probable for XAUUSD in the immediate future, with a strong bias still present on the 4-hour chart. The price is currently consolidating around $4,175.45, caught between the immediate resistance at $4,171.19 and support at $4,161.33 on the 1-hour chart. A break above $4,171.19, especially with increasing volume and positive confirmation from daily indicators, could signal a move towards the $4,177.61 and potentially $4,181.05 resistance levels. Conversely, a breach below $4,161.33 could initiate a sell-off towards the $4,157.89 and $4,151.47 support levels. The daily chart’s bearish lean suggests that upside might be capped, and a decisive break below the $4,167.91 daily resistance could open the door for a more significant pullback towards the $4,054.87 support. Traders should remain vigilant, as this consolidation phase often precedes a more significant price move, and confirmation from multiple indicators and price action will be paramount.
Bearish Scenario: Consolidation Below Resistance
60% ProbabilityNeutral Scenario: Range-Bound Trading
30% ProbabilityBullish Scenario: Breakout Above Daily Resistance
10% ProbabilityThe ADX indicator on the daily chart at 40.35 signifies a strong trend, but its direction is ambiguous given the conflicting signals from RSI and MACD. This strength in trend, however, could mean that once a direction is established, the move could be significant. The historical performance of gold also suggests that periods of consolidation around key resistance levels, especially when influenced by mixed macroeconomic signals, often precede a sharp move. The resilience shown by gold in holding its gains above $4,161.33 is noteworthy, but the failure to decisively break through $4,171.19 on the 1H chart and $4,167.91 on the daily chart suggests that the path of least resistance might currently be downwards, or at best, sideways.
The interplay between gold and the US Dollar Index (DXY) is a critical component of the XAUUSD analysis. With the DXY showing a slight dip on the 1H chart (100.82) but a strong upward trend on the daily chart (ADX: 39.37), this presents a conflicting outlook for gold. Traditionally, a weaker dollar boosts gold, while a stronger dollar weighs on it. The current price action around $4,175.45 suggests that the market is not yet convinced about a sustained dollar decline, or that other factors are currently overriding the dollar’s influence. The upcoming FOMC minutes will be a key event to watch, as any hints about future interest rate policy could significantly impact both the dollar and gold. If the minutes reveal a more dovish stance than anticipated, it could weaken the dollar and provide a strong tailwind for XAUUSD, potentially pushing it towards the $4,185.80 resistance and beyond. Conversely, a hawkish tone could strengthen the dollar, putting pressure on gold and testing the $4,161.33 support.
Furthermore, the performance of major equity indices like the SP500 and Nasdaq provides context for risk appetite. The SP500's daily chart shows a strong downtrend (ADX: 47.51), suggesting a risk-off environment, which typically benefits safe-haven assets like gold. However, the 1-hour chart for SP500 is bullish, indicating a potential short-term recovery or consolidation. This mixed signal from equities suggests that while underlying concerns might persist, immediate sentiment is not uniformly bearish. The Nasdaq 100's neutral 1-hour trend and bearish 4-hour trend add to this complexity. In such an environment, gold's role as a safe haven is amplified, but its price action is also constrained by its own technical picture and the broader macroeconomic narrative. The current price of $4,175.45 is thus navigating a complex landscape where conflicting signals from equities and the dollar create uncertainty.
Examining the commodity markets, particularly Brent and WTI crude oil, offers insights into inflation expectations. Both benchmarks are exhibiting bearish trends on their daily charts, with RSI deep in oversold territory. A sustained decline in oil prices could signal cooling inflation, potentially easing pressure on central banks to raise rates, which is generally positive for gold. However, geopolitical risks in the Middle East remain a wildcard. Any escalation could lead to a surge in oil prices and, consequently, a flight to safety in gold. The current price consolidation of XAUUSD around $4,175.45 suggests that these inflation and geopolitical risks are currently balanced, but any shift in these underlying factors could quickly alter the market's direction. The lack of a clear inflationary push from oil prices currently limits one of the traditional drivers for gold’s upward momentum.
The Stochastic oscillator on the 1-hour chart (K=47.22, D=50.7) is providing a bearish signal, indicating that the recent upward momentum might be fading, and a move towards the $4,161.33 support is possible. The MACD histogram, while showing negative momentum, is not yet deeply negative, suggesting that the selling pressure is not overwhelming. This reinforces the idea of consolidation rather than a sharp sell-off. On the 4-hour chart, the Stochastic is in overbought territory (K=88.51, D=90.14), which often signals an impending correction. However, the strong bullish trend indicated by the ADX (37.61) and the overall 'BUY' signal aggregation on this timeframe suggests that any pullback might be shallow and short-lived, potentially offering buying opportunities for those with a medium-term horizon. The price at $4,175.45 is caught between these conflicting short-term and medium-term signals.
The daily chart’s technical indicators present a more cautious outlook, which is crucial for understanding the longer-term potential of XAUUSD. The RSI at 46.83, below the 50 level, suggests a bearish bias. The MACD, despite positive momentum, is below its signal line, indicating that the upward move might be struggling. The Stochastic, while showing a bullish crossover, is in the mid-range, providing a less decisive signal. The ADX at 40.35 confirms a strong trend, but the combination of these indicators points towards a potential downtrend on the daily timeframe. This daily bearish lean is a significant factor that could cap any upside moves originating from the shorter timeframes. Therefore, the key resistance level on the daily chart at $4,167.91 becomes extremely important. A failure to decisively break and hold above this level could lead to a retest of the lower support levels, starting with $4,054.87.
The key takeaway from this analysis is the significant divergence in signals across different timeframes. The 4-hour chart remains strongly bullish, while the 1-hour and daily charts present a more neutral to bearish picture. This suggests that XAUUSD is currently in a battleground zone, with short-term bullish momentum struggling against longer-term resistance and bearish indicators. The current price of $4,175.45 is a critical pivot point. A break above $4,171.19 on the 1-hour chart, and more importantly, above $4,167.91 on the daily chart, would be necessary to confirm a continuation of the bullish trend. However, failure to do so, especially with a close below $4,161.33 on the 1-hour chart, could trigger a sharp decline towards the $4,157.89 and $4,151.47 support levels. The upcoming FOMC minutes and any related shifts in DXY or equity market sentiment will likely be the catalysts that break this consolidation.
| Indicator | Value | Signal | Interpretation |
|---|---|---|---|
| RSI (1H) | 62.42 | Neutral | Approaching overbought, but not extreme. |
| RSI (4H) | 69.55 | Neutral | Nearing overbought territory; watch for pullbacks. |
| RSI (1D) | 46.83 | Bearish Bias | Below 50, suggesting downward pressure. |
| MACD (1H) | Neg Momentum | Bearish | MACD line below signal line. |
| MACD (4H) | Pos Momentum | Bullish | MACD line above signal line. |
| MACD (1D) | Pos Momentum | Neutral | Positive momentum, but below signal line. |
| ADX (1H) | 38.5 | Strong Trend | Indicates strong directional movement. |
| ADX (4H) | 37.61 | Strong Trend | Confirms robust uptrend. |
| ADX (1D) | 40.35 | Strong Trend | Strong trend, but direction unclear from other indicators. |
| Stochastic (1H) | K:47.22, D:50.7 | Bearish | %K below %D, suggesting downside. |
| Stochastic (4H) | K:88.51, D:90.14 | Bearish | Overbought, potential pullback imminent. |
| Stochastic (1D) | K:62.59, D:29.65 | Bullish | %K above %D, suggesting upside. |
Bearish Scenario: Daily Resistance Holds
65% ProbabilityNeutral Scenario: Consolidation Continues
25% ProbabilityBullish Scenario: Daily Breakout Confirmed
10% ProbabilityFrequently Asked Questions: XAUUSD Analysis
What happens if XAUUSD breaks below the $4,161.33 support level?
A break below the 1H support at $4,161.33 could trigger a move towards $4,157.89 and potentially $4,151.47. This would invalidate the short-term bullish bias and confirm the bearish leanings suggested by the daily RSI.
Should I buy XAUUSD at current levels around $4,175.45 given the mixed signals?
Buying at $4,175.45 requires caution due to conflicting signals across timeframes. A high-probability setup would involve waiting for a confirmed breakout above daily resistance at $4,167.91, or a bounce from the $4,161.33 support with bullish confirmation. Otherwise, a neutral range-bound strategy may be more prudent.
Is the daily RSI at 46.83 a sell signal for XAUUSD right now?
An RSI of 46.83 on the daily chart suggests a bearish bias, indicating that momentum is leaning downwards. While not an immediate sell signal on its own, it implies that upside potential may be limited and that the market could be vulnerable to further declines if key support levels are breached.
How will the upcoming FOMC minutes affect XAUUSD if they signal a hawkish stance?
A hawkish tone in the FOMC minutes would likely strengthen the US Dollar Index (DXY), potentially pressuring XAUUSD. This could lead to a test of the $4,161.33 support level and invalidate any immediate bullish scenarios, reinforcing the bearish leanings seen on the daily chart.
Track markets in real-time
AI-powered analysis, technical indicators and real-time price data.
Join Our Telegram Channel
Breaking market news, AI analysis and trading signals instantly.
Join Channel