

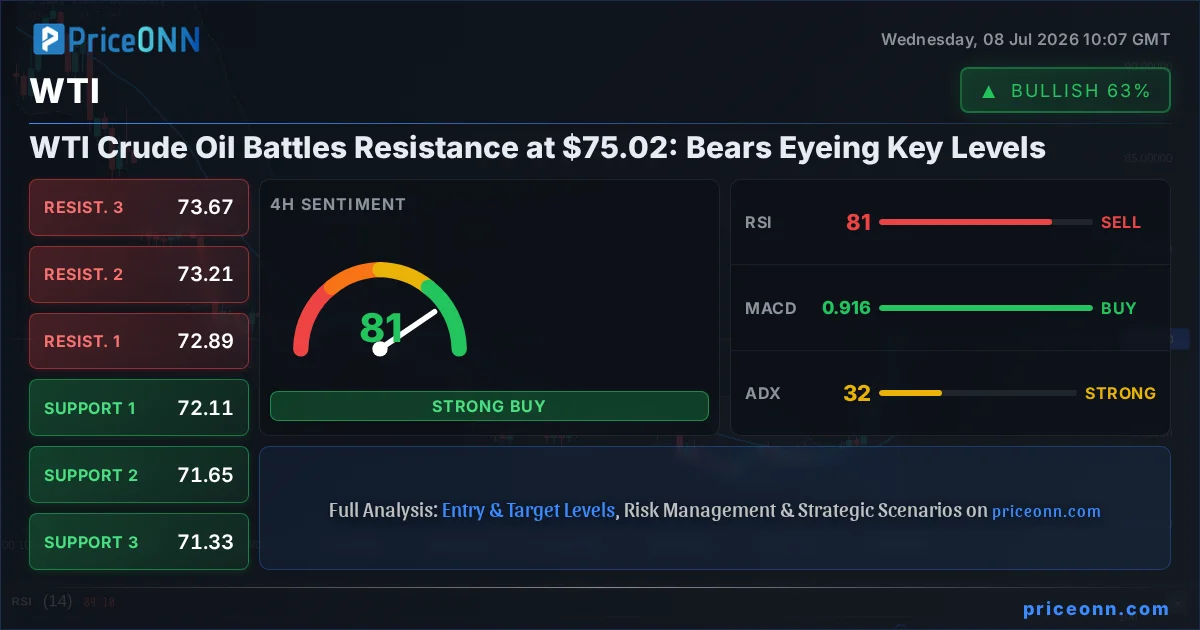
The relentless battle between bulls and bears is on full display in the WTI crude oil market today, with price action currently testing critical resistance around the $75.02 mark. This level represents a significant psychological and technical barrier, and its defense or breach will likely dictate the short-to-medium term trajectory for this vital energy commodity. As traders digest mixed signals from global demand outlooks, geopolitical tensions, and shifting central bank policies, the tug-of-war at $75.02 is shaping up to be a pivotal moment for WTI. Understanding the underlying forces at play, from technical indicators to broader economic drivers, is paramount for navigating this volatile landscape.
- WTI crude oil is currently trading at $75.02, facing strong resistance.
- The 1-hour chart shows a powerful downtrend (84% strength) with RSI at 36.21, indicating bearish momentum.
- Key support levels to watch are $73.11 and $71.11, while resistance is firmly at $76.13.
- The strong uptrend in DXY to 101.14 is likely pressuring WTI prices downwards.
- A break above $76.13 is needed for a bullish reversal, but current indicators suggest a continued downtrend is more probable.
The current market environment for WTI crude oil is characterized by a clear bearish sentiment on shorter timeframes, though the daily chart presents a more mixed picture. On the 1-hour chart, the trend strength is overwhelmingly bearish at 84%, with the price hovering around $75.02. The Relative Strength Index (RSI) at 36.21 clearly indicates that sellers are in control, far from any overbought conditions that might suggest a reversal. This bearish momentum is further reinforced by the MACD, which shows negative readings with the MACD line below its signal line, and Bollinger Bands sitting below the lower band, a classic sign of strong downward pressure or potential oversold conditions that could lead to a short-term bounce, but not a trend reversal.
The ADX indicator on the 1-hour timeframe stands at 18.32, suggesting a weak trend. However, this reading often accompanies significant price moves where momentum is strong but the trend itself hasn't fully consolidated. In this context, the ADX might be understating the conviction of the current downward move. The Stochastic Oscillator, with K at 36.05 and D at 64.88, also supports the bearish outlook, showing a clear downward signal as the K line is below the D line. Collectively, these indicators on the 1-hour timeframe paint a picture of a market under significant selling pressure, making the $75.02 resistance level a formidable hurdle for any potential recovery.
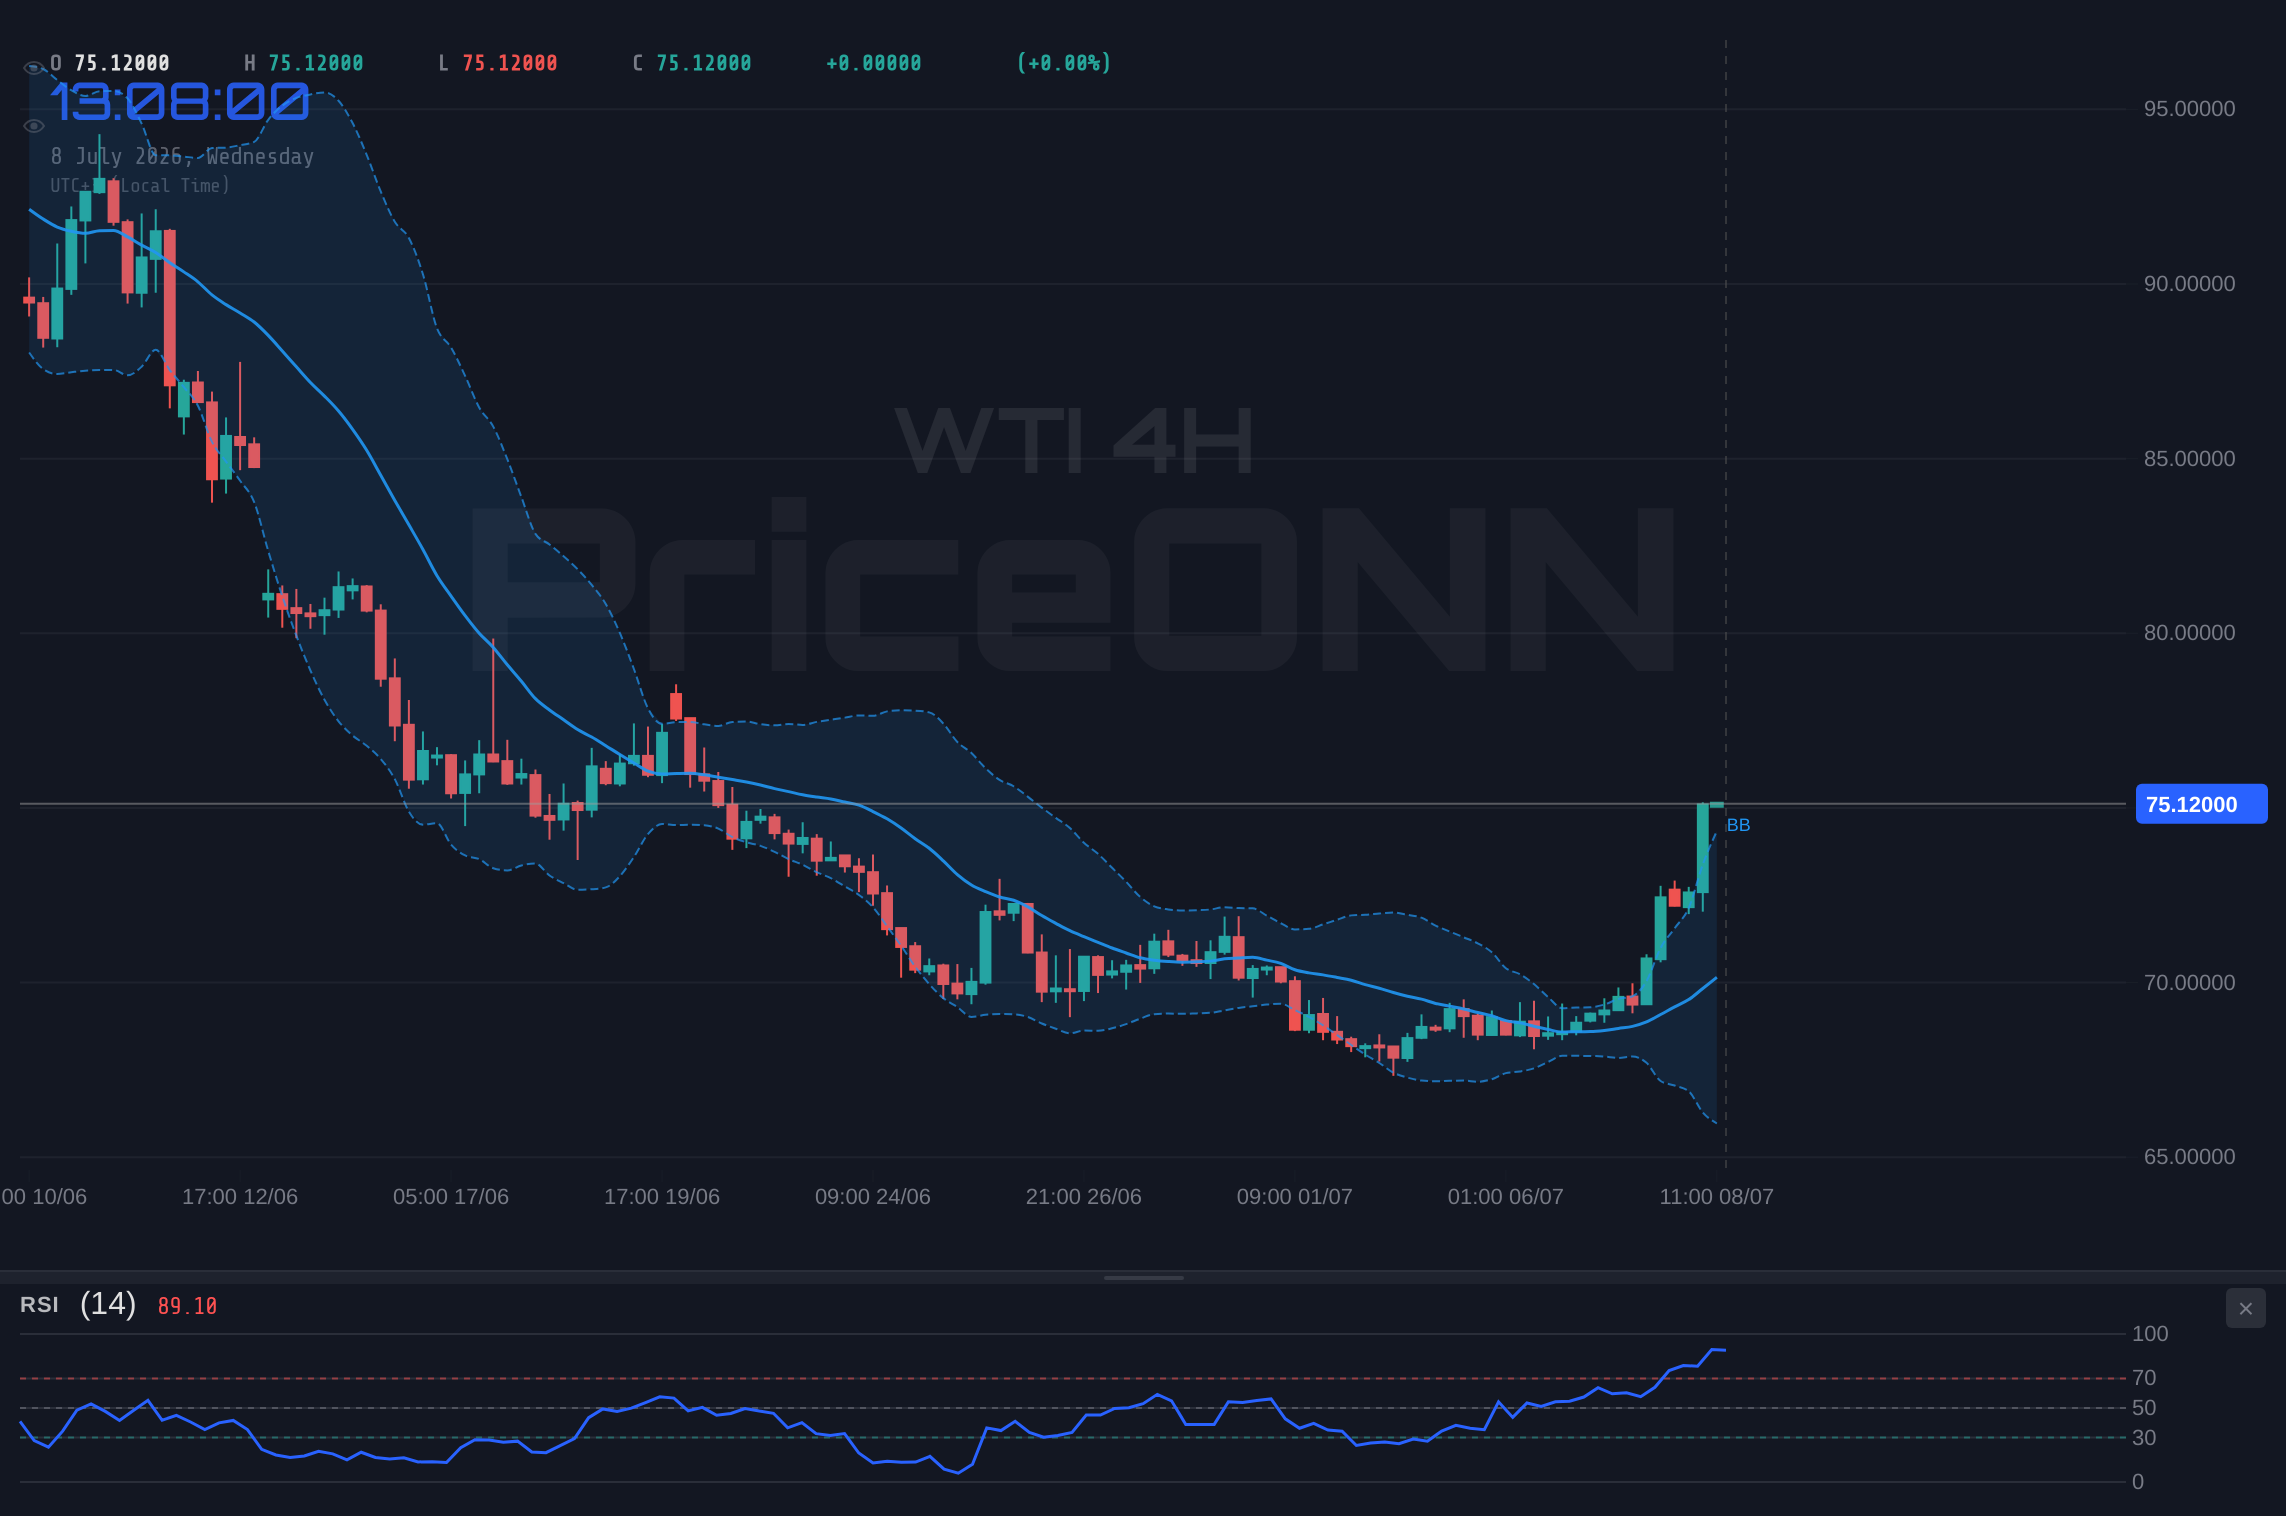
Shifting to the 4-hour timeframe, the picture remains predominantly bearish, though the trend strength is slightly less pronounced at 50%, indicating a more neutral stance in terms of trend consolidation. However, the overall signal across multiple timeframes leans heavily towards selling. The RSI here is at 42.91, still in neutral territory but trending downwards, suggesting that while the market isn't oversold, the buying interest is subdued. The MACD continues to show negative momentum, and the Bollinger Bands remain below the middle band, reinforcing the bearish bias. The Stochastic Oscillator (K=32.84, D=42.76) echoes the 1-hour chart's bearish signal.
The ADX on the 4-hour chart is 18.67, again pointing to a weak trend. This suggests that while a strong directional move is not currently being supported by trend strength indicators, the prevailing sentiment is still one of caution among buyers. The general signal across the 4-hour timeframe leans towards 'Sell'. This confluence of bearish indicators across both the 1-hour and 4-hour charts solidifies the view that the $75.02 resistance level is a significant point of contention. Any attempt by bulls to push prices higher will need to overcome not just the psychological barrier of $75.02 but also the technical headwinds that have been building.
On the daily chart, the narrative becomes more nuanced, reflecting the broader market's indecision. The trend strength is neutral at 50%, and the overall signal is still 'Sell', but with a slightly more balanced set of indicators. The RSI at 39.07 is in the neutral zone, showing no immediate overbought or oversold conditions, but it is trending downwards, consistent with the shorter timeframes. The MACD, however, shows positive momentum with the MACD line above its signal line, which is a divergence from the shorter timeframes and could suggest underlying strength or a potential for a bounce. The Bollinger Bands are below the middle band, indicating a bearish bias, but the Stochastic Oscillator (K=71.21, D=46.65) is showing a bullish signal, with the K line crossing above the D line and moving into overbought territory.
This divergence on the daily chart - particularly the positive MACD momentum and bullish Stochastic signal - contrasts sharply with the overwhelming bearish sentiment on the 1-hour and 4-hour charts. The ADX at 36.8 on the daily timeframe indicates a strong trend, but the directionality is unclear given the conflicting signals. This suggests that while a significant move might be brewing, the market is currently struggling to decide its direction. The strong ADX value here could be interpreted as the market being in a strong, albeit potentially choppy, trend that could reverse if key levels are breached. This daily picture adds a layer of complexity to the bearish outlook derived from shorter timeframes, hinting that a sustained move lower would require breaking through significant support.
The correlation with the US Dollar Index (DXY) is a critical factor to consider. With the DXY currently at 101.14 and showing a strong upward trend on the daily chart (ADX 36.25), it exerts downward pressure on commodities like WTI, which are typically priced in dollars. A strengthening dollar generally makes oil more expensive for holders of other currencies, potentially dampening demand and pushing prices lower. The bullish signals in the DXY, particularly on the 4-hour chart where it's showing strong upward momentum, reinforce the bearish case for WTI. This inverse relationship is a cornerstone of commodity trading analysis, and in this current environment, it serves to amplify the selling pressure on crude oil.
Furthermore, the broader equity market sentiment, as indicated by the SP500 and Nasdaq, also plays a role. The SP500 is showing a mixed trend with a strong 1-hour upward trend but a bearish daily outlook, while the Nasdaq 100 is in a clear downtrend on both 1-hour and 4-hour charts. This risk-off sentiment in major tech indices can spill over into commodities, as investors tend to move away from riskier assets towards safer havens. While oil is not a traditional safe haven, a general decline in risk appetite can reduce speculative inflows into commodities, contributing to price weakness. The current divergence between the SP500's short-term strength and Nasdaq's clear weakness adds to the uncertainty, but the overall inclination towards caution in equities doesn't bode well for WTI bulls.
The recent news flow also provides context. Reports of gold stalling its recovery ahead of FOMC minutes suggest a cautious market sentiment, possibly anticipating hawkish signals from the Federal Reserve that could strengthen the dollar and dampen commodity prices. While this news is directly about gold, the underlying sentiment - anticipation of Fed tightening - is relevant across all risk assets, including oil. Traders are likely to remain hesitant to build significant long positions in WTI until there is more clarity on monetary policy. The absence of strong bullish catalysts, coupled with the prevailing bearish technical indicators and a strengthening dollar, creates a challenging environment for oil prices.
Considering the technical data and market correlations, the immediate outlook for WTI crude oil appears to favor the bears, at least in the short term. The confluence of bearish signals on the 1-hour and 4-hour charts, combined with the strengthening dollar and cautious equity markets, suggests that breaking the $75.02 resistance will be a formidable challenge. While the daily chart offers some conflicting signals, the overwhelming weight of evidence from shorter timeframes points towards further downside potential. The key will be how price action behaves if it approaches the lower support levels, particularly $73.11 and $71.11. A decisive break below these levels would confirm the bearish continuation, while a strong bounce could signal a short-term buying opportunity, though not necessarily a trend reversal.
The strength of the downtrend on the 1-hour chart, indicated by the 84% trend strength and RSI at 36.21, makes any bullish scenario contingent on a significant shift in momentum. For bulls to regain control, they would need to see a clear break and hold above the $75.02 resistance, ideally followed by a push towards the $76.13 level. Confirmation would likely require a sustained rise in RSI above 50, positive MACD crossovers, and a weakening of the DXY. Until then, the path of least resistance appears to be downwards, with traders closely watching the key support levels for potential entry points on the short side, or for signs of capitulation that could precede a reversal.
The current price of $75.02 for WTI crude oil finds itself at a critical juncture, caught between the persistent selling pressure evident on shorter timeframes and the indecision shown on the daily chart. While the technical indicators provide a predominantly bearish signal, the market's sensitivity to geopolitical events and central bank policy means that sentiment can shift rapidly. Traders must remain vigilant, paying close attention to the interplay between the dollar, equity markets, and any fresh supply-side news from major oil producers. The $75.02 level is not just a price point; it's a battleground where the immediate fate of WTI is being decided.
Bearish Scenario: Downside Momentum Continues
65% ProbabilityNeutral Scenario: Consolidation Around $75.02
25% ProbabilityBullish Scenario: Rejection of Downtrend
10% ProbabilityFrequently Asked Questions: WTI Analysis
What happens if WTI crude oil breaks below the $73.11 support level?
If WTI breaks decisively below the $73.11 support, it would signal a continuation of the strong downtrend seen on shorter timeframes. This could trigger further selling pressure, potentially targeting the next key support at $71.11 as market sentiment shifts further bearish.
Is the RSI at 36.21 a buy signal for WTI at $75.02 right now?
An RSI of 36.21 on the 1-hour chart indicates bearish momentum, not an immediate buy signal. While it's in the lower range, it's not yet in the deeply oversold territory that typically precedes a significant bounce. A confirmed buy signal would require RSI to move above 50 and ideally show bullish divergence or a MACD crossover.
How will the strengthening DXY at 101.14 affect WTI prices this week?
A strengthening DXY at 101.14 typically puts downward pressure on dollar-denominated commodities like WTI crude oil. This inverse correlation suggests that as the dollar gains strength, oil prices are likely to face headwinds, making it more expensive for buyers using other currencies and potentially reducing demand.
Should traders consider buying WTI at $75.02 given the mixed daily signals?
Buying at $75.02 is a high-risk strategy given the strong bearish signals on the 1-hour and 4-hour charts. While the daily chart shows some conflicting positive momentum, the overall trend and correlation with DXY favor caution. A more prudent approach would be to wait for a confirmed break of resistance at $76.13 or a clear bounce from lower support levels like $73.11.
Track markets in real-time
AI-powered analysis, technical indicators and real-time price data.
Join Our Telegram Channel
Breaking market news, AI analysis and trading signals instantly.
Join Channel