

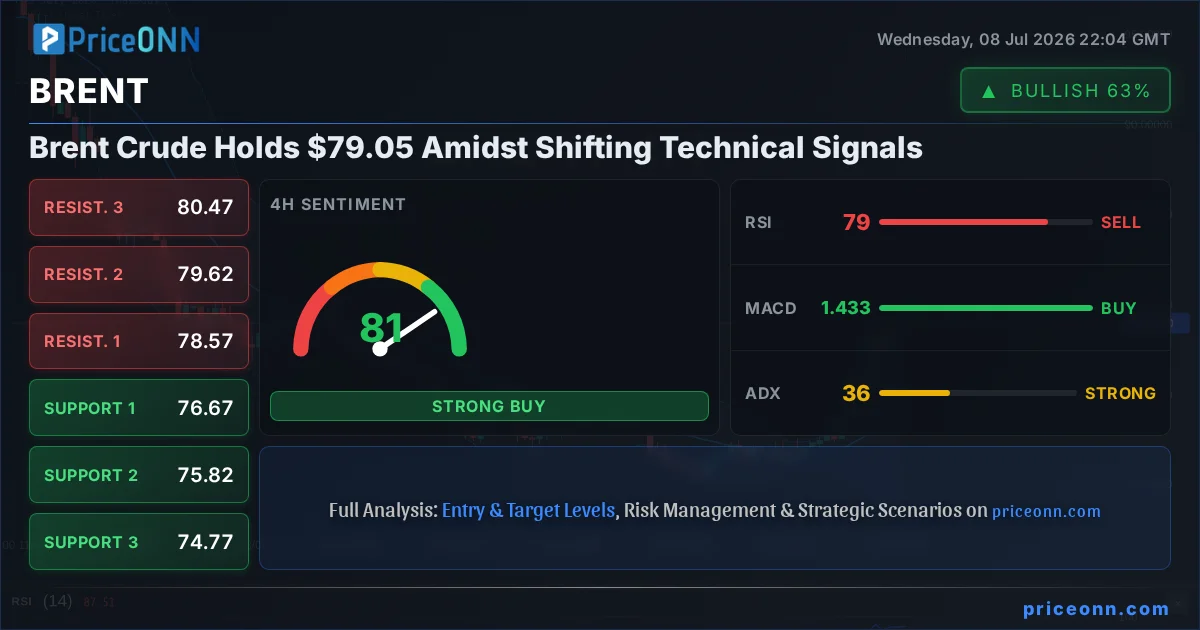
Brent Crude is currently navigating a critical juncture, trading at precisely $79.05. This level, while seemingly stable, sits amidst a complex tapestry of technical indicators and market sentiment shifts, demanding a closer look from traders and analysts alike. The recent surge in oil prices, pushing Brent past the $79 mark, has been met with a cautious undertone, suggesting that the path forward may not be a straightforward climb. Understanding the interplay between intraday volatility, longer-term trends, and the broader macroeconomic backdrop is paramount for deciphering Brent's next move.
- RSI at 66.36 on the 1H chart signals rising momentum but remains in neutral territory, indicating potential for further upside without immediate overbought pressure.
- Key support sits at $77.13 on the 1H timeframe, a level tested multiple times, while resistance looms at $78.03, a critical barrier for immediate upward progression.
- The ADX at 43.54 on the 1H chart confirms a strong uptrend, suggesting that current price action has directional conviction.
- Geopolitical tensions, particularly the 'Iran Ceasefire Declared Over' news, are providing underlying support, though market participants await clearer direction from economic data.
The energy markets have been particularly sensitive to geopolitical developments, and the recent news regarding Iran has injected a fresh layer of complexity. As President Trump declared the interim ceasefire 'over,' oil prices saw a significant jump, with Brent Crude climbing over 7% to a two-week high. This event underscores the inherent volatility in the oil market, where supply-side concerns, often amplified by geopolitical tensions, can rapidly reshape price dynamics. While this geopolitical catalyst provided a strong upward impulse, the sustainability of this rally hinges on a confluence of factors, including sustained demand, OPEC+ production policies, and the broader economic outlook.
On the technical front, the 1-hour chart for Brent Crude presents a nuanced picture. The trend is currently marked as neutral with a strength of 50%, suggesting a lack of clear directional conviction in the very short term. However, the ADX at 43.54 indicates a strong uptrend, which appears somewhat contradictory to the neutral trend assessment. This divergence warrants careful observation; it might suggest that while the overall trend has strength, the immediate price action is consolidating or experiencing chop. The Relative Strength Index (RSI) at 66.36 hovers in the neutral zone, leaning towards bullish but far from overbought territory, leaving room for potential upside. Stochastic Oscillator readings, with K at 85.01 and D at 51.75, signal a bullish trend, with the %K line above the %D line, reinforcing the idea of upward momentum.
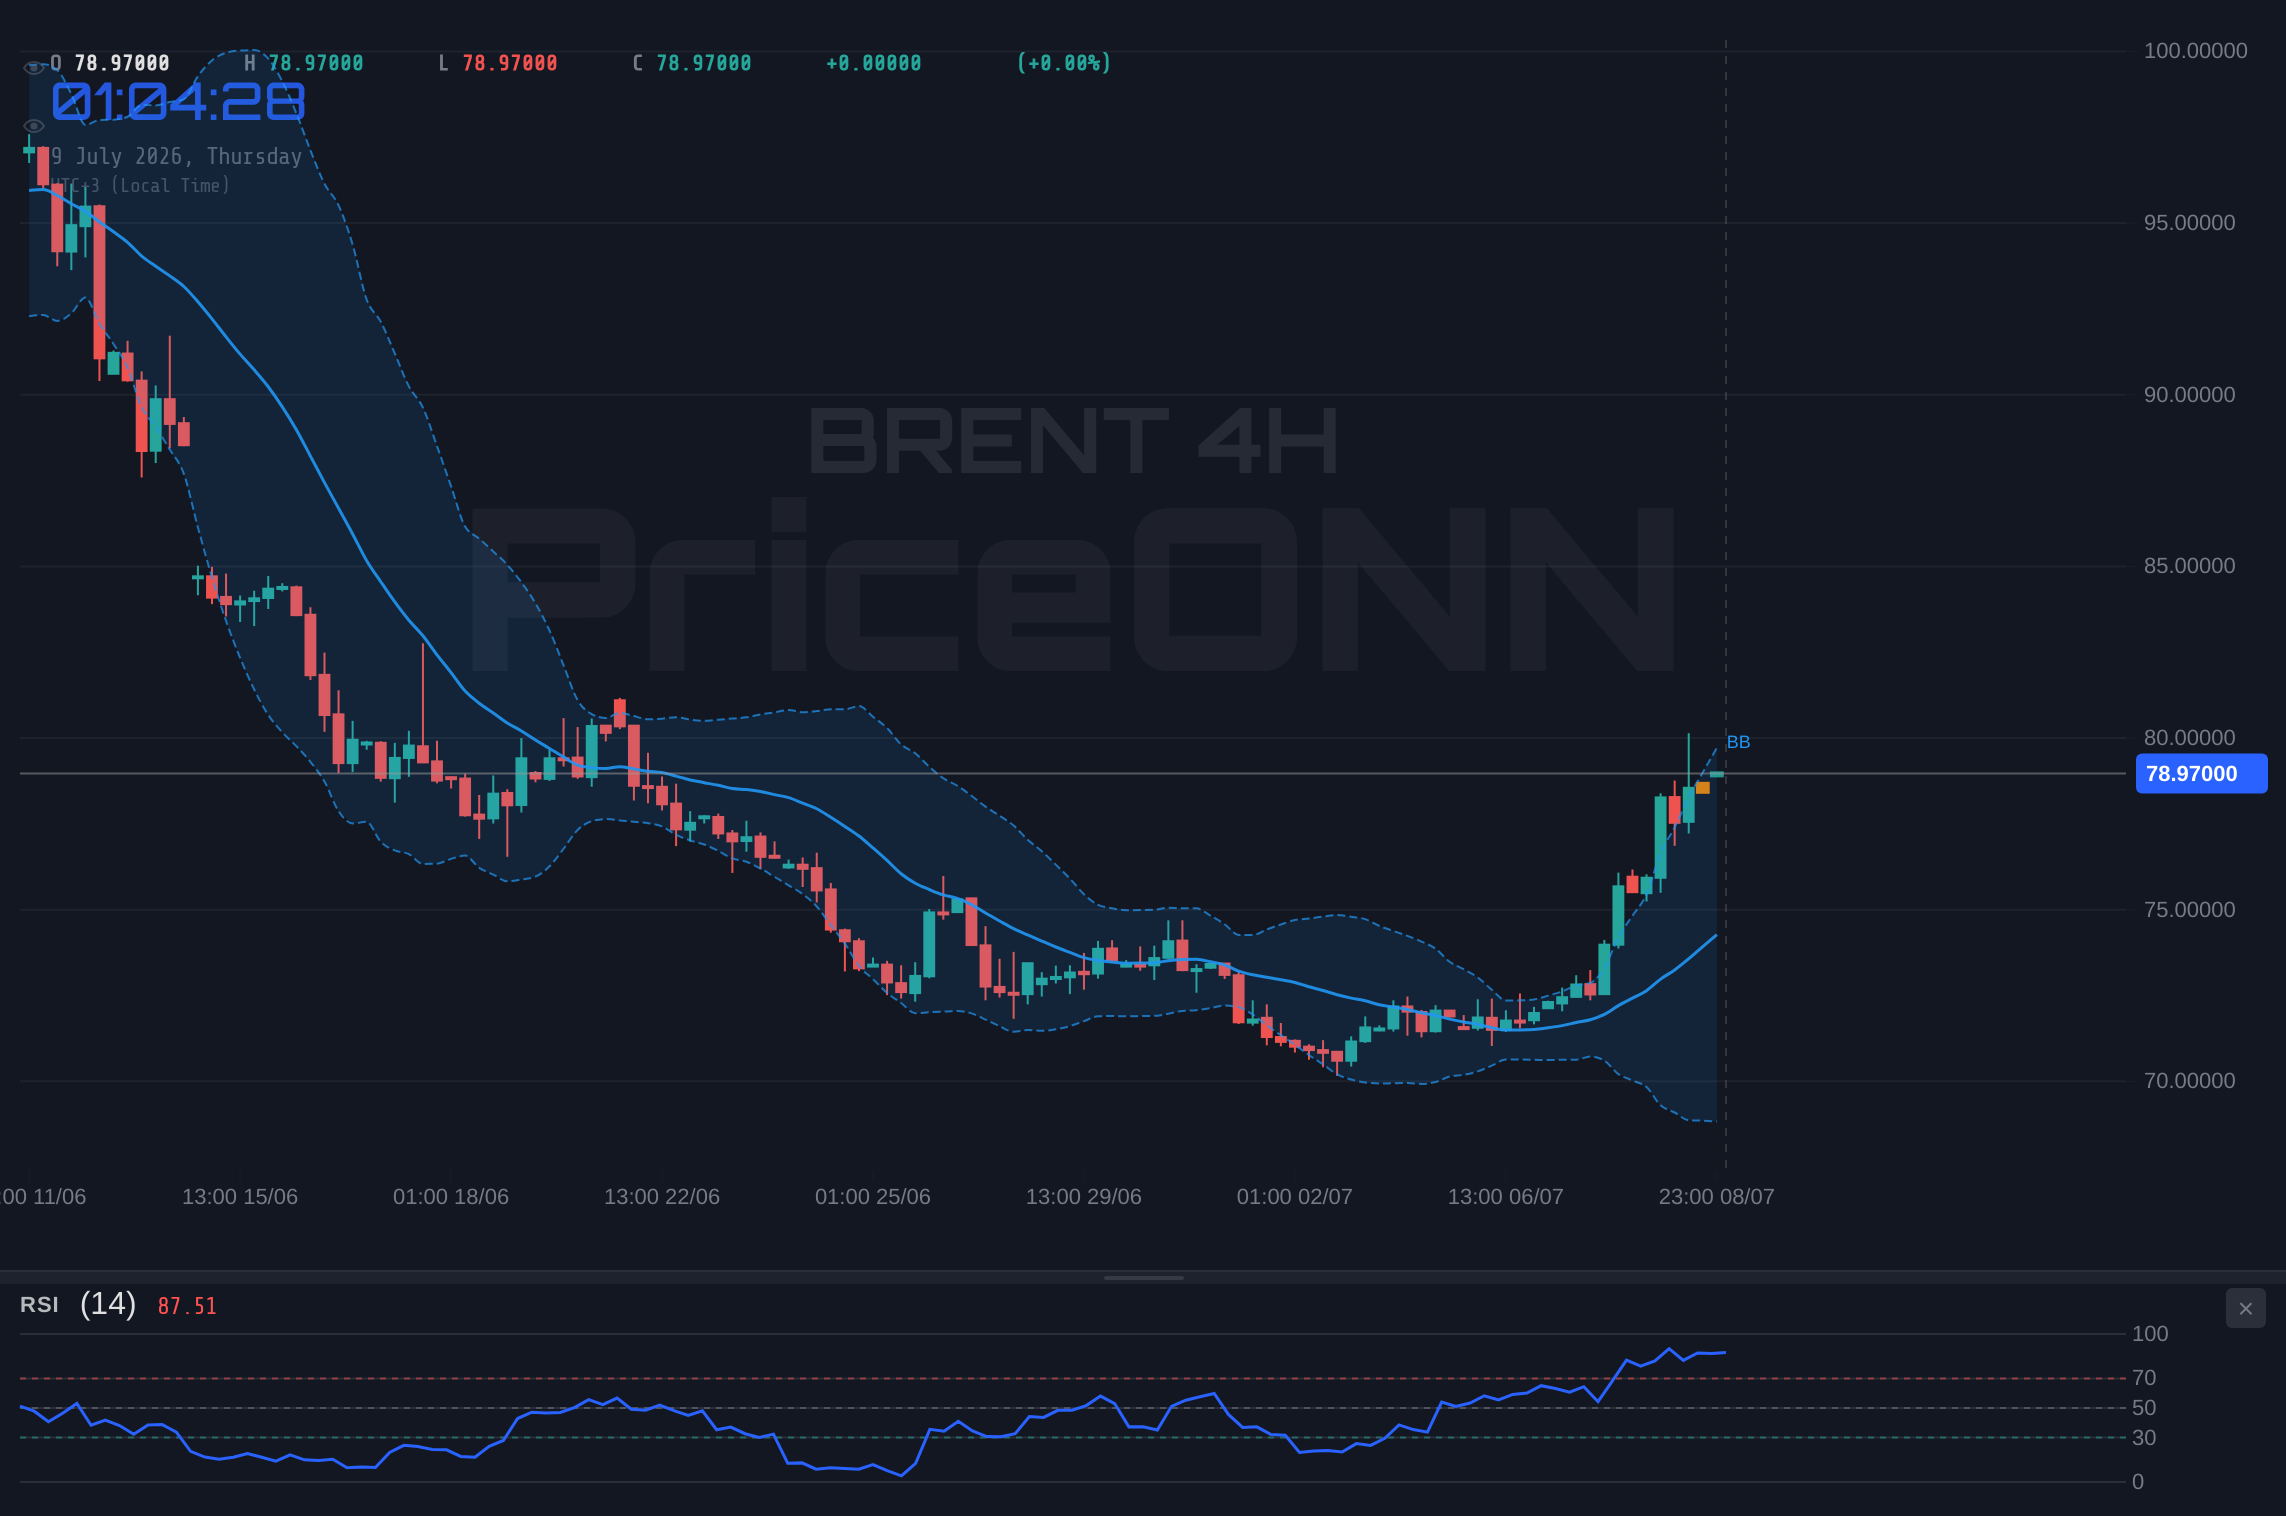
The intraday trading range between 75.24 and 80.14 highlights the significant price swings that traders have experienced recently. This wide range indicates heightened volatility, a common characteristic of energy markets influenced by geopolitical events and shifting supply-demand fundamentals. The immediate resistance level to watch on the 1-hour chart is $78.03. A decisive break and hold above this level would be crucial for sustaining the bullish momentum. Conversely, support is found at $77.58, $77.35, and $77.13. A failure to hold these support levels could signal a pullback, especially if broader market sentiment turns risk-averse.
Moving to the 4-hour timeframe, the trend flips to a clear bullish stance with a strength of 100%. This longer timeframe perspective suggests that the recent price action might be part of a larger upward move. The RSI here is at 78.63, firmly in overbought territory, which typically signals that a pullback or consolidation might be on the horizon. This contrasts with the 1-hour RSI and presents a classic divergence between short-term and medium-term indicators. The MACD shows positive momentum with the MACD line above the signal line, supporting the bullish trend. Stochastic readings also indicate an overbought condition, with both %K and %D lines in the high 80s, further reinforcing the idea that the market might be due for a pause or correction.
The Bollinger Bands on the 4-hour chart are positioned above the middle band, indicating a bullish trend, and the bands themselves appear to be widening slightly, suggesting increasing volatility. However, the extremely overbought RSI and Stochastic readings on this timeframe are a significant cautionary flag. While the trend is undeniably bullish, the risk of a short-term reversal or a period of consolidation increases as the market becomes technically overextended. Support levels on the 4-hour chart are identified at $76.67, $75.82, and $74.77, with resistance at $78.57, $79.62, and $80.47. The current price of $79.05 sits just below the $79.62 resistance, making this a key area to monitor.
The daily chart offers a broader perspective, showing a neutral trend with 50% strength. This suggests that while the 4-hour trend is bullish, the longer-term picture is less decisive, potentially indicating a market in transition or consolidation phase. The daily RSI is at 45.12, residing in the neutral zone and exhibiting a downward tendency. This aligns with the notion that the longer-term trend is not yet firmly established as bullish, despite the recent price surge. The MACD, however, shows positive momentum with the MACD line above the signal line, and the Bollinger Bands are above the middle band, suggesting an upward bias. Stochastic readings on the daily chart are K=70.14, D=28.71, indicating a bullish signal with %K above %D, but the wide gap suggests potential for divergence or a sharp move.
The ADX on the daily chart stands at 39.95, indicating a strong downtrend. This is a significant divergence from the bullish signals on the 4-hour chart and the neutral-to-bullish readings on the 1-hour chart. This conflict across timeframes suggests that the market is at a crossroads. The strong ADX reading on the daily chart implies that the underlying trend, despite recent price action, might still be predominantly bearish, or that the current bullish move is facing significant headwinds. Support on the daily chart is found at $73.12, $70.56, and $69.08, while resistance is marked at $77.16, $78.64, and $81.20. The current price of $79.05 is approaching the $78.64 daily resistance.
Correlating Brent's movements with other market indicators provides further context. The US Dollar Index (DXY) is currently at 101.08, showing a slight upward trend. Generally, a stronger dollar tends to put downward pressure on oil prices, as oil is typically priced in dollars. However, the current bullish momentum in Brent, fueled partly by geopolitical events, seems to be overriding this inverse correlation for now. The SP500 index is trading at 6572.87, showing a strong upward move of 0.74%. A risk-on environment, indicated by rising equity markets, can sometimes correlate with higher oil prices as it suggests robust economic activity and demand. Conversely, the Nasdaq 100 is showing a more mixed picture, with a neutral trend on the 1-hour chart but a strong downtrend on the 4-hour. This mixed signal from equities adds another layer of uncertainty to the overall market sentiment.
The recent news regarding the US President declaring the Iran ceasefire 'over' is a significant geopolitical driver that cannot be ignored. This development directly impacts crude oil supply concerns, particularly in the Middle East, a region critical for global oil production. Such geopolitical risks often lead to a 'risk premium' being priced into oil, driving prices higher irrespective of immediate supply-demand fundamentals. This event could be the catalyst that sustains the bullish momentum seen on the 4-hour chart, potentially pushing Brent towards higher resistance levels. However, the market's reaction will also depend on how other major oil producers, like OPEC+, respond and whether there are any diplomatic de-escalations.
From a trading perspective, the conflicting signals across different timeframes present both opportunities and risks. The strong uptrend indicated by the ADX on the 4-hour chart, combined with the bullish Stochastic and MACD signals, suggests that the path of least resistance might be upwards in the short to medium term. However, the overbought conditions on the 4-hour RSI and Stochastic, coupled with the neutral daily trend and strong daily downtrend ADX, caution against aggressive long positions without clear confirmation or significant pullbacks to more favorable entry levels. The $79.05 price point is currently battling resistance around the $78.03-$78.57 range on the 1H and 4H charts respectively. A decisive break above these levels would be required to signal further upside potential.
For those adopting a shorter-term trading strategy, monitoring the 1-hour chart's support at $77.58 and resistance at $78.03 will be crucial. A break above $78.03 could target the next resistance at $78.25 and potentially higher towards $78.48. Conversely, a break below $77.58 might lead to a test of $77.35 and further down to $77.13. For swing traders focusing on the 4-hour timeframe, the key is whether the price can decisively break through the $78.57-$79.62 resistance zone. A successful breach could open the door towards $80.47, but the overbought indicators suggest this might be a challenging ascent without a period of consolidation. The daily chart's resistance at $77.16 and $78.64 needs to be considered for longer-term outlooks.
The interplay between technical indicators and fundamental drivers like geopolitical news creates a complex trading environment. While the immediate news flow from the Middle East injects a bullish bias, the technical picture is far from one-sided. The daily chart's strong downtrend ADX (39.95) cannot be ignored and suggests that the recent price appreciation might be a counter-trend rally within a larger bearish structure. Traders must remain vigilant, paying close attention to confirmation signals and managing risk diligently. The current price of $79.05 is a pivotal point, sitting between short-term bullish momentum and longer-term technical uncertainties.
Looking ahead, key economic data releases and ongoing geopolitical developments will be critical in shaping Brent Crude's trajectory. Investors will be closely watching for any further escalation or de-escalation in the Middle East, as well as OPEC+'s stance on production quotas. Economic indicators related to global growth and inflation will also play a significant role. The market's ability to digest the current bullish sentiment, especially in light of the overbought conditions on higher timeframes and the conflicting daily trend signals, will determine whether Brent can sustain its current levels and push higher, or if a correction is imminent.
The current technical setup for Brent Crude suggests a market at a critical inflection point. While short-term momentum, spurred by geopolitical events, appears bullish, longer-term indicators and trend strength readings present a more cautious outlook. The price of $79.05 is currently battling significant resistance, and a clear break above key levels is needed to confirm a sustained upward move. Traders should exercise caution, employ robust risk management strategies, and await clearer signals before committing to significant positions. The market's ability to consolidate gains or break through immediate resistance will be telling.
The path forward for Brent Crude will likely be characterized by continued volatility, driven by the tug-of-war between geopolitical supply risks and broader economic uncertainties. The technical indicators offer a mixed bag of signals, with strong short-term bullish momentum clashing with longer-term bearish trend strengths and overbought conditions. Navigating this complex landscape requires a disciplined approach, focusing on key support and resistance levels and being prepared for rapid shifts in market sentiment. Patience and risk management will be the most valuable tools for traders in the coming sessions.
Trading Scenarios for Brent Crude
Bearish Scenario: Consolidation Below Resistance
40% ProbabilityNeutral Scenario: Sideways Action Around $79.05
10% ProbabilityBullish Scenario: Breakout Above Key Resistance
50% Probability| Indicator | Value | Signal | Interpretation |
|---|---|---|---|
| RSI (14) | 66.36 | Neutral | Leaning bullish, room to run |
| MACD | Positive Momentum | Bullish | MACD above signal line |
| Stochastic | K:85.01, D:51.75 | Bullish | %K > %D, upward momentum |
| ADX | 43.54 | Strong Trend | Uptrend conviction (1H) |
| Bollinger Bands | Below Mid Band (1H) | Bearish | Short-term downward pressure |
Frequently Asked Questions: Brent Crude Analysis
What happens if Brent Crude breaks above the $78.64 daily resistance level?
A sustained break above $78.64 on the daily chart would invalidate the bearish outlook and could signal a continuation of the bullish trend. This scenario targets the next resistance at $80.47, with a secondary target at $81.20.
Is the current RSI at 66.36 a buy signal for Brent Crude at $79.05?
An RSI of 66.36 on the 1-hour chart is in the neutral-to-bullish zone, suggesting upward momentum but not yet overbought conditions. While it supports further upside, it's not a standalone buy signal. Confirmation from other indicators and price action above key resistance levels is advised.
How is the ADX reading of 43.54 impacting Brent Crude's trend analysis?
An ADX of 43.54 on the 1-hour chart indicates a strong uptrend, providing conviction to the current bullish price action. However, this high reading also suggests that the trend might be maturing, and traders should be wary of potential pullbacks or reversals if momentum falters.
How will the geopolitical news about Iran affect Brent Crude prices this week?
The declaration of the Iran ceasefire being 'over' injects significant supply risk into the oil market, potentially driving prices higher. This geopolitical factor could override current technical resistance levels, creating upward pressure as traders price in potential supply disruptions.
Track markets in real-time
AI-powered analysis, technical indicators and real-time price data.
Join Our Telegram Channel
Breaking market news, AI analysis and trading signals instantly.
Join Channel