

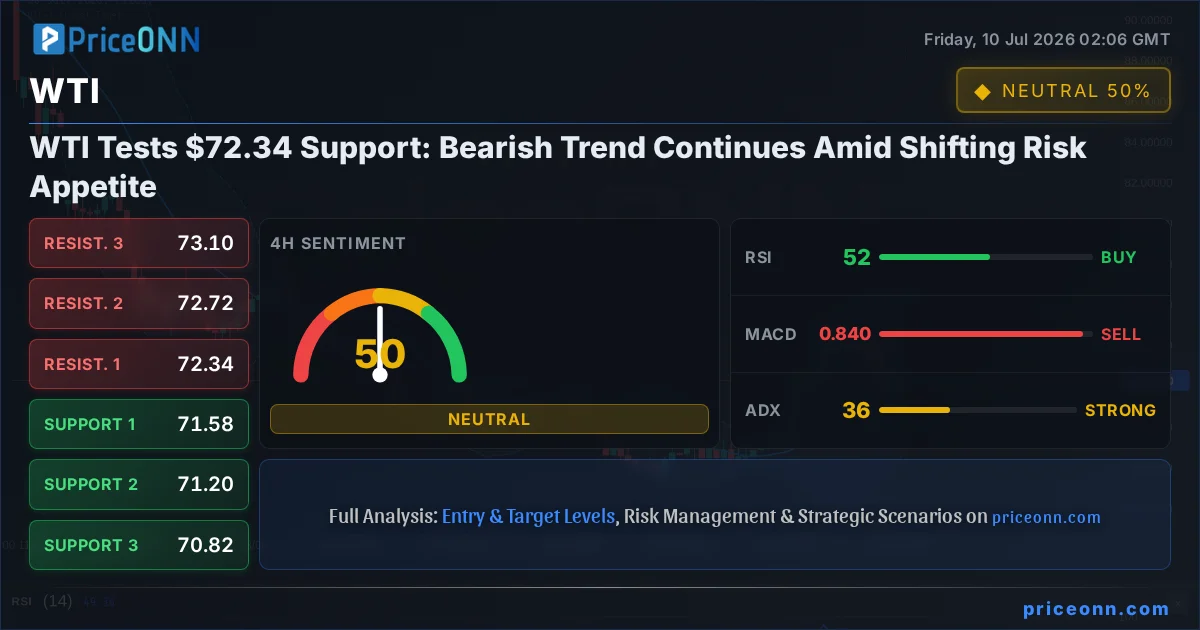
The narrative surrounding WTI crude oil is increasingly dominated by a battle for control near the $72.34 mark. As the session unfolds, traders are scrutinizing this critical support level, which sits just above the $71.94 support identified on the 1-hour chart. The recent price action, characterized by a $2.65 daily drop from the $74.96 high, paints a distinctly bearish picture, especially when viewed against the backdrop of broader market dynamics. WTI today analysis reveals a market grappling with weakening demand signals and shifting geopolitical landscapes, making the $72.34 level a focal point for short-term direction.
- WTI crude oil is testing support near $72.34, with the immediate 1-hour support at $71.94.
- The daily trend for WTI is bearish, confirmed by a significant price drop and ADX at 36.47.
- The DXY is falling to 100.73, typically offering some relief to commodities, but WTI's bearish momentum persists.
- Risk appetite is mixed: SP500 shows a bullish 1H trend but a bearish 1D, creating uncertainty.
The prevailing bearish sentiment for WTI is not merely a function of isolated market forces; it's deeply intertwined with the macroeconomic environment and evolving risk appetite across global markets. The Dollar Index (DXY), currently trading at 100.73 and showing a bearish trend on the 1-hour timeframe, usually offers some reprieve to dollar-denominated commodities like WTI. However, the persistent weakness in oil prices suggests that other factors are weighing more heavily. Geopolitical tensions in the Middle East, while always a background risk, have not recently escalated to a degree that would typically justify sustained bullish price action in crude. Instead, concerns about global demand, particularly from major economies, appear to be taking precedence. The current trading range, with the daily high at $74.96 and the low at $71.59, encapsulates this tug-of-war, but the overall trajectory points downwards.
Technically, the indicators on the 1-day timeframe are flashing cautionary signals, reinforcing the bearish outlook. The ADX, a measure of trend strength, stands at a robust 36.47 on the daily chart, indicating a strong existing trend. Given that the overall direction on this timeframe is bearish, this high ADX value suggests the downward momentum is well-established. The RSI(14) is sitting at 39.72, firmly in neutral territory but with a downward inclination, suggesting room for further price depreciation before hitting oversold conditions. The MACD, while showing positive momentum on the 1-day chart, is below its signal line, hinting at potential seller exhaustion but not yet a confirmed reversal. The Bollinger Bands are also positioned below the middle band, a classic bearish signal. These combined indicators on the daily chart underscore the challenge for any immediate bullish recovery.
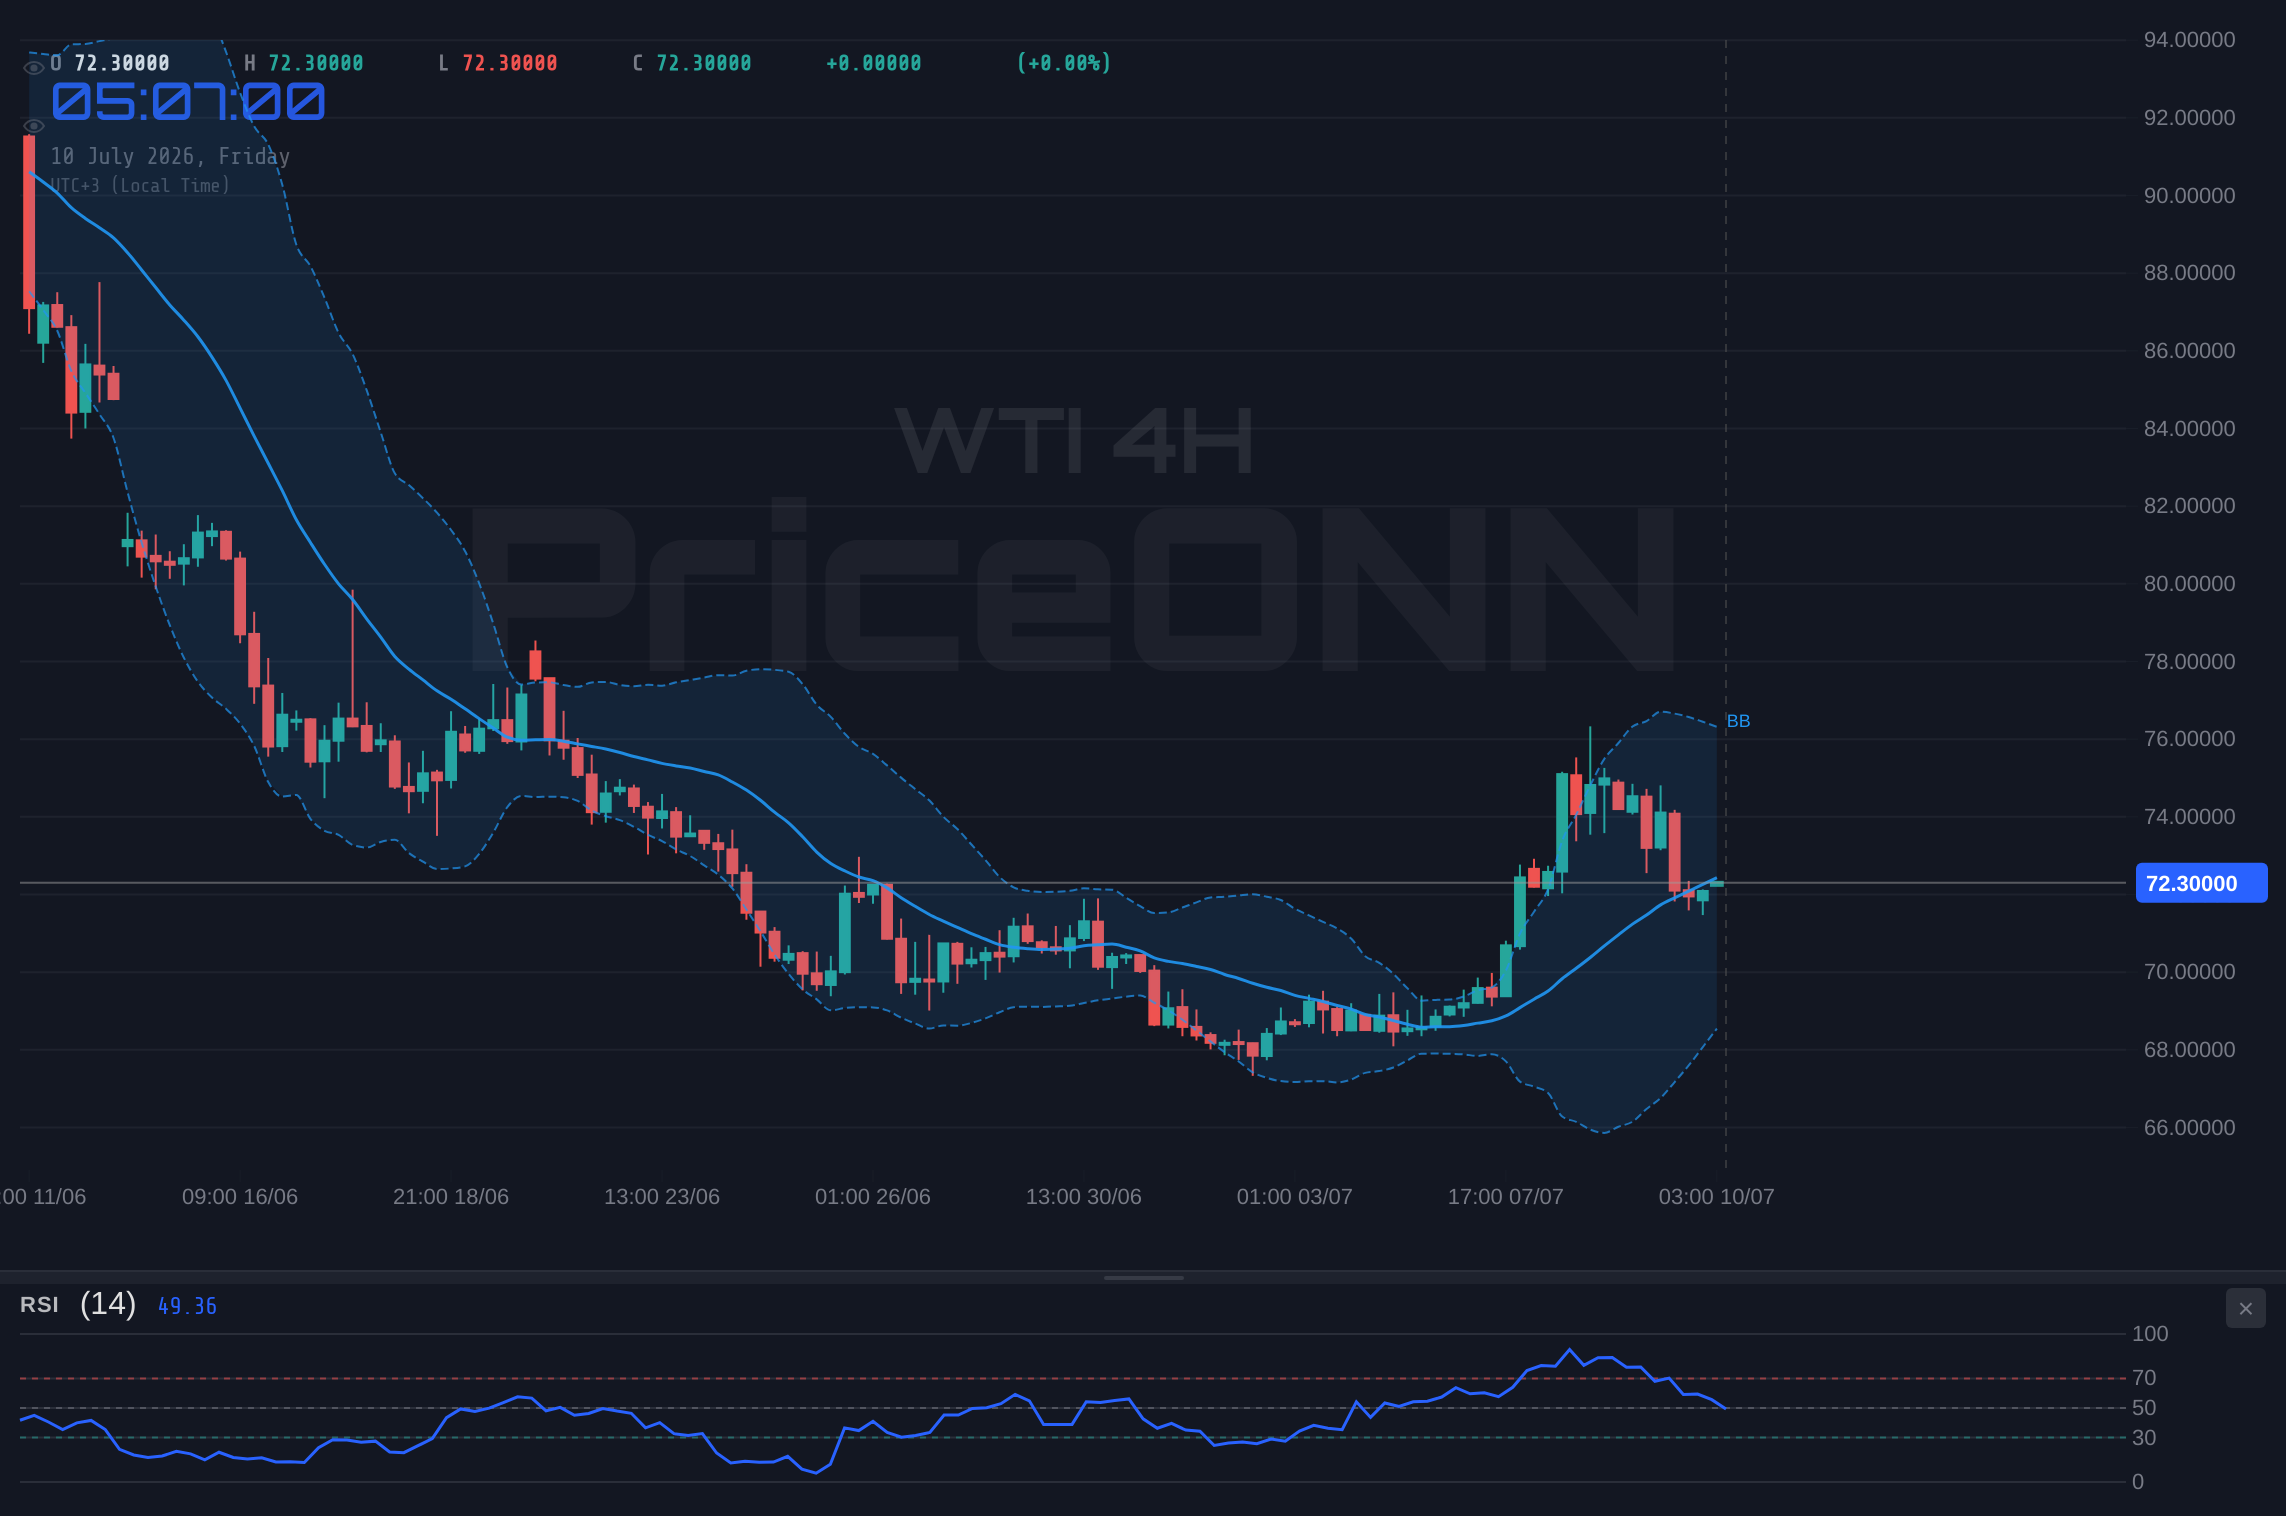
Examining the shorter timeframes offers a more nuanced, albeit still cautious, perspective. On the 4-hour chart, the trend strength (ADX) is a strong 36.47, again indicating a firm trend, and the general signal leans neutral, suggesting a potential pause or consolidation before the next significant move. The RSI here is 52.19, indicating a neutral stance with a slight upward inclination, but this is overshadowed by the bearish signals on the daily chart. The 1-hour timeframe presents a slightly different picture, with a neutral trend strength (ADX 24.06) and a bearish signal overall. The RSI is 44.32, continuing the downward bias. This divergence across timeframes highlights a market in flux, but the dominant daily trend remains the most critical factor for the medium-term outlook.
The correlation between WTI and other major markets provides further context. The SP500, currently showing a bullish 1-hour trend (RSI 70.95, ADX 49.72) but a bearish 1-day trend (RSI 45.35, ADX 47.51), reflects a similar conflict between short-term optimism and longer-term caution in risk assets. This mixed signal in equities can translate into volatility for commodities, as investors' risk appetite fluctuates. A downturn in the SP500 often correlates with a decrease in demand for riskier assets, including oil, while a rally could theoretically boost WTI. However, the current WTI price action seems to be driven more by fundamental supply/demand concerns and perhaps anticipation of economic slowdowns rather than a direct reaction to equity market movements.
The energy market's internal dynamics also play a crucial role. Recent news indicates Brent crude, a closely watched benchmark, also experienced a significant drop, trading down 3.44% to $76.26. This parallel movement suggests broader pressures are affecting the oil complex, not just WTI in isolation. While Gold and Silver saw some recovery attempts, with XAUUSD reaching $4,118.8 and XAGUSD at $60.14, their momentum is capped as inflation fears cool amid a strengthening dollar (though DXY is currently weak). This implies that while inflation remains a concern, the immediate catalyst for oil prices might be shifting towards demand-side pressures rather than supply-side inflation hedges. The breakdown in Brent above $80 mentioned in some reports failed to materialize, reinforcing the bearish sentiment across the crude complex.
Looking at the specific support and resistance levels provided for WTI, the immediate battleground is clear. On the 1-hour chart, support is seen at $71.94, followed by $71.78 and $71.69. Resistance lies at $72.19, $72.28, and $72.44. The 4-hour chart offers slightly wider ranges, with support at $71.58, $71.2, and $70.82, and resistance at $72.34 (the current price), $72.72, and $73.1. The daily chart presents more significant levels, with support at $72.52 (just above the current price), $70.06, and $68.15. Resistance on the daily is much higher, starting at $76.89, then $80.99, and $83.02. The proximity of the $72.34 current price to the 1-hour resistance of $72.44 and the 4-hour resistance of $72.34 itself, coupled with the nearby 1-hour support at $71.94 and 4-hour support at $71.58, indicates a tight range for immediate trading. However, the daily support at $72.52 is a critical short-term hurdle.
The current technical signals present a mixed bag across different timeframes, but the daily chart's bearish bias carries significant weight. The 1-hour chart shows a 'BUY' signal with 7 'Buy', 1 'Sell', and 0 'Neutral' indicators, driven by strong RSI (44.32, but with upward inclination) and Stochastic (K=57.11, D=24.31, suggesting a buy signal). However, the 4-hour chart is neutral (4 'Buy', 4 'Sell', 0 'Neutral'), with an RSI of 52.19 and a bearish Stochastic signal. The daily chart, where the longer-term trend is determined, shows a 'SELL' signal (2 'Buy', 5 'Sell', 0 'Neutral'), with RSI at 39.72 and a bullish Stochastic signal. This conflict, particularly the daily chart's bearish overall signal despite a bullish stochastic, suggests caution. The ADX values (1H: 24.06, 4H: 36.47, 1D: 35.65) confirm a strong trend is in play, predominantly bearish on the daily.
Considering the broader market context, the weakening US Dollar Index (DXY) at 100.73 might typically support oil prices. However, WTI's current trajectory suggests that demand-side concerns are overriding this correlation. The recent drop in Brent crude reinforces the idea that the entire oil complex is under pressure. Geopolitical events have not provided a strong bullish catalyst recently, and the focus is increasingly shifting to global economic growth prospects. If major economies show signs of slowing down, demand for oil will inevitably decrease, putting further downward pressure on WTI. The fact that gold and silver, often seen as inflation hedges, are struggling to maintain upward momentum despite some recovery attempts further supports the narrative that inflation fears are not currently the primary driver for commodities.
For traders, the current price action around $72.34 presents a crucial inflection point. The immediate bearish trend on the daily chart, supported by strong ADX readings, suggests that any rallies might be short-lived opportunities for sellers. The key is to watch how WTI reacts to the support levels identified. A sustained break below $71.58 on the 4-hour chart, or even more critically, a decisive close below the daily support at $70.06, would confirm the continuation of the bearish trend and open up further downside potential. Conversely, a strong bounce from the current levels, with a decisive break above the 1-hour resistance at $72.44 and subsequently the 4-hour resistance at $73.1, would be needed to challenge the bearish narrative. The daily resistance at $76.89 remains a significant barrier for any substantial bullish reversal.
The market's immediate future hinges on several factors. Firstly, the continued direction of the DXY will be important; if it resumes its decline, it could offer some support to WTI. Secondly, the performance of major equity indices like the SP500 will provide clues about risk sentiment. A sustained sell-off in equities could spill over into commodities. Thirdly, any significant geopolitical developments, particularly in the Middle East, could quickly alter the supply-side narrative. Finally, upcoming economic data releases, especially those pertaining to global manufacturing activity and inflation, will be crucial in shaping demand expectations. The current technical setup, dominated by the bearish daily trend, suggests a cautious approach is warranted, with a focus on downside risks until clearer bullish confirmation emerges.
The scenario analysis below outlines potential paths forward for WTI. Each scenario is weighted based on the current technical indicators, market correlations, and fundamental drivers. It's crucial to remember that market conditions can change rapidly, and adherence to risk management principles is paramount. The interplay between the US Dollar, equity markets, and geopolitical stability will be key determinants in validating or invalidating these scenarios in the coming days and weeks.
Bearish Scenario: The Downward Spiral Continues
65% ProbabilityNeutral Scenario: Range-Bound Consolidation
25% ProbabilityBullish Scenario: A Surprise Reversal
10% ProbabilityFrequently Asked Questions: WTI Analysis
What happens if WTI breaks below the $71.58 support level?
A break and sustained hold below $71.58 on the 4-hour chart would likely confirm the bearish trend continuation. This scenario targets the next significant daily support at $70.06, and potentially lower towards $68.15 if selling pressure intensifies.
Should I buy WTI at current levels near $72.34 given the mixed signals?
Buying at $72.34 is risky due to the dominant bearish daily trend and the proximity of resistance at $72.44. A more prudent approach would be to wait for a confirmed break above $73.10 with strong volume, or a clear bounce from lower support levels like $70.06, with a 65% probability favoring the downside currently.
Is the RSI at 39.72 on the daily chart a sell signal for WTI?
An RSI of 39.72 on the daily chart indicates that WTI is not yet oversold, but it does show a downward bias. Combined with the strong ADX of 35.65 on the daily, this reading supports the bearish trend, suggesting further downside is possible before any significant oversold conditions emerge.
How will the current DXY weakness affect WTI prices this week?
Typically, a weaker DXY supports oil prices. However, WTI's current bearish momentum, driven by demand concerns, seems to be overriding this correlation. While DXY at 100.73 might offer some minor relief, the price action suggests that unless demand signals improve or geopolitical supply risks escalate, the dollar's weakness may not be enough to prevent further WTI declines.
| Indicator | Value | Signal | Interpretation |
|---|---|---|---|
| RSI (14) | 39.72 | Bearish | Downward bias, not oversold yet |
| MACD Histogram | [Value from market data] | Neutral | Momentum below signal line |
| Stochastic | K=77.13, D=38.34 | Bullish | Conflicting daily signal, watch for confirmation |
| ADX | 35.65 | Strong Trend | Confirms strong existing trend (bearish on daily) |
| Bollinger Bands | Below Mid-Band | Bearish | Price below middle band indicates downward pressure |
What I'm Watching This Week:
- The $71.58 level: A decisive break below this 4-hour support will validate the bearish scenario.
- SP500 action: A continued downturn in equities could accelerate WTI's decline.
- Geopolitical headlines: Any escalation in the Middle East remains a wildcard for oil supply.
Track markets in real-time
AI-powered analysis, technical indicators and real-time price data.
Join Our Telegram Channel
Breaking market news, AI analysis and trading signals instantly.
Join Channel