

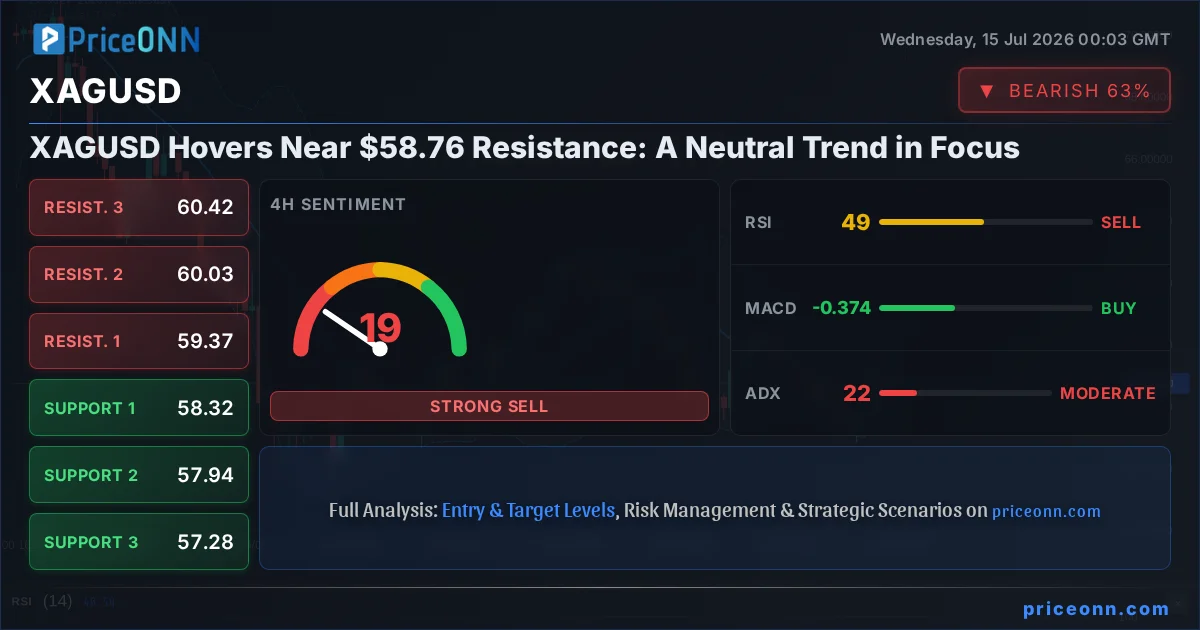
The silver market is currently at a critical juncture, with XAGUSD trading precisely at $58.76. This price point is not just a number; it represents a battleground where the neutral trend is being tested, and traders are scrutinizing every tick for clues about the next significant move. With a delicate balance between bullish aspirations and bearish pressures, understanding the nuances of the current technical landscape is paramount for navigating this volatile asset. The interplay between various timeframes, indicator readings, and overarching market correlations paints a complex picture, demanding a strategic approach rather than a reactive one. This analysis delves into the intricate details, aiming to provide clarity on the path ahead for silver.
- RSI at 56.44 on the 1H chart signals a neutral-to-bullish inclination, but the daily RSI at 39.24 indicates underlying weakness.
- Key support for XAGUSD is identified at $58.44, while immediate resistance looms around $58.71.
- The ADX indicator presents conflicting signals: strong trend strength on the 1H (25.95) and 1D (40.72) charts, but a weaker trend on the 4H (21.89), suggesting indecision within the broader trend.
- Correlation analysis with the DXY, currently at 100.9, shows a typical inverse relationship, but the dollar's slight weakness offers a potential tailwind for silver.
The current trading environment for XAGUSD at $58.76 is characterized by a palpable sense of indecision across different timeframes. While the 1-hour chart shows a generally bullish leaning with a "BUY" signal from its aggregate indicators, the picture darkens considerably when moving to the 4-hour and daily charts, both of which lean towards a "SELL" signal. This divergence highlights a market struggling to find a clear direction. The 1H trend is officially neutral with a 50% strength, supported by an RSI of 56.44 and positive MACD momentum. However, this immediate optimism is tempered by the 4H RSI dipping to 46.52 and the daily RSI at 39.24, both suggesting a weakening upside potential and a possible return of selling pressure. This dichotomy is crucial for traders to grasp – short-term opportunities might exist, but the longer-term outlook remains clouded.
Delving deeper into the technical indicators, the MACD on the 1-hour chart shows positive momentum, with the MACD line above the signal line, reinforcing the short-term bullish bias. However, this positive momentum is not consistently reflected across all timeframes. The Stochastic Oscillator on the 1H chart (K=29.74, D=46.14) is giving a bearish signal, indicating that the %K line is below the %D line, which often precedes a price dip or consolidation. This is in stark contrast to the 4H Stochastic, which is showing a bullish signal (K=67.61, D=36.55), suggesting a potential upward move from current levels. This conflicting information from a single indicator across different timeframes underscores the choppiness of the current market. The ADX, a measure of trend strength, also presents a mixed bag. On the 1H chart, it reads 25.95, indicating a strong uptrend. Yet, on the 4H, it drops to 21.89, suggesting a moderate-to-weakening trend, and on the daily, it rises to 38.11, pointing to a strong downtrend. This inconsistency in trend strength across timeframes makes it challenging to establish a robust directional bias.
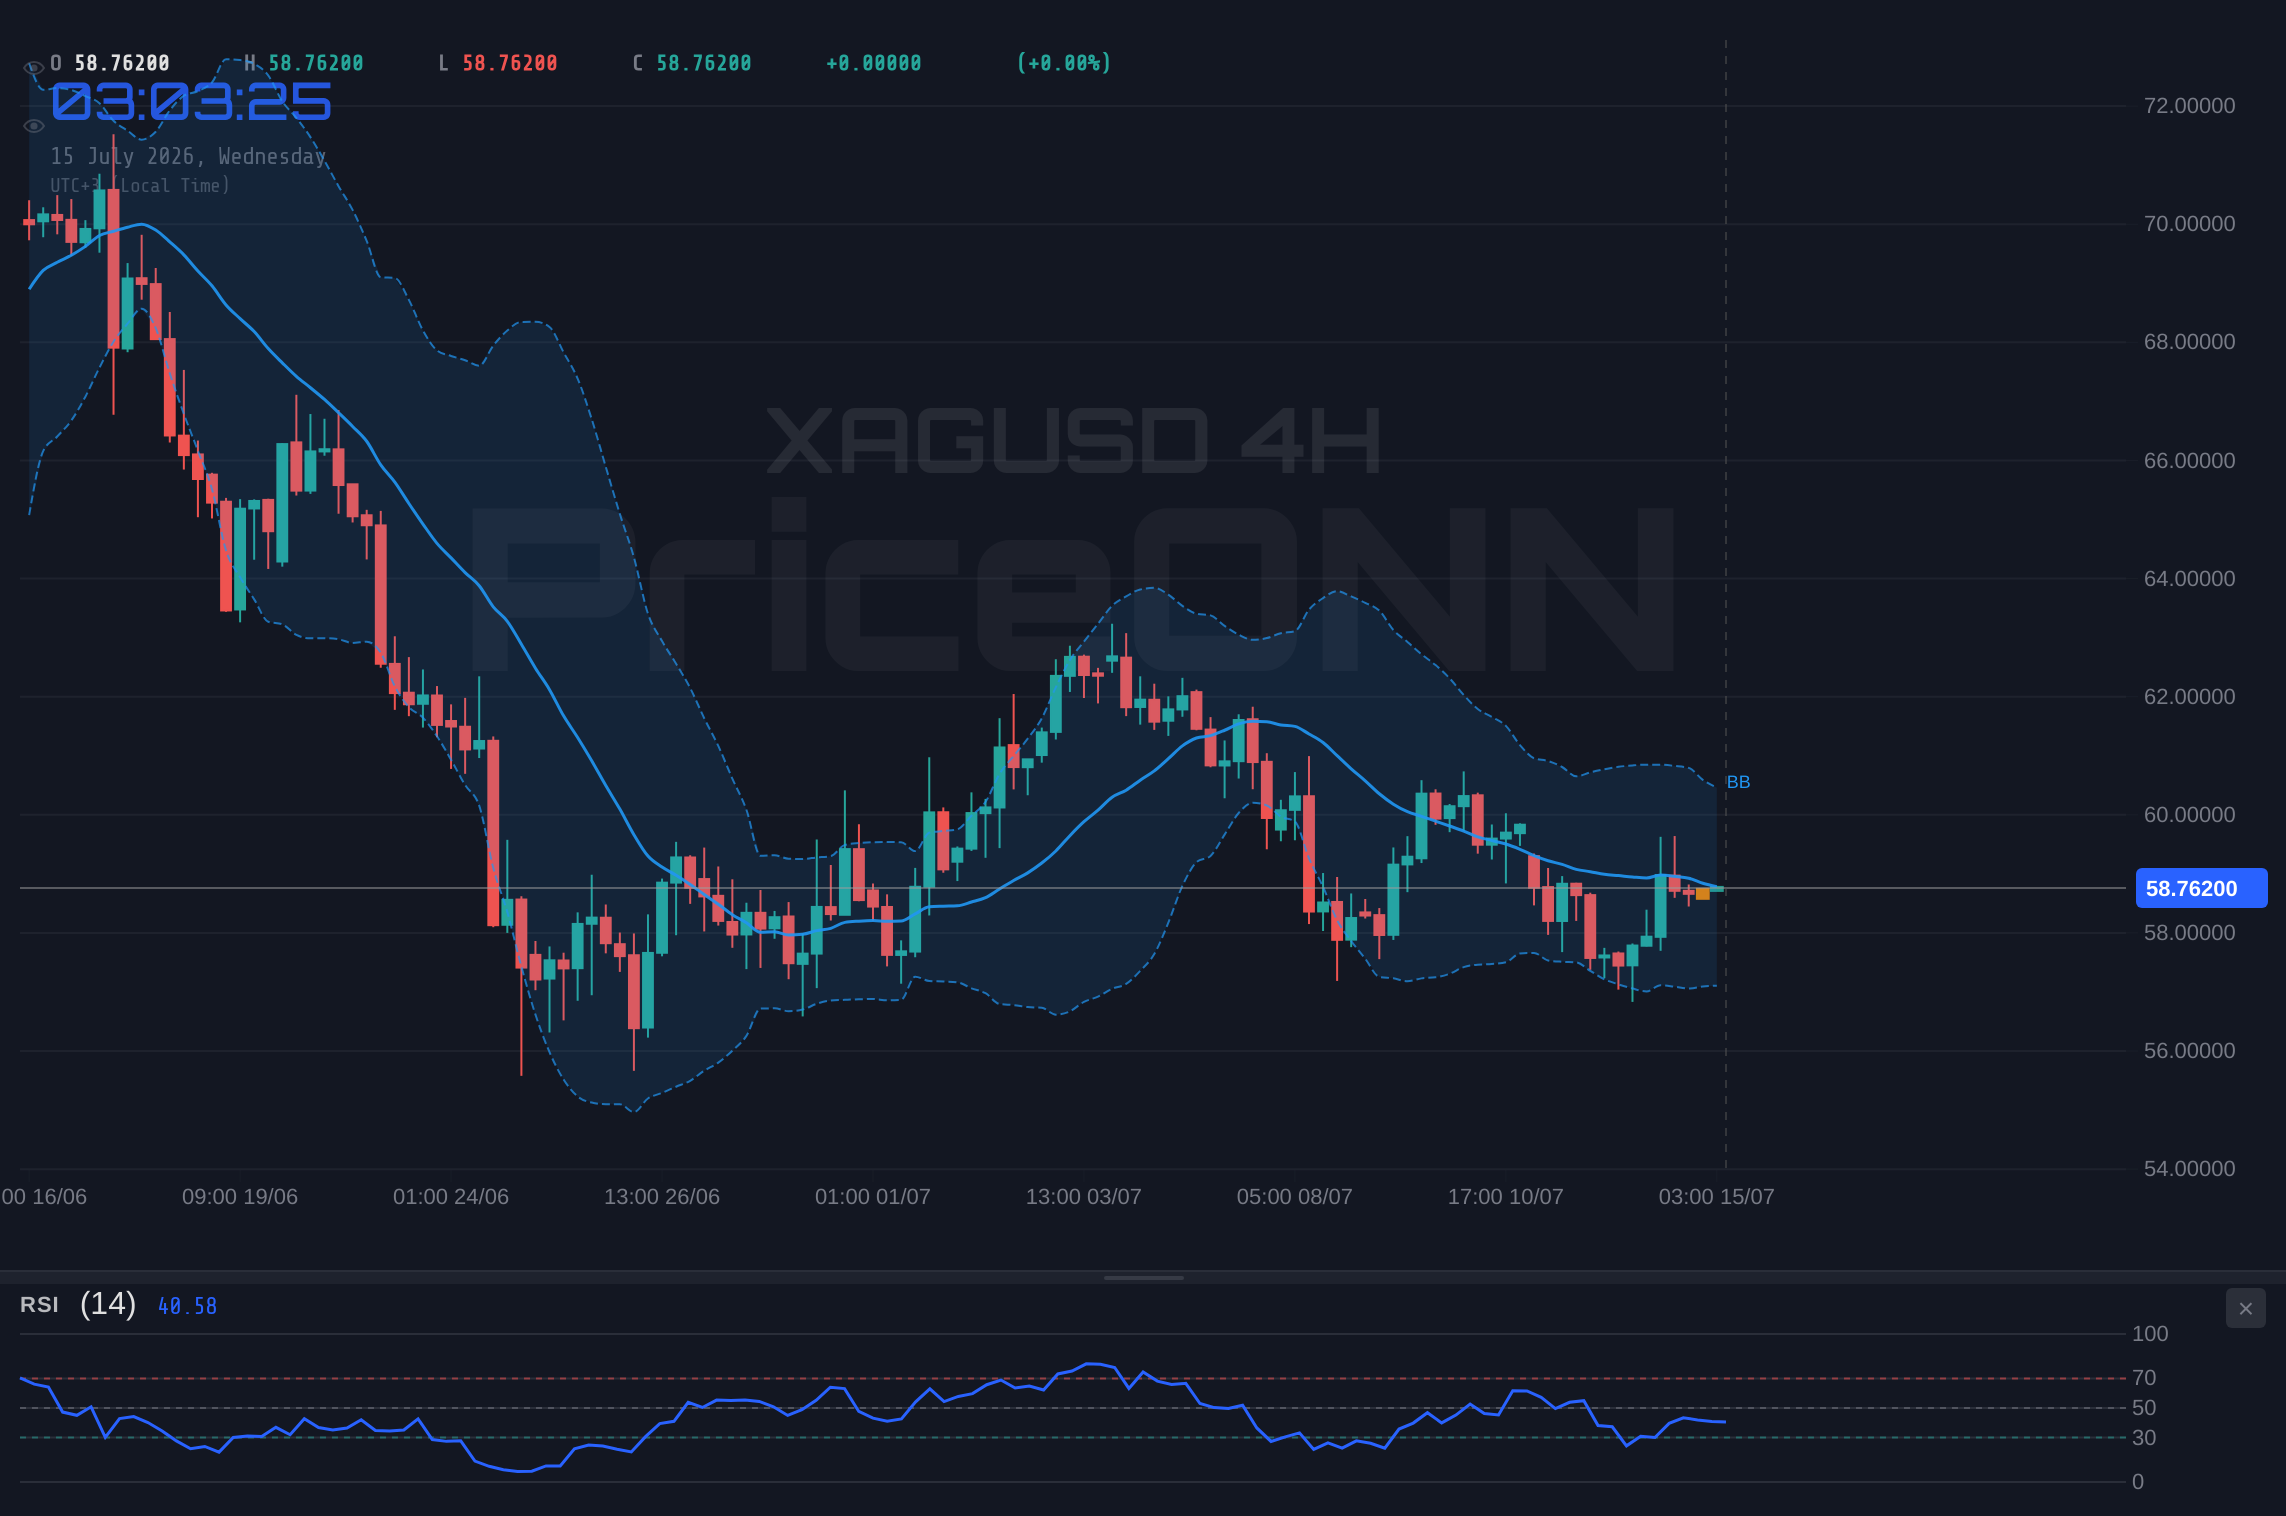
The Bollinger Bands offer another layer to this complex technical tapestry. On the 1-hour chart, XAGUSD is trading above the middle band, aligning with the bullish sentiment seen in other short-term indicators and suggesting upward momentum. However, the 4-hour and daily charts show the price trading below their respective middle bands. This indicates that while there might be short-term buying interest, the broader trend on these longer timeframes is bearish, with the price finding resistance at the middle band. This positioning suggests that any upward moves on the shorter timeframe might be met with significant selling pressure as traders on higher timeframes defend these key moving averages. The proximity to the $58.76 mark, which is close to the immediate resistance level of $58.71 on the 1H chart, further amplifies this potential for a reversal or at least a pause in the upward momentum.
Examining the support and resistance levels provides a clearer view of the immediate price action battleground. On the 1-hour timeframe, the immediate support is at $58.57, followed by $58.52 and $58.44. Resistance is seen at $58.71, $58.79, and $58.85. Given the current price of $58.76, the market is essentially hovering just below the first hourly resistance. A break above $58.71 could signal a short-term bullish continuation towards $58.79 and potentially $58.85. Conversely, a failure to overcome this resistance and a subsequent break below $58.57 could see prices retreating towards $58.52 and the more significant hourly support at $58.44. On the 4-hour chart, support levels are more pronounced at $58.32, $57.94, and $57.28, while resistance is noted at $59.37, $60.03, and $60.42. The daily chart presents even wider ranges, with support at $56.79 and resistance at $58.90. The current price is precariously positioned between the hourly resistance and the more significant daily resistance, indicating a zone of high contention.
Navigating the Crossroads: The Neutral Trend Dilemma
The prevailing neutral trend, as indicated by the 50% strength across all analyzed timeframes, is the defining characteristic of the current XAGUSD market. This neutrality is not a static state but rather a dynamic equilibrium where opposing forces are locked in a struggle. On the 1-hour chart, the aggregate signal is "BUY" (6 buys, 2 sells), suggesting short-term optimism. This is likely driven by factors such as the recent upward movement and the positive MACD momentum. Traders looking for immediate opportunities might be drawn to this short-term bullish bias, anticipating a move towards the $58.79 or $58.85 resistance levels. The RSI at 56.44, while in neutral territory, shows a slight upward inclination, further supporting this short-term bullish narrative. The ADX at 25.95 also confirms a trend is in play, albeit one that could easily shift.
However, the narrative shifts dramatically when we extend our view to the 4-hour and daily charts. Both timeframes carry an aggregate "SELL" signal, reflecting underlying weakness and a potential for a downward correction. The 4H RSI at 46.52 and the daily RSI at 41.63 are both below the 50 mark, indicating bearish momentum. The MACD on these longer timeframes, while still showing positive momentum, is positioned in a way that suggests it could soon cross below the signal line, especially if the price fails to advance significantly. The ADX on the daily chart at 38.11 signifies a strong downtrend, even though the 4H ADX at 22.55 suggests this trend is currently in a moderate phase. This conflict between short-term bullishness and medium-to-long-term bearishness creates a challenging environment. It implies that any gains made on the hourly chart could be short-lived, potentially leading to a reversal as sellers step in to defend the higher price levels and capitalize on the broader bearish sentiment.
The correlation with broader market movements, particularly the US Dollar Index (DXY) and S&P 500, is also critical. The DXY is currently trading at 100.9, showing a slight decline. Historically, a weaker dollar often correlates with higher silver prices, as commodities become cheaper for holders of other currencies. The current DXY movement from a peak around 101.33 to 100.9 could be providing some support to XAGUSD. However, this relationship is not always linear, and other factors can override it. The S&P 500 is showing strength, trading at 6572.87, which generally indicates a risk-on appetite. In such environments, safe-haven assets like silver might see less demand, unless specific inflation concerns or geopolitical tensions are at play. Recent news indicates that US CPI data is expected to show cooling inflation due to falling fuel prices, which could influence Fed policy expectations and, consequently, the DXY and gold prices. While this CPI data is more directly impactful on gold (XAUUSD), its implications can ripple through to silver.
Technical Scenarios for XAGUSD at $58.76
Given the conflicting signals across different timeframes and indicators, several scenarios are plausible for XAGUSD. The neutral trend suggests a period of consolidation or a potential breakout from the current range. Traders must remain agile and prepared for a market that could move in either direction, depending on which timeframe's signals ultimately dominate.
Bearish Reversal: Sellers Take Control
65% ProbabilityConsolidation: Range-Bound Action
25% ProbabilityBullish Continuation: Breaking Higher
10% ProbabilityThe predominant scenario favors a bearish outcome, reflecting the weight of the longer-term technical signals. The daily chart's strong downtrend ADX of 38.11 and the RSI below 50 are significant indicators that cannot be ignored. While the 1-hour chart might offer short-term trading opportunities for nimble traders, the risk of a broader pullback appears more probable. The key will be the price action around the $58.71 resistance. If silver struggles to break through this level, especially with any negative news concerning inflation or dollar strength, a move down towards the $58.44 support and potentially lower seems likely. The $58.32 level on the 4H chart would be the next significant area to watch for a bounce, but a sustained break below that could signal a deeper correction towards the $57.94 and $57.28 levels.
On the flip side, a bullish continuation scenario hinges on overcoming the immediate hourly resistance at $58.71. This would require strong buying conviction, possibly fueled by unexpected positive news or a significant weakening of the US Dollar. If XAGUSD can decisively break and hold above $58.71, the next targets would be $58.79 and then $58.85. However, the daily resistance at $58.90 looms large, and breaking through this level would require a substantial shift in market sentiment. The neutral scenario, where XAGUSD consolidates between $58.44 and $58.71, is also a strong possibility, especially if upcoming economic data provides no clear direction or if market participants adopt a wait-and-see approach ahead of significant events. This consolidation phase could lead to a build-up of energy for a more decisive move later.
The current technical setup for XAGUSD at $58.76 presents a classic case of a market at a crossroads. The short-term bullish signals on the 1-hour chart are battling against the more dominant bearish undertones on the higher timeframes. The ADX readings, while strong, are also conflicting across timeframes, suggesting that the trend is not yet firmly established in either direction. This makes risk management absolutely critical. Traders should be looking for clear confirmations before committing to a position. A break above hourly resistance with confirming volume and a positive daily close would validate a bullish move. Conversely, a failure at resistance and a break below hourly support, especially with increased selling volume, would reinforce the bearish outlook.
Economic Calendar and Geopolitical Context
The economic calendar is a crucial element influencing XAGUSD's price action. The upcoming US CPI data is a major event that could significantly impact the dollar and, by extension, silver. Expectations are for cooling inflation due to falling fuel prices, as reported by sources like Reuters. If the actual CPI data comes in lower than expected, it could weaken the US Dollar, potentially providing a tailwind for XAGUSD. Conversely, higher-than-expected inflation could strengthen the dollar and put pressure on silver. The market's reaction will depend not only on the data itself but also on how it shapes expectations for future Federal Reserve policy. Any hints of a more hawkish stance from the Fed could counteract the positive effects of lower inflation on silver.
Geopolitical tensions also continue to play a background role, though perhaps less prominently in the immediate price action at $58.76. Events in the Middle East, while not directly impacting silver as much as oil, can contribute to a general sense of risk aversion or inflation concerns, which sometimes boosts demand for safe-haven assets like gold and, by extension, silver. However, with the S&P 500 showing strength, the current market sentiment appears to be leaning towards risk-on, which might temper safe-haven demand for silver. The correlation with oil prices, currently showing a rising trend (Brent at $84.04, WTI at $79.76), is also noteworthy. Higher oil prices can contribute to inflation expectations, which historically benefits precious metals. However, the extent to which this is currently priced into XAGUSD remains to be seen.
Trader's Roadmap: Key Levels and Actions
For traders operating on the 1-hour timeframe, the immediate focus is on the $58.71 resistance and $58.57 support. A break above $58.71 with confirmation could offer a short-term long opportunity targeting $58.79 and $58.85. Conversely, a break below $58.57 could signal a short-term short opportunity targeting $58.44. For those with a 4-hour or daily perspective, the situation is more cautious. The resistance at $58.90 on the daily chart is a significant barrier. A sustained move above this level would be required to confirm a more robust bullish reversal. On the downside, the $58.32 and $57.94 support levels on the 4-hour chart are key areas to watch for potential buying interest if a pullback occurs. The overall neutral trend suggests that range trading or waiting for a clear breakout might be the most prudent strategies.
The conflicting signals from technical indicators across different timeframes necessitate a disciplined approach. Over-reliance on any single indicator or timeframe could lead to erroneous trades. For instance, acting solely on the 1-hour "BUY" signal without considering the daily "SELL" signal could result in being caught in a reversal. Similarly, focusing only on the daily bearish trend might miss short-term upward opportunities. Therefore, confirming signals across at least two timeframes, or waiting for price action to decisively break key levels, is advisable. The ADX readings, while indicating trend strength, are also inconsistent, further emphasizing the need for caution and confirmation.
Economic Calendar Watchlist
The primary economic event to monitor is the US CPI data release. Its outcome will likely dictate the short-to-medium term direction of the US Dollar and, consequently, XAGUSD. Traders should also keep an eye on any statements from Federal Reserve officials, as their commentary on inflation and monetary policy can significantly influence market sentiment. Any unexpected geopolitical developments could also trigger safe-haven flows, potentially benefiting silver, but this remains a secondary factor unless major escalations occur. The ongoing analysis of oil prices will also be important, as they contribute to inflation expectations.
Frequently Asked Questions: XAGUSD Analysis
What happens if XAGUSD breaks below the $58.44 support level?
A break below the $58.44 support on the 1-hour chart would invalidate short-term bullish signals and likely trigger a move towards the $58.32 level on the 4-hour chart. This would reinforce the bearish sentiment seen on longer timeframes.
Is RSI at 56.44 a buy signal for XAGUSD at current $58.76 levels?
An RSI of 56.44 on the 1-hour chart is in neutral territory with a slight upward lean, suggesting some bullish momentum but not an outright buy signal. It indicates room for upward movement before reaching overbought conditions, but longer-term RSIs are lower, suggesting caution.
How will the US CPI data affect XAGUSD this week?
If US CPI data shows cooling inflation, it could weaken the dollar and support XAGUSD. Conversely, higher-than-expected inflation might strengthen the dollar and pressure silver. The market's reaction will depend on the deviation from expectations and its impact on Fed policy.
Should traders consider buying XAGUSD near $58.76 resistance given the neutral trend?
Buying near resistance at $58.76 carries significant risk due to the neutral to bearish longer-term trend. A confirmed breakout above $58.71 resistance with follow-through is needed for a higher probability bullish setup; otherwise, consolidation or a pullback to $58.57 is more likely.
Track markets in real-time
AI-powered analysis, technical indicators and real-time price data.
Join Our Telegram Channel
Breaking market news, AI analysis and trading signals instantly.
Join Channel