

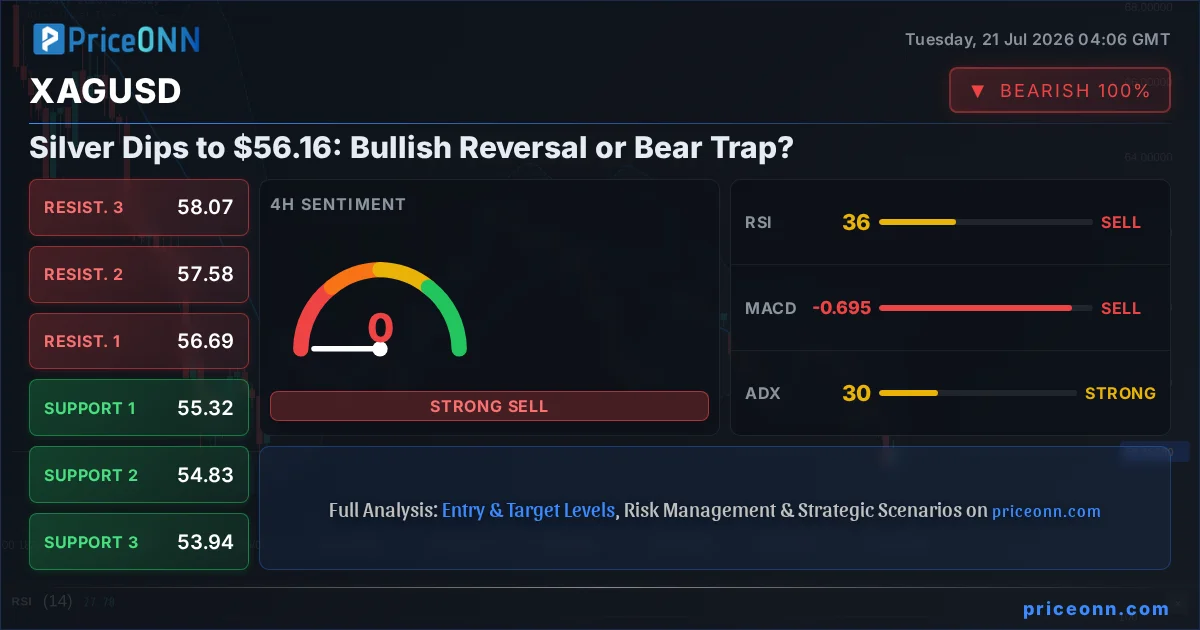
The tug-of-war in the silver market is intensifying as the precious metal touches $56.16, a level that has historically acted as a crucial battleground for bulls and bears. With a significant daily drop of -1.46% and the price currently below its 1-hour, 4-hour, and daily mid-Bollinger bands, the immediate technical picture suggests bearish pressure. However, the $56.16 level itself presents a critical juncture. This XAGUSD today analysis delves into whether this dip represents a fleeting opportunity for buyers or the harbinger of further declines, examining the confluence of indicators and price action to decipher the path forward.
- XAGUSD currently trades at $56.16, a key support level showing significant daily decline.
- The RSI at 37.11 (1H) and 35.87 (4H) indicates oversold conditions are approaching, while the 1D RSI sits at 34.24, nearing oversold territory.
- ADX readings across timeframes (35.29 on 1H, 29.63 on 4H, 42.27 on 1D) suggest a strong existing trend is in play, currently bearish.
- Key support levels to watch are $55.97 (1H), $55.32 (4H), and $56.54 (1D), with resistance at $56.52 (1H), $56.69 (4H), and $58.99 (1D).
- The US Dollar Index (DXY) at 100.7 shows a strengthening dollar, which typically exerts downward pressure on silver prices.
The Bearish Case: Silver's Slide Continues
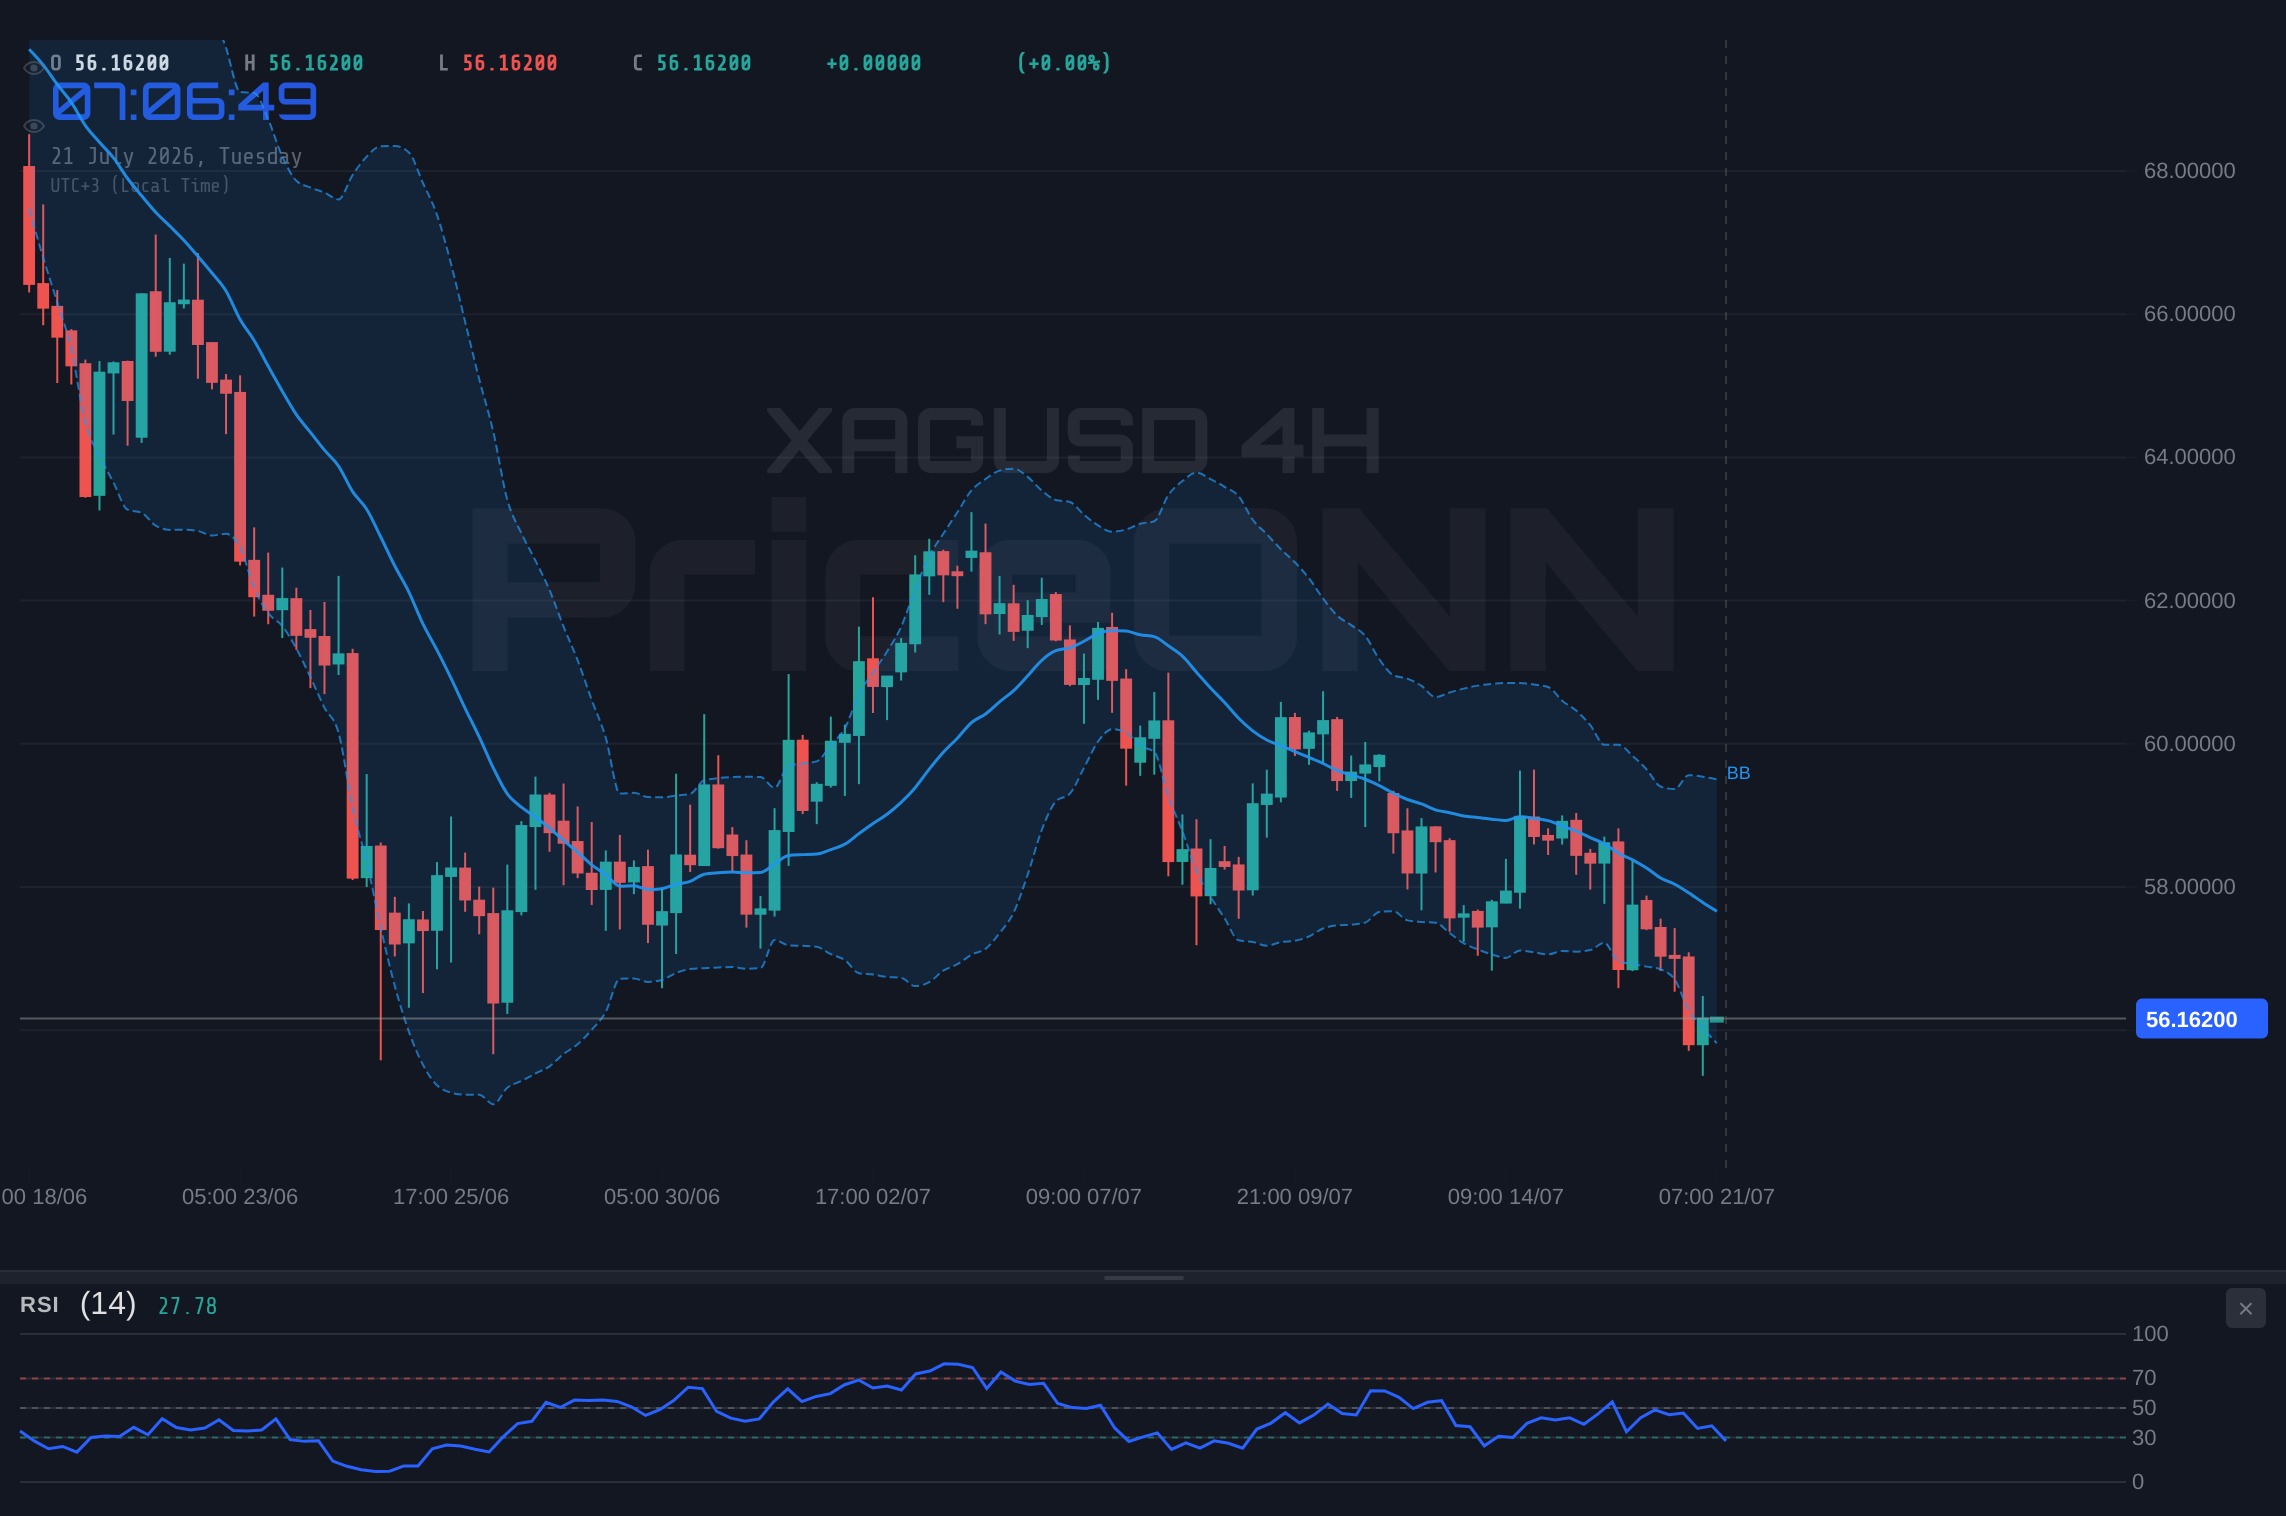
The narrative for further downside in silver is compelling, primarily driven by its current price action and the broader macroeconomic environment. On the 1-hour chart, XAGUSD is firmly below the middle Bollinger Band, a classic sign of bearish momentum, with the RSI lingering at 37.11. While not yet in deeply oversold territory, this points to sellers maintaining control. The MACD indicator on the 1-hour timeframe further corroborates this, showing negative momentum with the MACD line below its signal line. This isn't just a fleeting moment; the 4-hour chart paints an even starker picture. Here, the trend is definitively bearish with 100% strength, the RSI is at 35.87, and the ADX reading of 29.63 indicates a robust trend is in motion. The Stochastic oscillator on this timeframe also aligns, with %K at 14.97 and %D at 23.19, signaling a bearish crossover and reinforcing the downward bias.
The daily chart, while showing slightly less aggressive trend strength (95%), continues the bearish theme. The RSI at 38.86, while neutral, is trending downwards, suggesting that any bounces are likely to be sold into. The MACD on the daily, however, shows positive momentum, which could represent a divergence or simply a lagging indicator before the downtrend reasserts itself more forcefully. The Stochastic on the daily is also bearish, with %K at 26.18 and %D at 44.73. The ADX at 39.16 on the daily timeframe confirms a strong trend, and given the overall direction, it's a strong downtrend. This consistent bearish signal across multiple timeframes, particularly the 4-hour and daily, suggests that the path of least resistance for silver is currently downwards. The immediate support at $55.97 on the 1-hour chart and $55.32 on the 4-hour chart are the next logical destinations if the selling pressure intensifies.
The Bullish Counter-Argument: Support Levels and Divergence
Despite the prevailing bearish sentiment, there are several technical and fundamental factors that could spark a bullish reversal for silver. Firstly, the current price of $56.16 is approaching significant support levels. On the 1-hour chart, the first support is at $55.97, followed by $55.68. On the 4-hour chart, support lies at $55.32, and on the daily chart, the critical support is identified at $56.54. The fact that the price is hovering around these levels, particularly the $56.54 daily support, could act as a magnet for buyers looking for value. Historically, significant drawdowns often find their footing at these established support zones, leading to sharp V-shaped recoveries or at least a consolidation phase that precedes a potential uptrend.
Furthermore, while many indicators show bearish momentum, there are subtle signs of potential divergence. On the 1-hour chart, the Stochastic oscillator is showing a bullish signal with %K (40.52) crossing above %D (37.27). While this is a short-term signal and can be overridden by broader trends, it indicates that immediate selling pressure might be easing. On the daily chart, the MACD is showing positive momentum, which, if it diverges from price action, could signal an impending upward move. The ADX values, while indicating a strong trend, are not at extreme levels (e.g., above 50), suggesting that the trend might not be irreversible. A break above the immediate 1-hour resistance at $56.52, followed by a decisive move above the 4-hour resistance at $56.69, could signal the beginning of a short-term retracement or a more sustained bullish reversal. The key for bulls will be to reclaim the middle Bollinger Band on the 4-hour chart, which currently sits around $56.69.
Correlation Analysis: DXY and Equities
Understanding silver's price action in relation to other markets is crucial. The US Dollar Index (DXY) is currently trading at 100.7, showing a clear upward trend on the 1-hour chart and strength above its upper Bollinger Band. A strengthening dollar generally exerts downward pressure on dollar-denominated commodities like silver, as they become more expensive for holders of other currencies. The DXY's ascent to 100.7, with RSI at 56.6 and Stochastic in overbought territory, suggests continued dollar strength could be on the horizon, acting as a headwind for XAGUSD. This correlation is a significant factor for bears, as continued dollar appreciation would likely weigh on silver prices.
On the equity front, the S&P 500 is showing a mixed picture. On the 1-hour chart, it's in a strong uptrend (100% strength) with RSI at 70.95, nearing overbought conditions, and Stochastic showing a bearish signal. The daily chart, however, presents a bearish trend with RSI at 45.35. This divergence between short-term strength and longer-term weakness in equities could indicate a shift in risk appetite. If risk aversion grows and major indices like the S&P 500 and Nasdaq (currently showing bearish signals on the 1-hour and 4-hour charts) continue to fall, we could see a flight to safe-haven assets. While gold is typically the primary safe haven, silver can sometimes benefit from such flows, especially if inflation concerns resurface. However, the current strong dollar trend seems to be dominating, favoring a risk-off narrative that is negative for silver.
Economic Calendar and Geopolitical Context
The recent economic data provides context for the current market environment. New Zealand's CPI hit 4.1% year-on-year in the second quarter, aligning with expectations but reinforcing challenges for central banks grappling with inflation. While this specific data point might not directly impact XAGUSD, it highlights the persistent inflationary pressures globally, which traditionally benefit precious metals like silver. However, the broader narrative is currently dominated by central bank policy expectations. The strengthening US Dollar, evidenced by the DXY at 100.7, often reflects anticipation of tighter monetary policy or a 'higher for longer' interest rate scenario in the US. This environment is generally unfavorable for commodities that do not offer yield, like silver.
Geopolitically, renewed tensions between the U.S. and Iran have pushed WTI crude oil higher, as reported by ForexLive. While this could signal a broader increase in risk aversion and potentially boost safe-haven demand for precious metals, the immediate impact on silver appears muted. The correlation seems to be overshadowed by the stronger dollar and the technical downtrend in silver itself. Market participants are keenly watching for any escalation that could significantly disrupt energy supplies, a factor that would undoubtedly add a bullish premium to both gold and silver. However, as of now, the geopolitical risk premium doesn't appear to be a dominant driver for XAGUSD, with technicals and dollar strength taking precedence.
The Verdict: Bears Hold the Edge, But Watch the Support
The technical and macroeconomic landscape currently favors the bears in the XAGUSD market. The consistent bearish signals across multiple timeframes, particularly the strong downtrend indicated by the ADX on the 4-hour and daily charts, coupled with the strengthening US Dollar, present a formidable challenge for any bullish resurgence. The immediate support at $56.54 on the daily chart and $55.97 on the 1-hour chart are critical levels to monitor. A decisive break below $55.32 on the 4-hour chart would likely accelerate selling pressure, targeting lower levels. The RSI nearing oversold territory across timeframes (37.11 on 1H, 35.87 on 4H, 34.24 on 1D) suggests that while the downtrend is strong, the potential for a short-term bounce or consolidation increases as price approaches these lower support zones.
For bulls to regain control, they need to defend the $56.54 level decisively and push XAGUSD back above the 1-hour resistance at $56.52 and subsequently the 4-hour resistance at $56.69. A close above the 4-hour middle Bollinger Band would be a crucial confirmation. Until then, the risk remains skewed to the downside. The current ADX reading of 29.63 on the 4-hour timeframe indicates a strong trend is in place, and without clear divergence or a significant shift in macroeconomic drivers, the bearish momentum is likely to persist. Traders should exercise caution, manage risk diligently, and wait for clearer signals before committing to a direction.
Bearish Scenario: The Slide Continues
65% ProbabilityNeutral Scenario: Consolidation Around Support
25% ProbabilityBullish Scenario: Reversal from Support
10% ProbabilityFrequently Asked Questions: XAGUSD Analysis
What happens if XAGUSD breaks below the $55.97 support level?
A break below the $55.97 support on the 1-hour chart would likely accelerate selling pressure, triggering the bearish scenario. This could lead to a retest of the $55.32 support on the 4-hour chart, and potentially extend further down towards the $54.10 daily support level.
Should I consider buying XAGUSD at current levels around $56.16 given the approaching support?
Buying at current levels carries significant risk due to the prevailing bearish trend and strengthening DXY. While $56.54 on the daily chart is a key support, a more prudent approach would be to wait for confirmation of a bullish reversal, such as a bounce off this level with bullish divergence or a break above immediate resistance levels like $56.52.
Is the RSI at 34.24 on the daily chart a strong buy signal for XAGUSD?
An RSI reading of 34.24 is nearing oversold territory, indicating that selling momentum may be waning. However, it is not a standalone buy signal, especially with the ADX at 39.16 confirming a strong downtrend. Confirmation from price action, such as holding support and showing bullish divergence, would be needed to validate a potential reversal.
How will the current DXY strength at 100.7 affect XAGUSD's price action this week?
The strengthening US Dollar Index (DXY) at 100.7 generally exerts downward pressure on silver prices, as it makes dollar-denominated assets more expensive for foreign buyers. This macro factor supports the bearish outlook for XAGUSD and suggests that any significant bullish moves might be capped unless the DXY reverses sharply.
| Indicator | Value | Signal | Interpretation |
|---|---|---|---|
| RSI (14) | 37.11 | Bearish | Nearing oversold, but trend is down |
| MACD Histogram | -0.16 | Bearish | Negative momentum, below signal line |
| Stochastic | K:40.52, D:37.27 | Bullish Crossover | Short-term bullish signal on 1H |
| ADX | 35.29 | Strong Trend | Confirms existing trend (currently bearish) |
| Bollinger | Middle Band | Below | Price below middle band indicates bearish pressure |
Track markets in real-time
AI-powered analysis, technical indicators and real-time price data.
Join Our Telegram Channel
Breaking market news, AI analysis and trading signals instantly.
Join Channel