

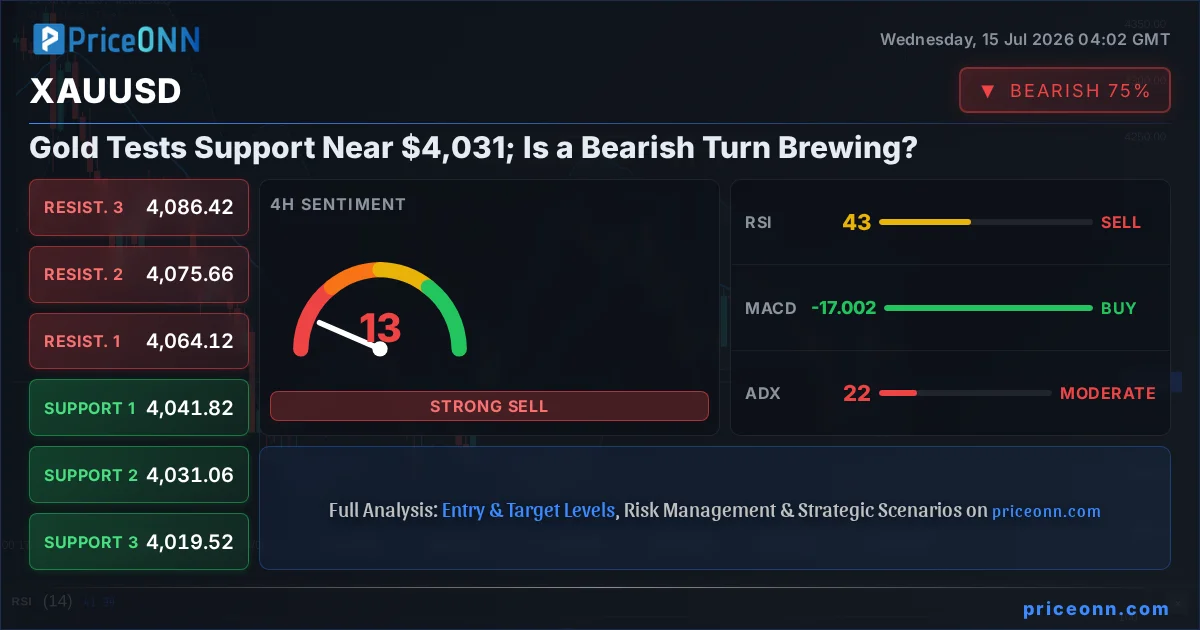
As the global financial stage presents a complex tableau of shifting economic winds, gold traders are keenly observing the precious metal's delicate dance around the critical $4,031.11 mark. The current price action for XAUUSD, currently hovering just above this psychological level, is not just a number; it's a battleground where macroeconomic forces clash with technical underpinnings. The recent market data paints a picture of cautious sentiment, with the Dollar Index (DXY) showing signs of resurgence and oil prices climbing, both typically acting as headwinds for gold. This confluence of factors suggests that while gold has held its ground, the path ahead is fraught with potential challenges, making the $4,031.11 level a pivotal point to watch for any significant directional shift.
- The RSI at 42.8 signals neutral momentum with a slight downward bias on the 1-hour chart for XAUUSD.
- Critical support for XAUUSD is currently eyed around $4,028.56, with a decisive break below this level potentially triggering further downside.
- The MACD histogram shows negative momentum on the 1H chart, indicating selling pressure is building.
- A strengthening DXY, currently at 100.82, is exerting pressure on gold prices, correlating with its inverse relationship.
The narrative shaping the gold market at this moment is one of conflicting signals and underlying pressures. While the precious metal has seen some resilience, the broader market context is increasingly leaning towards a bearish outlook for XAUUSD. The Dollar Index (DXY), a perennial antagonist to gold, has shown renewed strength, trading recently at 100.82. This upward tick in the dollar often correlates with a weakening gold price, as it makes dollar-denominated assets like gold more expensive for holders of other currencies. Furthermore, the price of oil, a key inflation indicator and a geopolitical risk barometer, is on the rise, recently trading at $84.52 for Brent crude. Rising oil prices can fuel inflation concerns, which historically supports gold as an inflation hedge, but in the current environment, they also signal potential economic headwinds and risk aversion, which can sometimes lead to a flight towards the dollar itself, creating a complex feedback loop that leaves gold in a precarious position.
The Macroeconomic Crosscurrents Affecting Gold
Examining the broader economic landscape reveals several key drivers influencing XAUUSD's current predicament. The US dollar's performance is paramount; as the DXY shows strength, it directly impacts gold's appeal. Recent data suggests a potential shift in market sentiment, with traders pricing in a less dovish stance from the Federal Reserve than previously anticipated. This has bolstered the dollar, creating an environment where gold struggles to find upward momentum. The interplay between interest rate expectations and currency strength is a dance gold is always sensitive to. Higher interest rates, or the anticipation thereof, tend to increase the opportunity cost of holding non-yielding assets like gold, making them less attractive compared to interest-bearing assets. This dynamic is currently at play, with market participants recalibrating their expectations for Fed policy, which is indirectly supporting the dollar and consequently pressuring gold prices downwards.
The energy market's influence cannot be overstated. Brent crude oil, currently trading around $84.52, has been on an upward trajectory. This rise is often linked to geopolitical tensions, supply concerns, or robust global demand. For gold, this presents a dual-edged sword. On one hand, rising oil prices can be seen as an inflationary signal, typically boosting gold's appeal as a safe-haven asset and inflation hedge. However, the current market interpretation seems to be leaning towards the risk-off sentiment that rising oil prices can sometimes represent. If oil prices surge due to geopolitical instability, it can indeed drive safe-haven demand for gold. Yet, if the surge is perceived as a drag on global economic growth, it might concurrently weaken risk appetite in broader markets, potentially leading to a broader deleveraging that includes gold, especially if the dollar remains strong.
Global risk sentiment, as indicated by indices like the S&P 500 (currently at 6572.87 and showing a daily rise of 0.74%) and the Nasdaq 100 (trading at 29816.07 with a 0.76% daily gain), is another critical factor. While these indices are currently in positive territory, suggesting a degree of risk-on sentiment, the underlying fragility can quickly shift. A sudden downturn in equities, perhaps triggered by inflation data or central bank hawkishness, would typically see investors flocking to safe-haven assets. Gold is often the primary beneficiary of such shifts. However, the strength of the dollar can sometimes mute this effect, as investors might opt for dollar-denominated safe havens like US Treasuries or even the dollar itself, rather than gold. The current market is finely balanced, with positive equity performance masking potential underlying anxieties about inflation and monetary policy, creating an uncertain environment for gold.
Technical Signals: A Mixed Picture for Gold
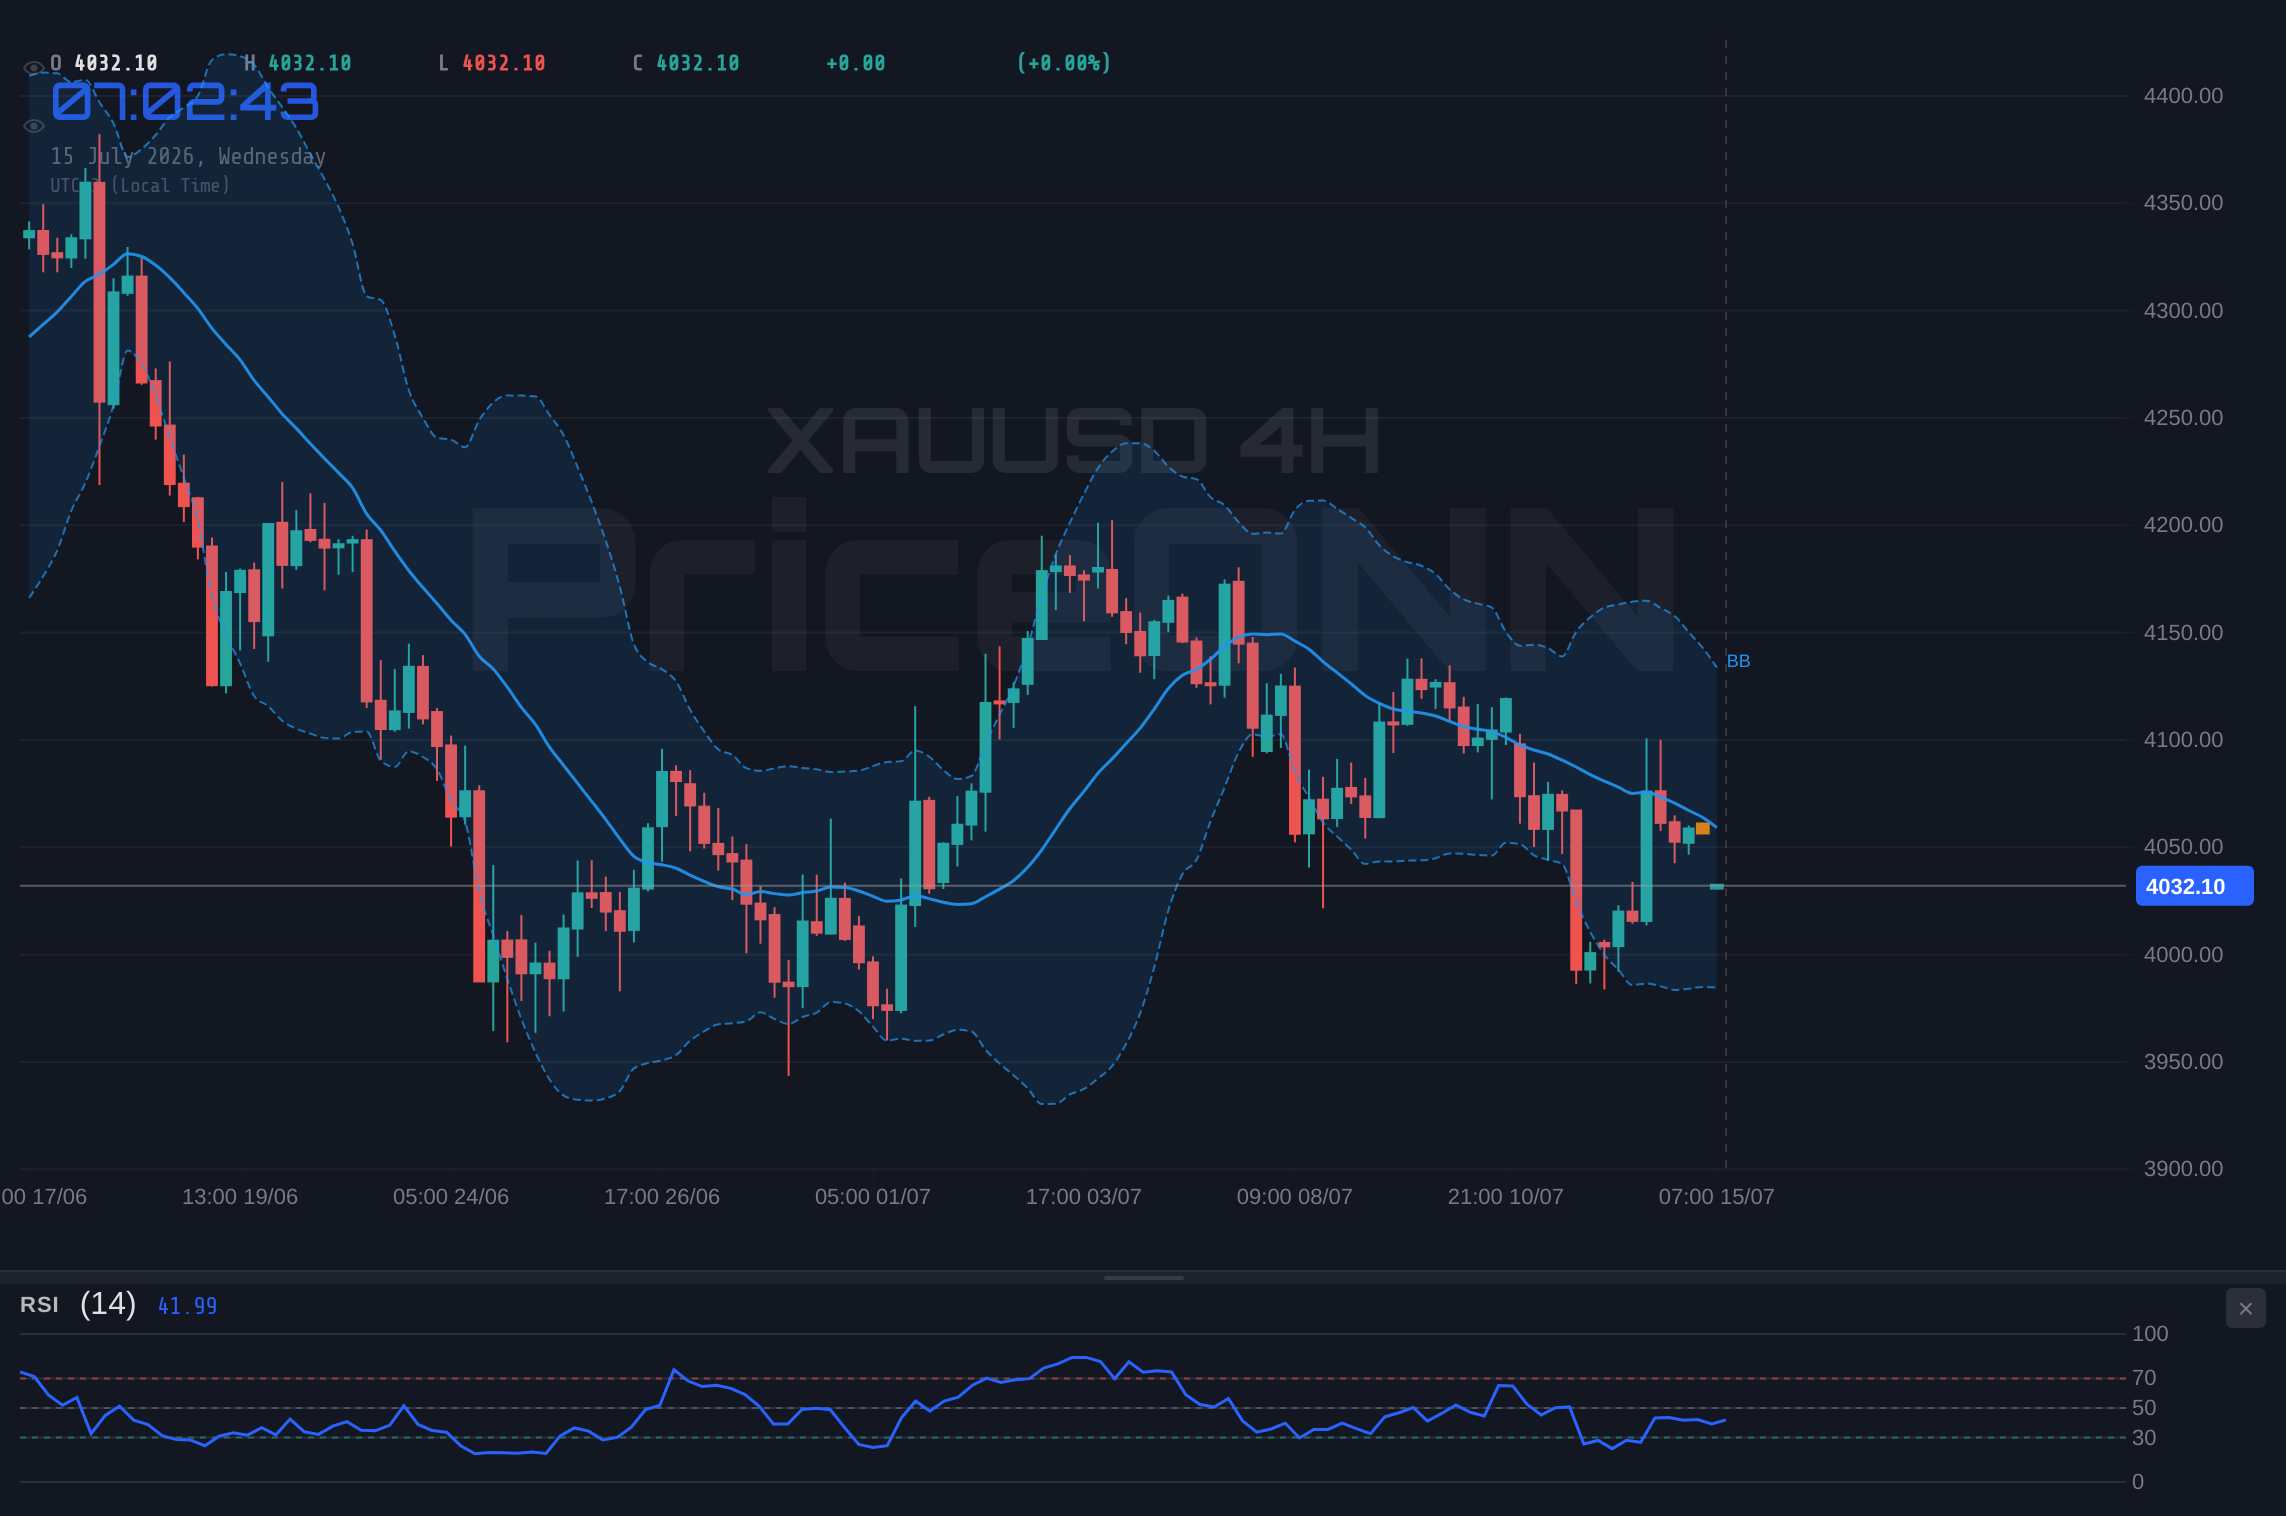
Delving into the technical indicators for XAUUSD reveals a complex and somewhat contradictory landscape, underscoring the current indecision in the market. On the 1-hour chart, the Relative Strength Index (RSI) stands at 42.8, firmly in neutral territory but with a discernible downward lean, suggesting that while not yet oversold, the momentum is not strongly bullish. The MACD indicator on this timeframe is below its signal line, painting a picture of negative momentum, which aligns with the prevailing bearish bias. The Bollinger Bands are trading below the middle band, reinforcing the short-term bearish sentiment. However, the Stochastic Oscillator is showing K=10.81 and D=19.68, indicating that gold is in the oversold region on this timeframe, a signal that often precedes a bounce, though it can persist in strong downtrends.
The ADX on the 1-hour chart is at 27.26, indicating a strong downward trend is in play. This suggests that the bearish pressures are significant and have directional conviction. The general signal across multiple timeframes leans towards 'SELL', with a prominent aggregation of sell signals on the 1-hour and daily charts. However, the 4-hour chart presents a slightly different perspective. Here, the RSI is at 42.99, still in neutral territory, but the MACD is positive and above its signal line, suggesting positive momentum on this intermediate timeframe. The Stochastic Oscillator shows K=55.22 and D=44.13, indicating a bullish signal with the %K line above the %D line. While the Bollinger Bands remain below the middle band, hinting at a bearish inclination, the ADX at 21.55 suggests a moderately trending market, less aggressive than the 1-hour chart. This divergence between short-term and medium-term indicators highlights the choppy nature of the current gold market.
Looking at the daily timeframe, the overall trend is classified as 'Downtrend' with a strength of 89%, which is a significant indicator of the prevailing market direction. The RSI is at 40.49, again in neutral territory but trending downwards. The MACD is positive and above its signal line, showing positive momentum on the daily chart, which contrasts with the 1-hour chart's negative momentum. The Bollinger Bands continue to hug the lower side of the middle band, confirming the bearish bias. However, the Stochastic Oscillator on the daily chart shows K=23.3 and D=50.72, indicating a bearish signal with the %K below the %D, and it's approaching oversold territory. The ADX at 38.49 signifies a strong downtrend, aligning with the overall trend classification. The aggregate 'SELL' signals across the daily chart reinforce the notion that the path of least resistance for gold remains downwards, despite some conflicting signals on shorter timeframes.
The Critical Juncture at $4,028.56
The immediate focus for gold traders must be on the support level at $4,028.56. This is not just an arbitrary number; it represents a point where buying interest has historically emerged, and its defense is crucial for any potential stabilization or reversal. If XAUUSD fails to hold this level, the next significant support is seen at $4,022.07, followed by $4,015.38. A break below these levels would confirm a deepening bearish trend and could trigger a cascade of selling as stop-loss orders are likely to be activated. The ADX on the 1-hour chart at 27.26 indicates a strong trend is already in motion, and a breach of these supports would likely see that trend strength intensify. The general 'SELL' signal across most timeframes, particularly the daily, suggests that the market is primed for further downside if these critical support levels are breached.
Conversely, for the bulls to regain any semblance of control, gold needs to break through the immediate resistance at $4,041.74. A sustained move above this level, ideally accompanied by increasing volume and a confirmation from indicators like the RSI moving out of neutral territory and above 50, would be the first sign of a potential trend change. The MACD on the 1-hour chart currently shows negative momentum, so a break above resistance would need to be accompanied by a shift in this indicator, perhaps a MACD line crossing above its signal line. The 4-hour chart, with its slightly more positive momentum signals, might offer a glimpse of potential recovery, but it would require breaking through its own resistance levels, starting with $4,041.74 and then $4,048.43, to suggest a more sustained upward move. The overall bearish sentiment, especially on the daily chart, means that any upward move is likely to be met with selling pressure as traders look to exit positions.
Trade Recommendation Decision: Watch Zone
The current technical and market conditions place XAUUSD in a 'Watch Zone,' with a low trade recommendation score of 2 out of 8. The ADX reading of 21.55 on the 4-hour chart indicates a moderate trend, not yet decisive enough for a strong conviction trade. While there are some conflicting indicator signals, the overall daily trend and the majority of short-term signals lean bearish. The Stochastic Oscillator on multiple timeframes is either in extreme zones (oversold on 1H) or showing bearish signals, suggesting that entry timing is uncertain and potentially risky. Therefore, the immediate recommendation is to observe the price action, particularly around the key support level of $4,028.56. A valid setup for a potential short trade would emerge if XAUUSD decisively breaks and closes below this critical support level on a significant timeframe, such as the 4-hour or daily chart, accompanied by increasing volume and confirmation from momentum indicators like the MACD showing sustained negative pressure.
What Happens if XAUUSD Breaks Below $4,028.56?
If gold closes decisively below the $4,028.56 support level, particularly on the 4-hour or daily chart, it would signal a continuation of the bearish trend. This breakdown would likely trigger stop-loss orders for traders who were anticipating a hold at this level, potentially accelerating the price decline. The next immediate downside targets would be $4,022.07 and then $4,015.38. The strong ADX reading of 38.49 on the daily chart supports the idea that a break of support could lead to a significant downward move, as the trend is already established and strong. This scenario would be further validated if the DXY continues its upward trajectory, perhaps on stronger-than-expected US economic data, and if oil prices, despite their rise, are interpreted as a sign of slowing global demand rather than pure inflation hedge fuel.
Is RSI at 42.8 a Sell Signal for XAUUSD?
An RSI reading of 42.8 on the 1-hour chart is not inherently a sell signal. It indicates neutral momentum with a slight bearish bias, meaning that sellers have a marginal edge but are not in full control. A true sell signal from RSI would typically involve it being in overbought territory (above 70) and then turning down, or showing bearish divergence. Currently, the RSI is closer to the midpoint and trending downwards, suggesting that the bearish sentiment is building but hasn't reached a point of exhaustion or extreme selling pressure that would typically prompt an immediate reversal. Therefore, while the RSI reading contributes to the overall bearish picture, it requires confirmation from other indicators and price action, such as a break of support, to be considered a definitive sell signal.
How Will the DXY's Strength Affect Gold Prices?
The Dollar Index (DXY) is currently trading at 100.82, showing upward momentum. Historically, there is an inverse correlation between the DXY and gold prices; when the dollar strengthens, gold tends to weaken, and vice versa. This is because gold is priced in dollars, making it more expensive for buyers using other currencies when the dollar is strong. Furthermore, a stronger dollar can be a sign of global economic uncertainty, leading investors to favor dollar-denominated assets like US Treasuries. If the DXY continues to rise, driven by factors like higher US interest rate expectations or safe-haven flows, it will likely exert continued downward pressure on XAUUSD, making it harder for gold to find significant upward traction.
What is the XAUUSD Price Forecast if Support at $4,028.56 Fails?
If the critical support level at $4,028.56 fails to hold, the immediate price forecast for XAUUSD would be bearish. The next significant support levels to watch would be $4,022.07, followed by $4,015.38. A confirmed break below $4,028.56, especially with strong volume and bearish confirmation from indicators like the MACD and a high ADX reading (indicating a strong trend), could signal a move towards the daily support at $3,990.67. The overall trend on the daily chart is already downwards, and a breach of this short-term support would reinforce that outlook, suggesting further downside potential in the near to medium term.
Navigating the Uncertainty: A Trader's Perspective
From a trader's perspective, the current environment for XAUUSD demands patience and a disciplined approach. The conflicting signals across different timeframes, coupled with the macroeconomic crosscurrents, suggest that the market is in a state of flux. Aggressively shorting gold without a clear break of support could be premature, as oversold conditions on shorter timeframes might lead to temporary bounces. Conversely, buying into the current weakness seems ill-advised given the strong daily downtrend and the bullish dollar narrative. The most prudent strategy appears to be a 'wait-and-see' approach, focusing on the key support level around $4,028.56. A confirmed break below this level would present a clearer shorting opportunity, while a strong bounce and subsequent break above the $4,041.74 resistance, accompanied by positive shifts in momentum indicators and a weakening dollar, could signal a potential long entry. Risk management remains paramount; any trades should be initiated with strict stop-loss orders placed logically beyond the identified support or resistance levels.
Bearish Scenario: Downside Pressure Mounts
65% ProbabilityNeutral Scenario: Consolidation Around $4,031
25% ProbabilityBullish Scenario: Support Holds, Rebound Begins
10% ProbabilityFrequently Asked Questions: XAUUSD Analysis
What happens if XAUUSD breaks below $4,028.56 support?
If XAUUSD breaks decisively below $4,028.56, expect accelerated selling pressure, potentially targeting $4,022.07 and $4,015.38. The daily chart's strong downtrend (ADX at 38.49) would likely be confirmed, reinforcing a bearish outlook.
Is RSI at 42.8 a sell signal for XAUUSD right now?
An RSI of 42.8 on the 1-hour chart indicates neutral momentum with a bearish bias, not an outright sell signal. It suggests selling pressure is building but lacks the confirmation of extreme overbought conditions or divergence typically needed for a strong reversal signal.
How will the DXY's current strength near 100.82 affect gold prices?
The strengthening DXY at 100.82 typically exerts downward pressure on XAUUSD due to the inverse relationship. A stronger dollar makes gold more expensive for foreign buyers and can signal a preference for dollar-denominated assets, hindering gold's upward potential.
What is the XAUUSD price forecast if the $4,031.11 level fails to hold?
If the current price around $4,031.11 gives way, the immediate forecast is bearish, with key levels to watch at $4,028.56, $4,022.07, and $4,015.38. A sustained move below $4,028.56 would confirm the daily downtrend and suggest further declines.
Track markets in real-time
AI-powered analysis, technical indicators and real-time price data.
Join Our Telegram Channel
Breaking market news, AI analysis and trading signals instantly.
Join Channel