

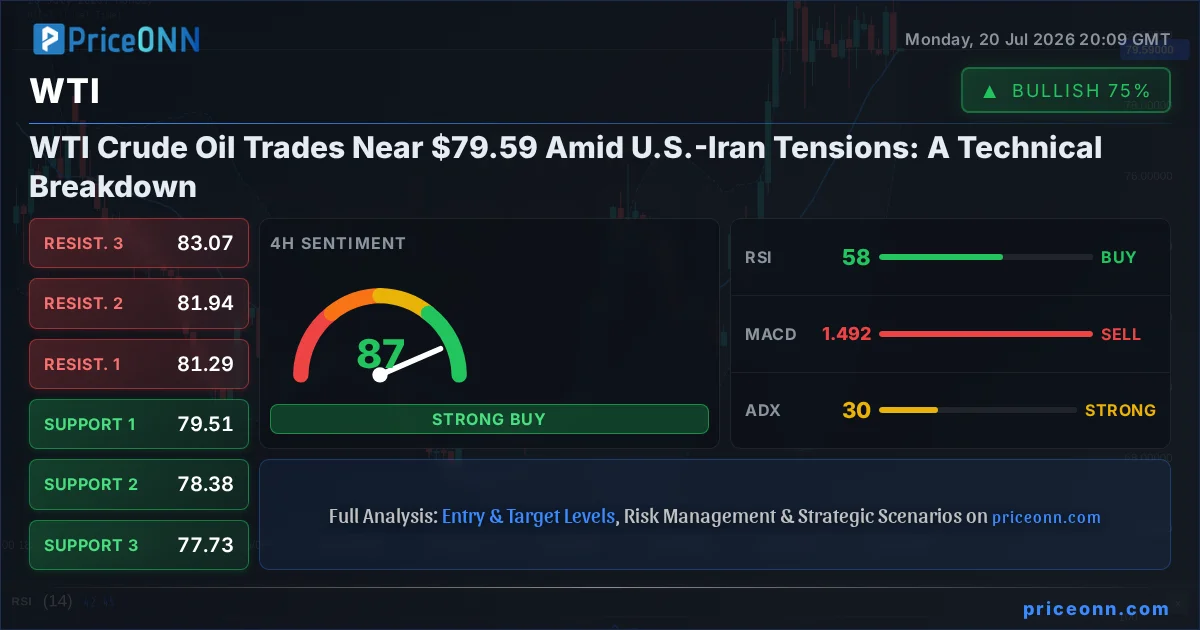
The energy markets are once again under the spotlight, with WTI crude oil finding itself in a precarious position around the $79.59 mark. This isn't just another trading day; it's a confluence of escalating geopolitical tensions, particularly between the U.S. and Iran, and underlying technical signals that demand attention. As traders grapple with the potential for supply disruptions stemming from the Middle East, the question isn't just *if* crude prices will move, but *how far* and *in which direction*. My analysis today dives deep into the intricate dance between these factors, aiming to provide a clear roadmap for navigating this complex landscape.
- WTI crude oil is trading near $79.59, influenced by rising U.S.-Iran tensions and market sentiment.
- The 1-hour RSI at 46.91 suggests a neutral stance but with a downward lean, while the 4-hour RSI at 58.47 indicates a more bullish inclination.
- Key support for WTI is identified at $79.23, with critical resistance looming at $80.43.
- The Dollar Index (DXY) at 100.70 shows strength, potentially capping further upside for oil prices.
- Geopolitical developments, especially concerning Iran, are the primary drivers, overshadowing some technical indicators.
Geopolitical Storm Clouds Gather Over Crude Oil
The price action in WTI crude oil is currently being heavily dictated by the ever-present specter of geopolitical instability, with the latest escalations between the United States and Iran acting as a significant catalyst. News reports from July 20th, such as the one detailing renewed tensions pushing WTI higher as stocks fell, underscore the market's sensitivity to this particular dynamic. The core fear is that any direct confrontation or significant disruption in the Strait of Hormuz, a critical chokepoint for global oil supply, could trigger a sharp and potentially sustained rally in prices. This is not merely theoretical; historical precedent shows that such events can lead to rapid price spikes, often amplified by speculative trading and a rush for safe-haven assets, which ironically can sometimes include oil itself in the short term due to supply fears. The market's reaction, even to the *possibility* of disruption, is a testament to the delicate balance of global energy security. When we see headlines like Brent briefly breaking $90 after fresh Iran war escalation, it highlights how sensitive the market remains to any perceived threat to supply routes.
This geopolitical risk premium is difficult to quantify but impossible to ignore. It adds a layer of complexity that technical analysis alone cannot fully capture. While chart patterns and indicator readings provide valuable insights into market psychology and potential price levels, they are often secondary to the overwhelming influence of major geopolitical events. The current situation demands that traders and analysts alike maintain a heightened awareness of news flow from the Middle East, understanding that a single headline could dramatically alter the price trajectory for crude. The market's pricing in of this risk is evident, but the extent to which it is fully priced in remains a subject of debate, suggesting that further volatility is likely as events unfold.
Technical Indicators: A Mixed Signal Amidst the Noise
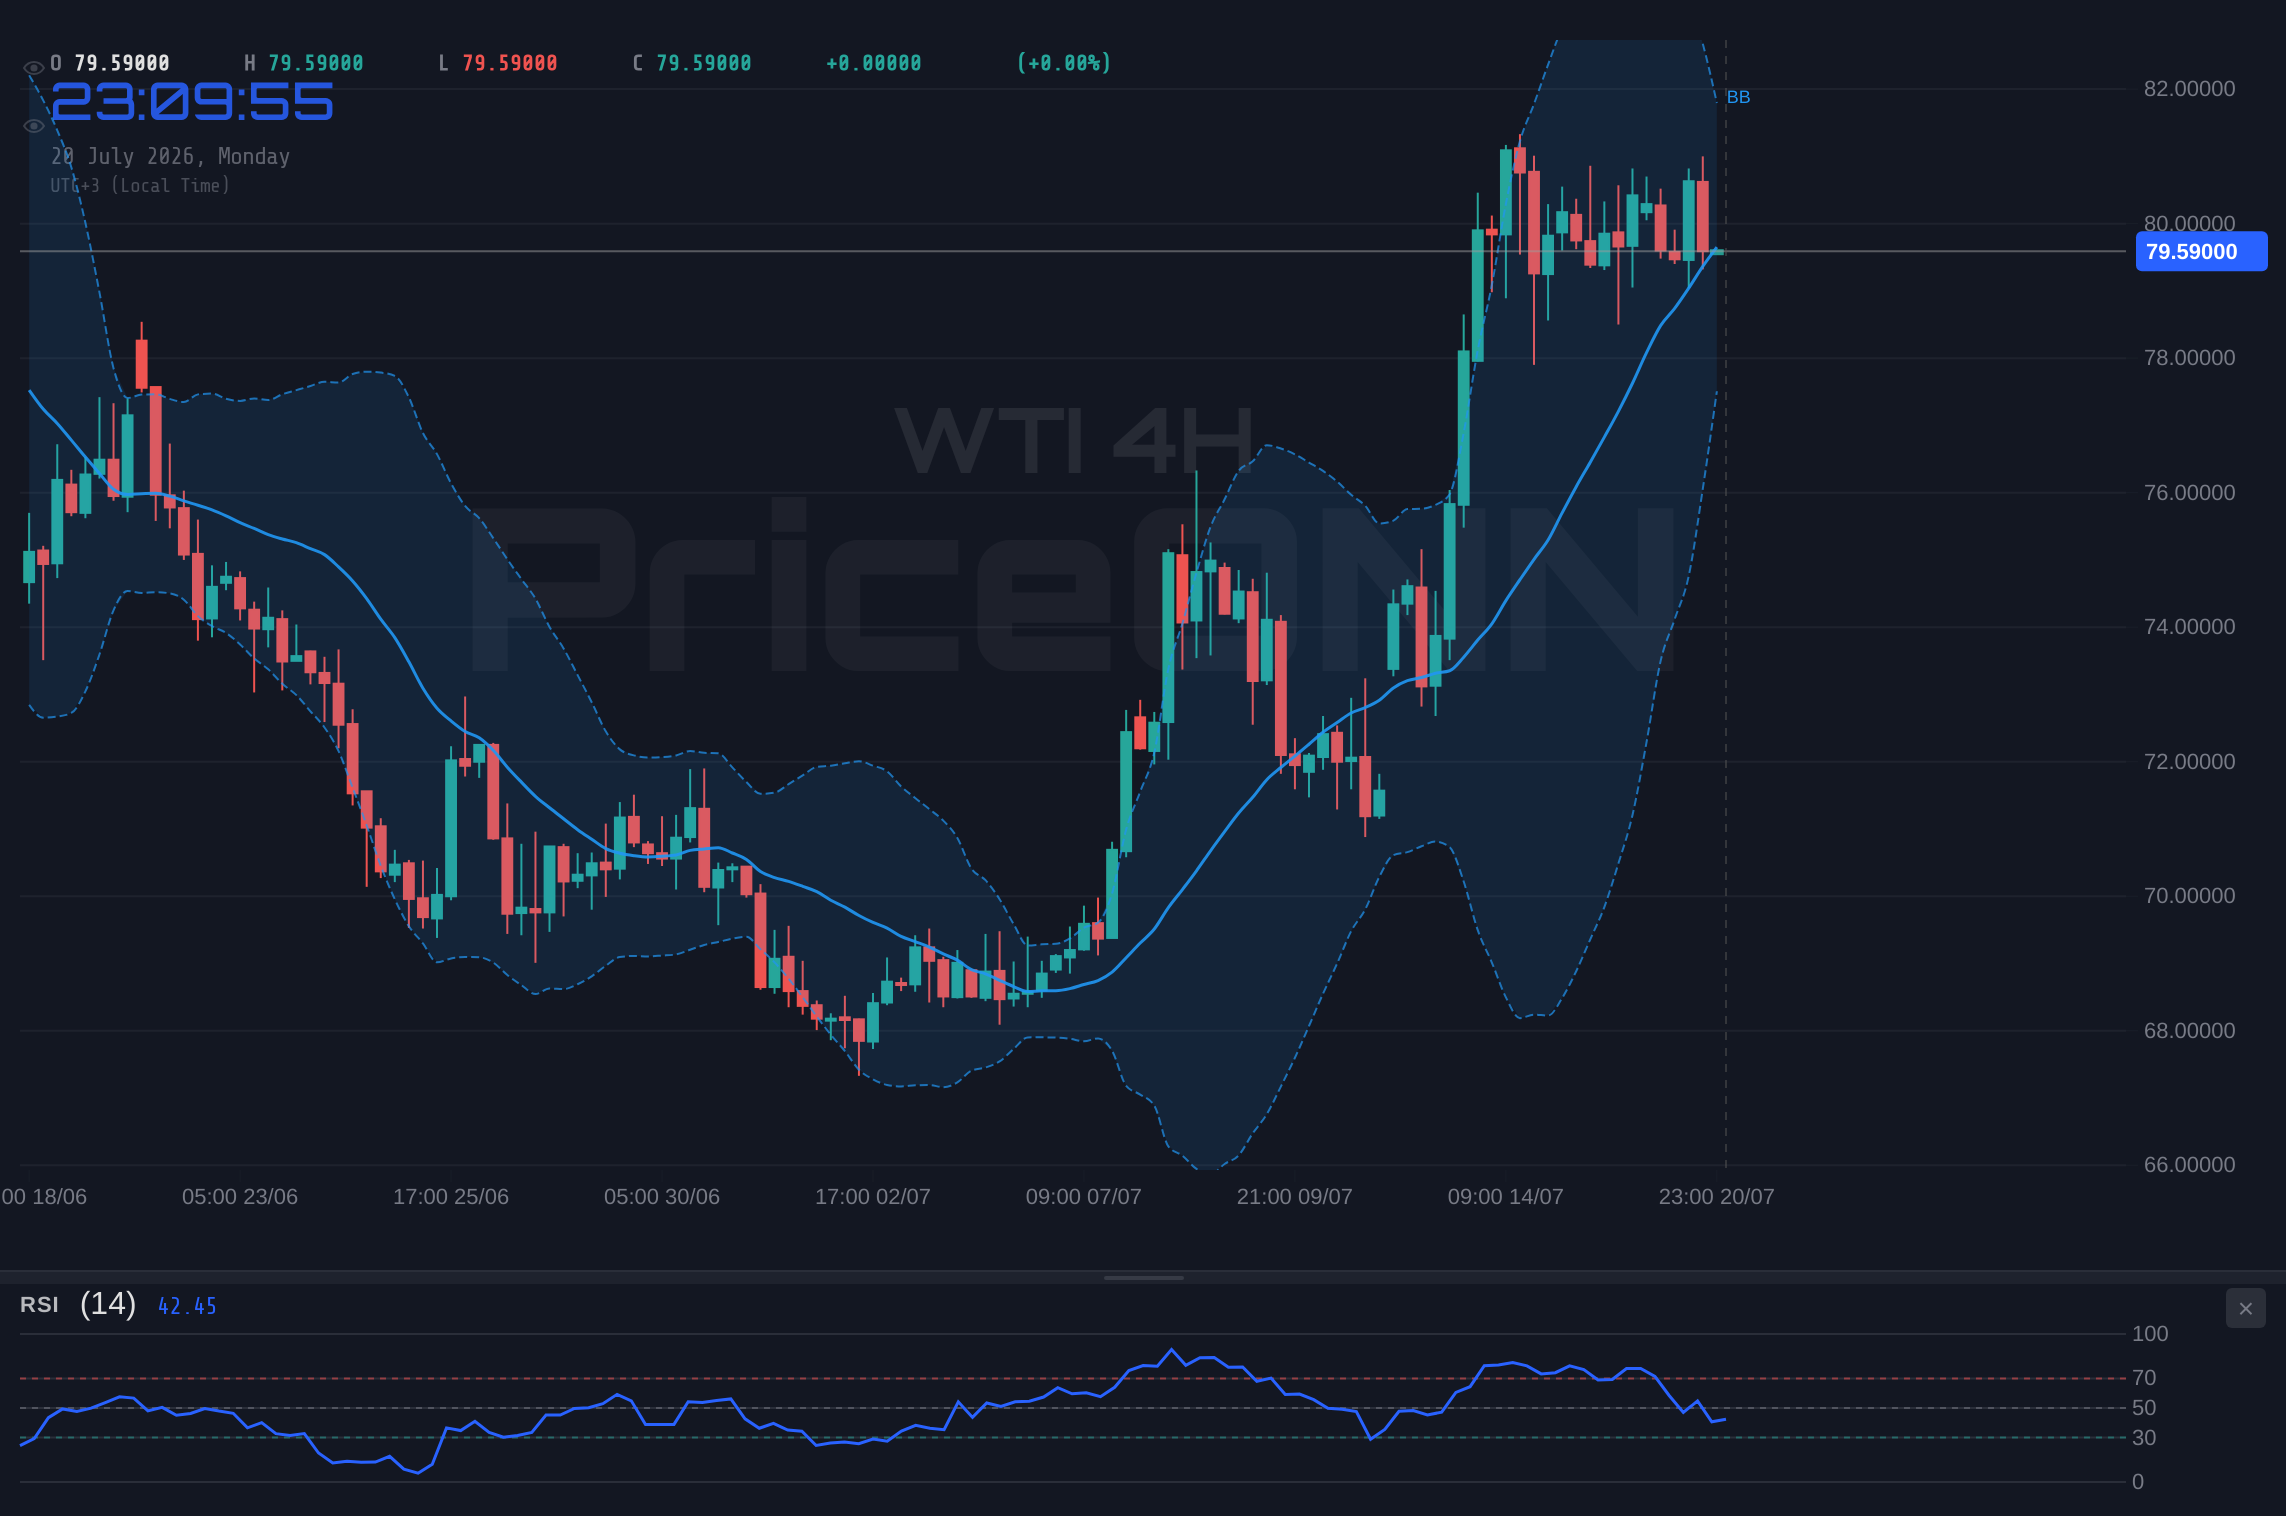
Diving into the technicals, the picture for WTI crude oil presents a fascinating, albeit mixed, signal across different timeframes. On the 1-hour chart, the Relative Strength Index (RSI) stands at 46.91. This reading places it firmly in neutral territory, but with a slight downward lean, suggesting that while the immediate selling pressure might be waning, there isn't a strong bullish conviction building just yet. The Moving Average Convergence Divergence (MACD) also indicates negative momentum, with the MACD line below its signal line, reinforcing this cautious short-term outlook. However, the Stochastic Oscillator, with K at 28.74 and D at 52.74, is showing a potential for an upward move, hinting at oversold conditions that could lead to a short-term bounce. The Average Directional Index (ADX) at 10.18 signifies a very weak trend, indicating a lack of strong directional conviction in the immediate term, which aligns with the choppy price action.
Shifting to the 4-hour timeframe, the technical landscape becomes more constructive for the bulls, at least on the surface. The RSI here is at 58.47, comfortably in neutral territory and trending upwards, suggesting that momentum is building in favor of buyers. The MACD, however, continues to show negative momentum, which presents a slight divergence from the RSI's bullish lean. The Bollinger Bands show the price trading above the middle band, indicating a rising trend on this timeframe. The Stochastic Oscillator (K=58.32, D=60.98) is giving a bearish signal, with the %K line below the %D line, which contradicts the RSI's upward trajectory. The ADX at 30.49 suggests a strong uptrend is developing, adding to the mixed signals. This divergence between indicators on the 4-hour chart highlights the uncertainty and the need for confirmation before committing to a strong directional bias.
On the daily chart, the WTI RSI sits at 53.65, again in neutral territory but with a slight upward slope, indicating a balanced market with a potential for a bullish bias. The MACD here is positive, with the MACD line above its signal line, suggesting bullish momentum is present on the longer timeframe. The Bollinger Bands are positioned above the middle band, supporting a bullish outlook. The Stochastic Oscillator, with K at 89.73 and D at 76.8, is deep in overbought territory and flashing a strong bullish signal, indicating that buyers are in control. The ADX at 29.46 confirms a strong uptrend. This longer-term bullish signal, however, must be considered in the context of the short-term bearish indicators and the overriding geopolitical risks.
Intermarket Correlations: The Dollar and Equities Factor
Understanding the broader market context is crucial, and for WTI, the performance of the U.S. Dollar Index (DXY) and major equity indices like the S&P 500 and Nasdaq are key reference points. Currently, the DXY is trading at 100.70, showing strength with a positive daily change. Historically, a stronger dollar tends to exert downward pressure on dollar-denominated commodities like crude oil, as it makes oil more expensive for holders of other currencies. This inverse correlation is a significant headwind for oil prices, suggesting that the dollar's current strength could be capping any potential upside, despite the bullish geopolitical narrative. The fact that WTI is showing some resilience even with a rising DXY might indicate that the supply-side fears are currently outweighing the currency effect, but this is a delicate balance.
The performance of equity markets also provides clues about risk appetite. The S&P 500 is trading at 6572.87, showing a positive daily change, while the Nasdaq is at 29164.86, despite a negative daily change. This mixed signal in equities suggests a degree of caution. Generally, when risk appetite is high (equities rising), commodities can benefit from increased demand. Conversely, a 'risk-off' environment, where equities fall sharply, often sees investors move towards safer assets, which can sometimes include oil if supply concerns are paramount, but can also lead to a broader sell-off across all risk assets. The current situation, with equities showing mixed signals and the dollar strengthening, creates a complex environment for WTI. The market sentiment appears to be leaning towards caution, where geopolitical risks are driving oil prices higher, but broader economic concerns and currency strength are acting as a brake.
Key Levels and Trade Scenarios
Analyzing the provided data, the immediate support for WTI crude oil lies at $79.23 on the 1-hour chart, followed by $78.97 and $78.63. These levels represent areas where buying interest has historically emerged, potentially halting further declines. On the resistance side, the immediate hurdle is at $80.43, with further resistance at $80.17 and $79.83. Breaking above these resistance levels would be crucial for any sustained bullish move, especially considering the overarching bearish sentiment on the 1-hour chart and the strong dollar.
The daily chart presents a more significant picture. Key support levels are identified at $78.99, $77.57, and $76.63. These are crucial for determining the longer-term trend. On the upside, resistance is seen at $81.35, $82.29, and $83.71. A decisive move above the $81.35 resistance level on the daily chart would signal a potential shift in momentum, especially if accompanied by increased volume and a weakening dollar. Conversely, a failure to hold the $78.99 support could open the door for a deeper correction towards the $77.57 and $76.63 levels.
Bearish Scenario: Geopolitical Fears Subside, Dollar Dominates
60% ProbabilityNeutral Scenario: Consolidation Amidst Uncertainty
25% ProbabilityBullish Scenario: Supply Fears Trump All Else
15% ProbabilityThe Road Ahead: What to Watch
Looking forward, the trajectory of WTI crude oil will likely remain heavily influenced by the geopolitical chessboard, particularly developments concerning U.S.-Iran relations. Any further military posturing, sanctions, or direct actions could easily push prices higher, irrespective of broader economic indicators. Traders must remain vigilant, monitoring news feeds from reputable sources like Reuters and Bloomberg for real-time updates. The market's reaction to any escalation will be swift, and the initial move could be significant, potentially leading to a 'gap up' or 'gap down' at the market open depending on overnight developments.
Beyond the immediate geopolitical flashpoints, macroeconomic data will continue to play a role. The strength of the US Dollar, influenced by Federal Reserve policy expectations and U.S. economic data releases such as upcoming inflation reports or employment figures, will remain a critical counter-factor. A persistently strong dollar, driven by hawkish Fed rhetoric or robust economic data, could limit oil's upside potential. Conversely, any signs of economic slowdown in major consuming nations or a shift towards a more dovish Fed stance could provide additional support for crude prices. The interplay between these supply-side risks and demand-side indicators will define the market's direction in the coming weeks.
From a structural perspective, the ADX readings across timeframes suggest that while short-term trends are weak or mixed, the longer-term daily trend shows strength. However, the conflicting signals from oscillators like RSI and Stochastic across different charts indicate a market that is not yet in clear directional consensus. This suggests that while a breakout is possible, especially on the heels of geopolitical news, the underlying technicals are not yet fully aligned for a sustained move without significant catalysts. Patience and risk management will be paramount for any trader looking to capitalize on the current volatility. Waiting for clearer confirmation, such as a decisive break of key levels ($79.23 support or $80.43 resistance on the 1H, or daily levels $78.99/$81.35) with confirming volume, will be key.
Frequently Asked Questions: WTI Analysis
What happens if WTI breaks above the $81.35 daily resistance level amid escalating U.S.-Iran tensions?
A sustained break above $81.35, especially if fueled by further geopolitical escalation, could signal a significant bullish move. This scenario, currently assigned a 15% probability, might target the next daily resistance at $82.29 as supply disruption fears intensify. However, invalidation would occur if price closes back below $77.57.
Should I consider selling WTI at current levels near $79.59 given the strong DXY at 100.70 and mixed 1-hour indicators?
A bearish stance is plausible given the strong dollar and the 1-hour RSI at 46.91. If tensions de-escalate or the dollar continues to rally, a move towards the 1-hour support at $79.23 is possible. This scenario has a 60% probability. However, invalidation would occur on a close above $81.35, so risk management is crucial.
Is the RSI at 58.47 on the 4-hour chart a reliable buy signal for WTI despite the negative MACD momentum?
The 4-hour RSI at 58.47 suggests bullish momentum is building, but the negative MACD momentum presents a conflict. While it indicates potential for a rally towards 4-hour resistance levels like $81.29, confirmation is needed. A close above $79.83 on the 1H chart could strengthen this bullish bias, but the overall geopolitical risk remains a major factor.
How might upcoming U.S. inflation data impact WTI crude oil prices around the $79.59 level?
Stronger-than-expected inflation data could lead to expectations of higher-for-longer interest rates from the Fed, strengthening the DXY and potentially pressuring WTI. Conversely, softer inflation might weaken the dollar and support oil prices. The reaction will depend on whether geopolitical risks or macroeconomic factors dominate market sentiment at that time.
Technical Outlook Summary
| Indicator | Value | Signal | Interpretation |
|---|---|---|---|
| RSI (14) | 46.91 | Neutral | Slight downward lean, caution warranted. |
| MACD | Negative | Bearish | Negative momentum observed. |
| Stochastic | K:28.74, D:52.74 | Bullish Signal | Potential for short-term bounce. |
| ADX | 10.18 | Weak Trend | Lack of strong directional conviction. |
| Bollinger Bands | Middle Band Break | Bearish | Price below middle band on 1H. |
Track markets in real-time
AI-powered analysis, technical indicators and real-time price data.
Join Our Telegram Channel
Breaking market news, AI analysis and trading signals instantly.
Join Channel