

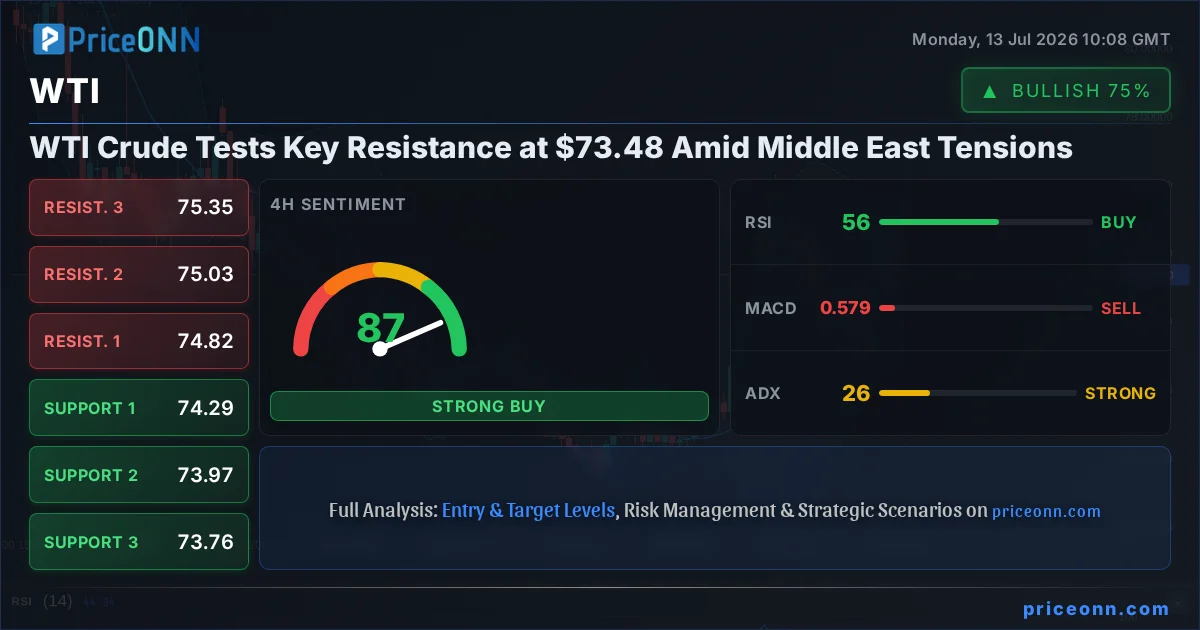
The intricate dance between geopolitical instability and commodity markets is once again taking center stage, with West Texas Intermediate (WTI) crude oil finding itself at a critical juncture around the $73.48 mark. Renewed escalations in the Middle East have sent shockwaves through energy markets, rekindling fears of supply disruptions and pushing oil prices higher at the start of the week. This surge, however, now places WTI directly in the path of significant resistance levels, creating a pivotal moment for traders and analysts alike. Understanding the confluence of these factors - from the immediate threat of conflict to the underlying technical indicators - is paramount for navigating the volatile landscape ahead.
- WTI crude oil is currently trading around $73.48, facing significant resistance as Middle East tensions escalate.
- On the 1H chart, ADX at 27.48 signals a strong uptrend, but RSI at 52.4 suggests a neutral momentum, indicating potential consolidation before the next move.
- The Dollar Index (DXY) at 100.91 is showing a neutral-to-slightly-weakening trend on the 4H, which could offer some support to commodities like WTI if it continues lower.
- Geopolitical risk is the primary driver, with potential for further supply concerns if tensions in the Middle East intensify, potentially pushing WTI towards the $75.00-$75.35 resistance zone.
The global market sentiment is currently a complex tapestry woven with threads of geopolitical risk and cautious economic outlooks. While major stock indices like the S&P 500 are showing signs of resilience with a 0.74% gain to 6572.87 on the 1H chart, the Nasdaq 100 experienced a notable dip, losing 1% to trade around 29549.39. This mixed performance in equities reflects a broader market unease, where investors are weighing the potential impacts of ongoing international conflicts against the backdrop of persistent inflation concerns and the specter of central bank policy shifts. The US Dollar Index (DXY), currently hovering around 100.91, exhibits a neutral to slightly weakening trend on the 4H timeframe (ADX 19.86), a move that typically provides a degree of tailwind for dollar-denominated commodities such as oil and gold. However, the strength of this correlation can be tested when other dominant factors, like geopolitical supply fears, come into play.
Navigating the Geopolitical Crosscurrents
The recent escalation of hostilities in the Middle East has undeniably become the dominant narrative influencing crude oil prices. Reports of renewed U.S. missile strikes against Iran, met with retaliatory actions, have ignited fears of a wider conflict that could directly impact vital oil shipping lanes and production facilities in the region. This heightened geopolitical risk premium is a well-understood phenomenon in commodity markets; any perceived threat to supply routes, particularly those crucial for global oil distribution, can trigger rapid price increases as traders and speculators factor in potential shortages. The fact that Brent crude has already approached levels that have historically acted as a barometer for geopolitical noise - potentially targeting $85 if the $80 threshold is breached - underscores the gravity of the situation. This isn't merely about current supply; it's about the market's forward-looking assessment of future availability under duress.
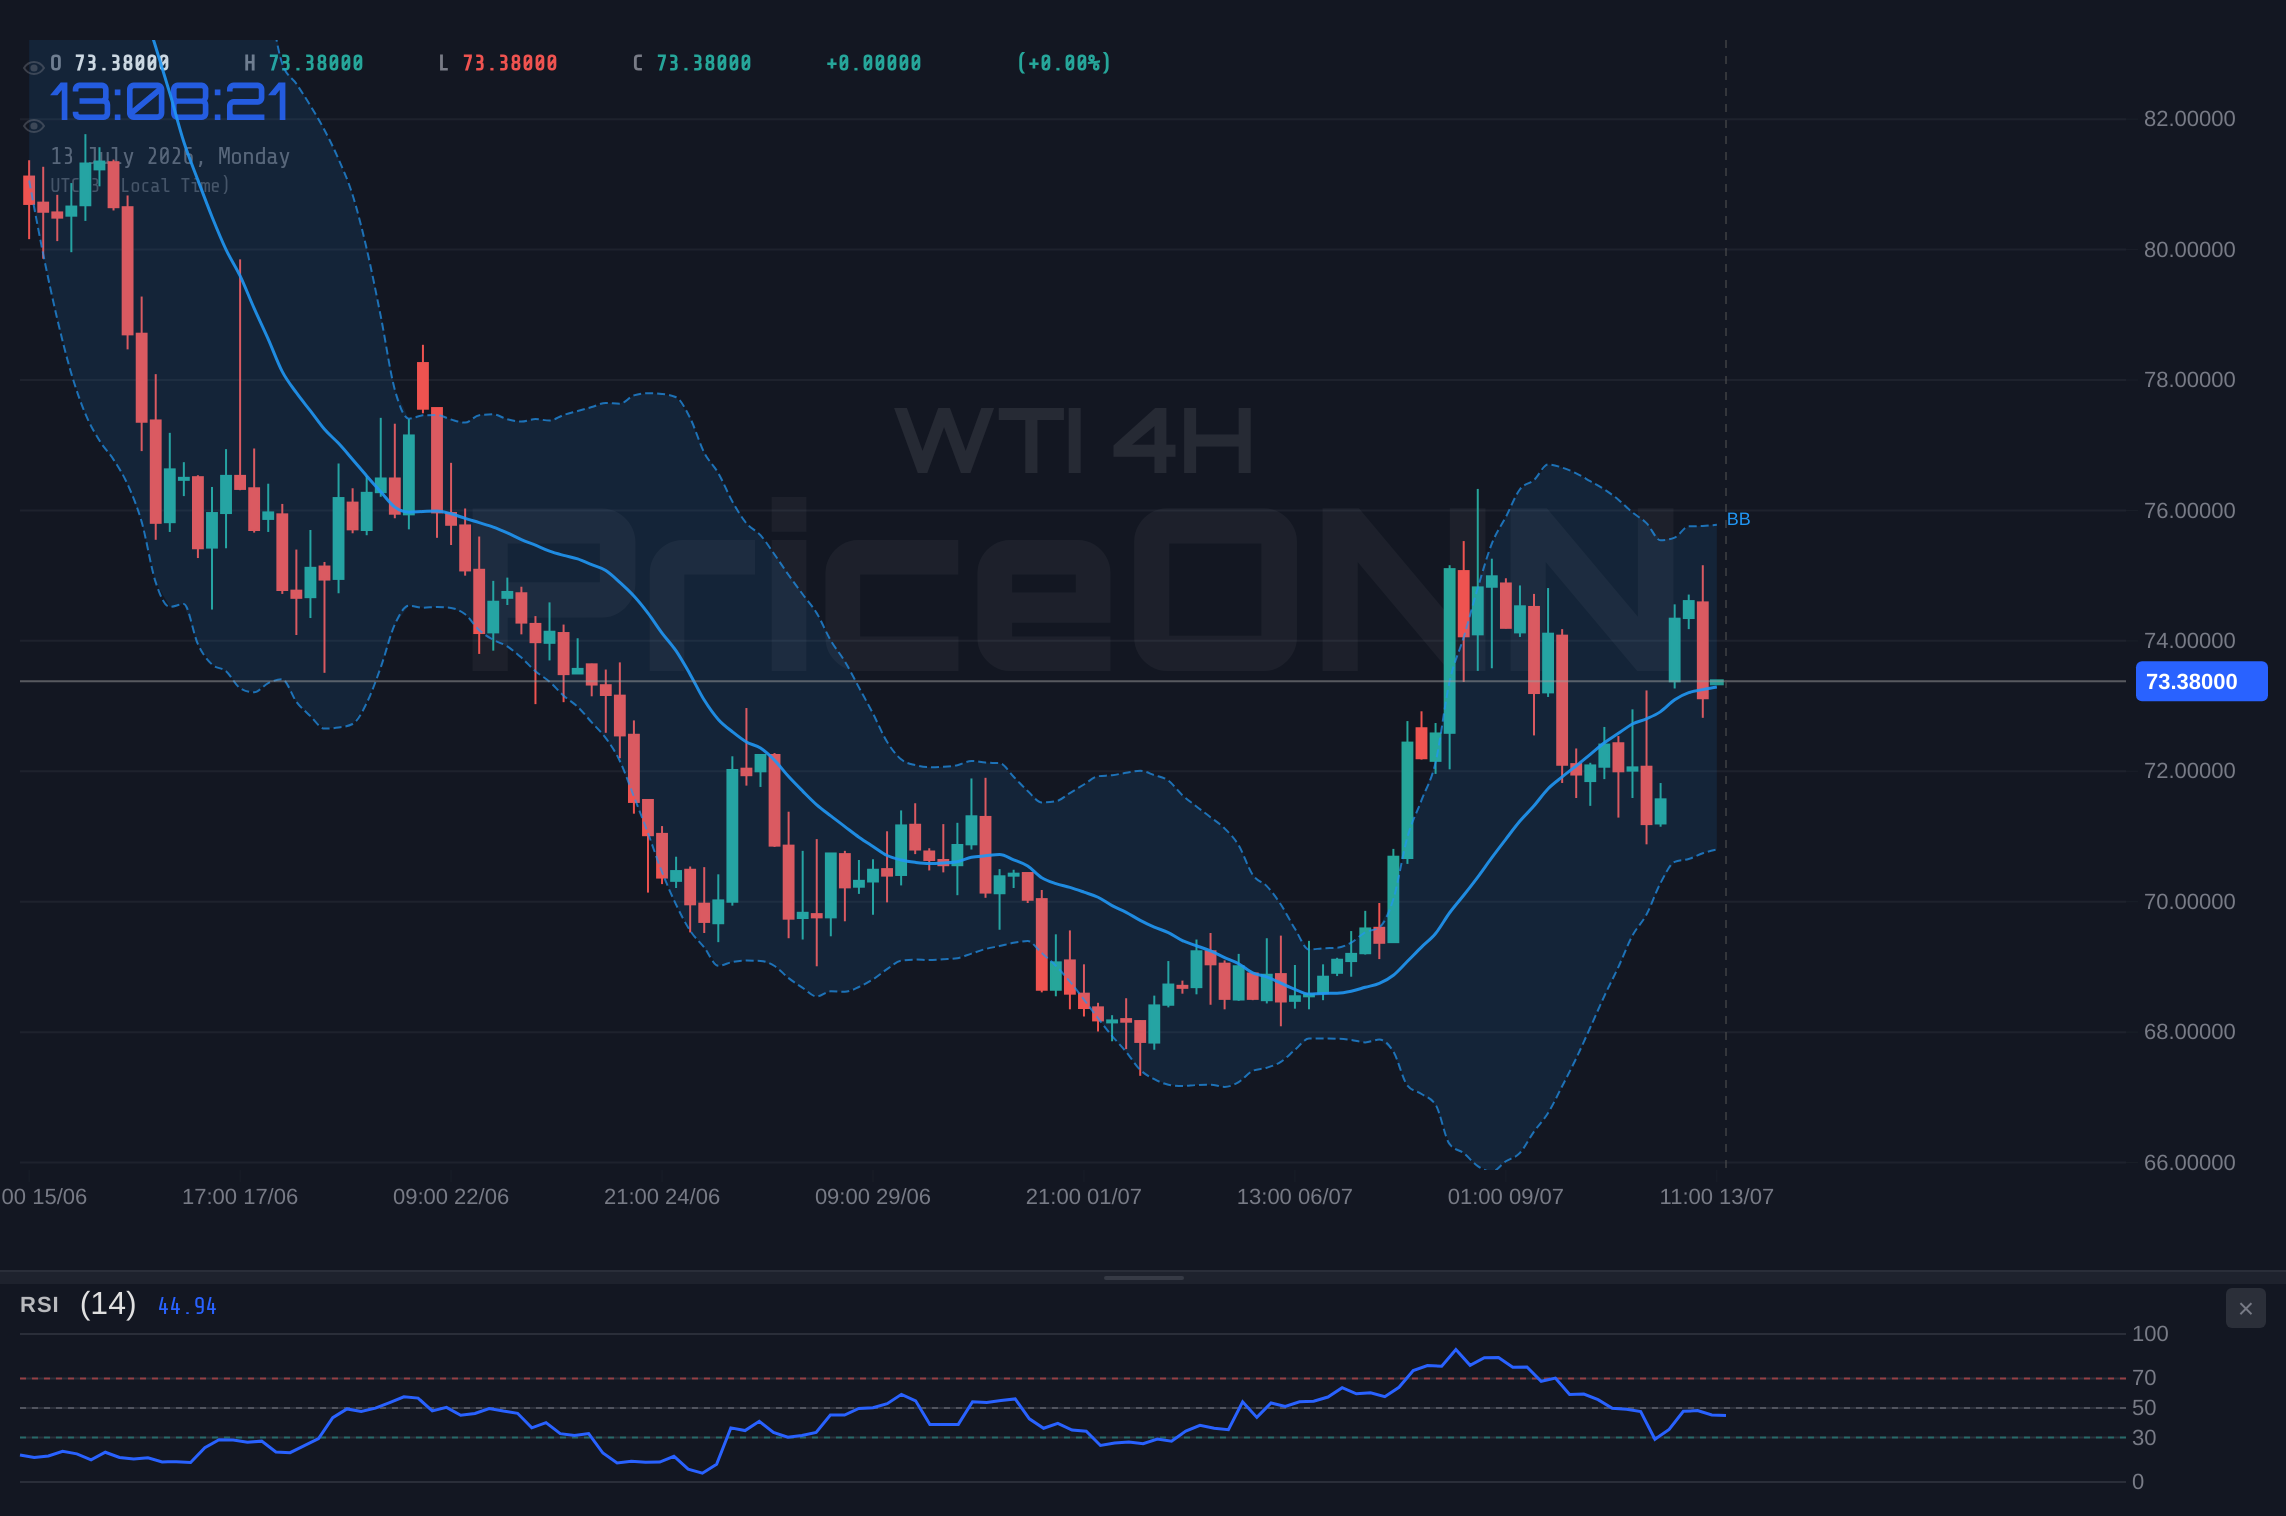
The immediate impact of these tensions is evident in the price action of both Brent and WTI. WTI, trading at $73.48, has seen its 1H trend strengthen significantly, with an ADX reading of 27.48 indicating a robust upward momentum. However, the RSI(14) at 52.4 on the same timeframe suggests that while the trend is strong, the immediate momentum is neutral, possibly hinting at a period of consolidation before a decisive move. Similarly, Brent crude, currently priced at $77.83, shows a strong 96% uptrend on the 4H chart, with its RSI at 58.27 also in neutral territory, suggesting buyers are present but perhaps awaiting further confirmation or a clearer catalyst. The market seems to be in a state of watchful waiting, with prices elevated by the threat of disruption rather than by immediate, quantifiable supply shortages. This dynamic makes the current price levels particularly sensitive to any new developments or de-escalations.
Technical Underpinnings and Divergences
While geopolitical events are the primary catalyst, the technical indicators provide crucial context for understanding the potential trajectory of WTI. On the 1H timeframe, the ADX at 27.48 clearly points to a strong trend, but the RSI at 52.4 and Stochastic's K line at 39.46 (with D line at 74.03) showing a bearish signal, suggest that immediate upside momentum might be waning. This divergence is key: a strong trend doesn't always equate to a smooth, uninterrupted ascent. It can often lead to periods of consolidation or minor pullbacks as the market digests the rapid price gains or awaits further fundamental catalysts. The MACD on the 1H chart also shows positive momentum, but its position relative to the signal line needs careful observation to confirm sustained strength.
Looking at the 4H chart, the picture becomes more nuanced. WTI's uptrend remains strong with a 93% power rating, but the RSI at 55.88 indicates a more balanced momentum, neither excessively overbought nor oversold. The Stochastic K line at 84.05, however, is entering overbought territory, signaling a potential for a pullback or at least a pause in the rally. This indicator conflict - a strong trend but with overbought signals emerging on shorter timeframes - is a classic sign of a market in transition. It suggests that while the overall direction might still be higher, the path is unlikely to be linear. Traders are likely watching the $73.89 resistance level on the 1H chart closely; a decisive break above this could signal a continuation of the upward move, targeting the next key level around $74.65. Conversely, a failure to overcome this resistance could lead to a retracement towards the $72.59 support.
On the daily timeframe, WTI exhibits a more complex trend profile. While the 4H chart shows a strong uptrend, the 1D chart displays a 91% downtrend with an RSI at 43.08, indicating that the longer-term picture might still be under pressure, despite the recent surge. The MACD on the 1D chart is showing positive momentum, but its position above the signal line needs to be sustained to confirm a genuine reversal. The ADX at 32.41 on the daily chart reinforces the idea of a strong trend, but its directionality is crucial. If this daily downtrend is indeed being challenged by the current geopolitical-driven rally, we might be witnessing a significant turning point. However, the bearish signals from the daily RSI and the general directionality of the ADX warrant caution against expecting a runaway rally without further confirmation.
The Influence of Macroeconomic Factors
Beyond the immediate geopolitical flare-up, broader macroeconomic trends continue to exert influence on WTI. Inflationary pressures remain a key concern for global central banks, and oil prices are a significant component of inflation indices. A sustained rise in crude oil prices, driven by supply fears, could complicate the inflation fight for policymakers, potentially leading to more hawkish stances from central banks. This, in turn, could strengthen currencies like the US Dollar, thereby exerting downward pressure on dollar-denominated commodities like WTI. The current DXY reading of 100.91 on the 1H chart, though showing a slight downtrend, remains a critical barometer. If the DXY were to reverse and climb higher due to renewed inflation fears or hawkish central bank rhetoric, it could act as a significant headwind for oil prices, even amidst supply disruptions.
Furthermore, global economic growth prospects play a vital role in oil demand. Data such as Purchasing Managers' Index (PMI) reports and Gross Domestic Product (GDP) figures from major economies provide insights into the health of global manufacturing and services sectors, which directly correlate with energy consumption. If upcoming economic data points to a slowdown in global growth, it could dampen demand expectations for oil, counteracting the bullish sentiment generated by supply-side concerns. For instance, if the upcoming PMI data from the Eurozone or China shows a significant contraction, it would signal weakening demand that could cap any further upside in WTI, regardless of Middle East tensions. Traders are thus closely watching economic calendars for releases that could shift the demand-side narrative.
Market Sentiment and Trader Positioning
The current market sentiment appears to be a precarious balance between fear of supply shortages and underlying concerns about global demand and inflation. The speculative trading community, while seemingly reluctant to fully commit to a sustained rally despite escalating tensions, is clearly reacting to the geopolitical headlines. The fact that WTI is holding below $75.00, even with the Middle East conflict intensifying, as noted in recent market commentary, suggests a degree of caution among traders. This could indicate that the market is pricing in a certain level of risk but is hesitant to bid prices significantly higher without more concrete evidence of sustained supply disruptions or a clear escalation that directly impacts major oil-producing regions. The reluctance to jump on the rally could also be a sign of profit-taking after previous runs or a strategic wait-and-see approach.
Understanding trader positioning is also crucial. While specific commitment of traders (COT) data isn't provided in real-time, historical patterns suggest that during periods of heightened geopolitical risk, speculative long positions tend to increase. However, this can also lead to increased volatility and potential for sharp reversals if the geopolitical situation de-escalates or if other fundamental factors, like weakening demand, come to the fore. The current signals from the 1H and 4H Stochastic oscillators, showing mixed signals with some overbought conditions emerging, hint at this delicate balance. A significant shift in positioning, whether by institutional players or retail traders, could amplify price movements. For now, the sentiment seems to be one of watchful optimism for the bulls, tempered by the reality of potential demand-side headwinds and the inherent uncertainty of geopolitical events.
Scenario Analysis: What Lies Ahead for WTI?
Given the current confluence of factors - geopolitical tension, technical divergences, and macroeconomic crosscurrents - several scenarios are plausible for WTI crude oil. The primary narrative driving prices is the risk of supply disruption in the Middle East. If tensions escalate further, leading to direct impacts on production or shipping, WTI could easily break through the $75.00 resistance. The 4H chart resistance levels at $74.82 and $75.03 become immediate focal points. A confirmed break above $75.03, supported by strong volume and sustained geopolitical headlines, could target the $75.35 level, and potentially push towards the higher resistance zone identified around $78.00-$79.00 in the longer term, especially if the daily chart begins to show a stronger reversal. This scenario hinges entirely on the continuation and intensification of the Middle East conflict.
Conversely, a de-escalation of tensions or a diplomatic breakthrough in the Middle East would likely remove the primary bullish catalyst. In such a scenario, attention would shift back to demand-side fundamentals and macroeconomic concerns. If global growth signals weaken and inflation remains sticky, prompting hawkish central bank actions, WTI could face significant downward pressure. The 1H chart support at $72.59 and $72.05 would become key levels to watch. A decisive break below $72.05, especially if accompanied by negative economic data or a strengthening DXY, could signal a move towards the 4H support at $70.55, and potentially further down towards the daily support at $69.54. This scenario would see the geopolitical risk premium evaporate, leaving oil prices to be dictated by supply/demand dynamics and monetary policy.
A neutral or consolidation scenario is also highly probable, especially if the geopolitical situation remains tense but contained, without direct impacts on oil supply. In this case, WTI might trade within a range, fluctuating between the current resistance around $73.89-$74.65 and the support levels near $72.59-$73.48. Technical indicators on the 1H and 4H charts, showing some overbought conditions and mixed signals, support this possibility. The market might wait for clearer direction from either a significant escalation or de-escalation in the Middle East, or from key macroeconomic data releases like upcoming inflation reports or central bank commentary. During such a period, volatility could remain elevated, offering opportunities for short-term traders but requiring careful risk management for longer-term positions.
The Road Ahead: Watchful Pragmatism
The current price action in WTI crude oil is a stark reminder of the powerful influence that geopolitical events can wield over commodity markets. While the immediate threat of supply disruption has pushed prices higher, the underlying fundamentals and technical signals suggest a market at a crossroads. The $73.48 level is not just a price point; it represents a battleground where bullish supply fears clash with cautious demand outlooks and the ever-present specter of inflation. For traders and investors, this environment demands a heightened sense of awareness and a disciplined approach to risk management. Patience may indeed be rewarded, as the market seeks clarity from the ongoing geopolitical developments and upcoming economic data.
The critical support level to watch on the 1H chart remains around $72.59, with a more significant floor at $70.55 on the 4H. On the resistance side, the immediate hurdle is at $73.89, followed by $74.65. A decisive move through these levels, particularly with increased volume and sustained news flow, will dictate the next significant price action. The interplay between the DXY and oil prices will also be crucial; a weakening dollar could provide further upside, while a strengthening dollar might cap gains. Ultimately, navigating this complex market requires a keen eye on headlines, a firm grasp of technical levels, and a pragmatic assessment of the macroeconomic backdrop. The energy markets are rarely simple, and the current situation is no exception.
Frequently Asked Questions: WTI Analysis
What happens if WTI breaks decisively above the $74.65 resistance level amid escalating Middle East tensions?
A sustained break above $74.65, fueled by worsening geopolitical news, could signal a continuation of the rally. This would likely target the next significant resistance around $75.35 on the 1H chart, with potential for further upside towards the $78.00-$79.00 range if the daily trend confirms a reversal.
Should I consider buying WTI at current levels of $73.48 given the mixed technical signals and geopolitical uncertainty?
Buying at current levels carries risk due to conflicting signals. The 1H chart shows a strong trend (ADX 27.48) but neutral momentum (RSI 52.4), while the 4H Stochastic shows overbought conditions. A more prudent approach might be to wait for confirmation, such as a clear break above $74.65 or a pullback to a confirmed support level like $72.59, with a defined invalidation point.
Is the RSI at 52.4 on the 1H chart a sell signal for WTI right now?
An RSI reading of 52.4 is considered neutral territory and not a direct sell signal. While it suggests that immediate upside momentum might be waning after a strong trend, it doesn't indicate a reversal. A sell signal would typically require RSI to move below 50 and show sustained downward movement, ideally confirmed by other indicators like MACD crossing below its signal line.
How will the upcoming economic data releases affect WTI prices this week, given the current geopolitical backdrop?
Upcoming economic data, particularly inflation figures (CPI) and growth indicators (PMI), will be crucial for assessing demand-side factors. If data points to rising inflation, it could prompt hawkish central bank responses, strengthening the USD and potentially capping oil prices. Conversely, weak demand signals could counteract supply-driven gains. Traders should monitor these releases closely for potential shifts in market sentiment away from purely geopolitical drivers.
Track markets in real-time
AI-powered analysis, technical indicators and real-time price data.
Join Our Telegram Channel
Breaking market news, AI analysis and trading signals instantly.
Join Channel