

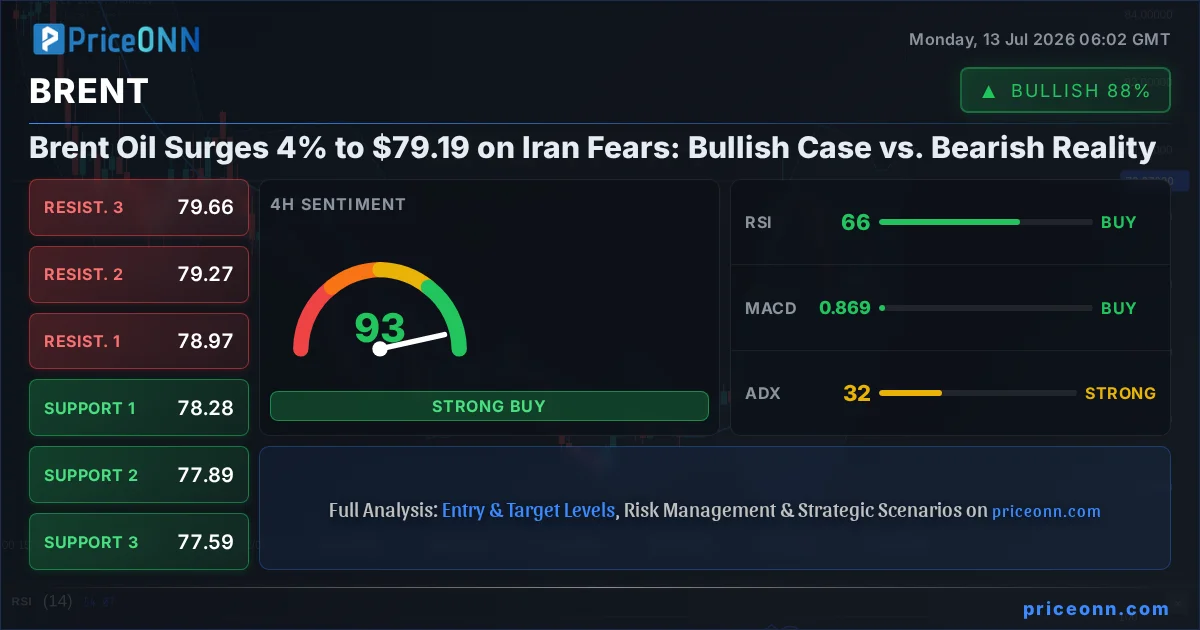
The Tightrope Walk at $79.19: Is Brent Crude Poised for an $85 Rally or a Bearish Reversal?
The energy markets are once again on edge, with Brent crude oil staging a significant rally to $79.19 today. This surge, primarily fueled by escalating geopolitical tensions between the U.S. and Iran, has ignited a fierce debate among traders and analysts: are we on the cusp of a sustained push towards the $85 mark, or is this simply a short-term spike before a more significant correction? The market's current state is a battleground where fear of supply disruption clashes with underlying economic realities and technical indicators. Understanding this dynamic requires dissecting both the optimistic projections and the cautionary signals that are currently flashing across the charts.
- Brent crude oil is trading at $79.19, up 4.38% on the day, driven by U.S.-Iran tensions.
- The bullish case targets $85, contingent on sustained supply disruption fears and a break above key resistance.
- Bearish counterarguments point to weakening global demand signals and technical indicators suggesting overbought conditions.
- The DXY Dollar Index at 101.15 is strengthening, potentially capping commodity price gains.
The Bullish Barrage: Why $85 Beckons
Geopolitical Heat on the Supply Front
The immediate catalyst for Brent's sharp ascent to $79.19 is the palpable fear of supply disruptions stemming from the Middle East. Recent news reports, including those from Forex [Jul 13 04:55], highlight intense U.S. strikes on Iran and retaliatory claims, reigniting fears of a broader conflict that could impact crucial oil shipping lanes. The Strait of Hormuz, a vital chokepoint for global oil trade, is perpetually in the crosshairs during such escalations. When geopolitical risk spikes, crude oil prices often react preemptively, pricing in potential supply shortages even before they materialize. This has historically been a powerful driver for oil, turning what might be perceived as minor regional skirmishes into significant market-moving events. The market is clearly pricing in a heightened risk premium, pushing Brent higher as traders scramble to secure positions ahead of a potential supply shock.
Technical Tailwinds: Breaking the Chains
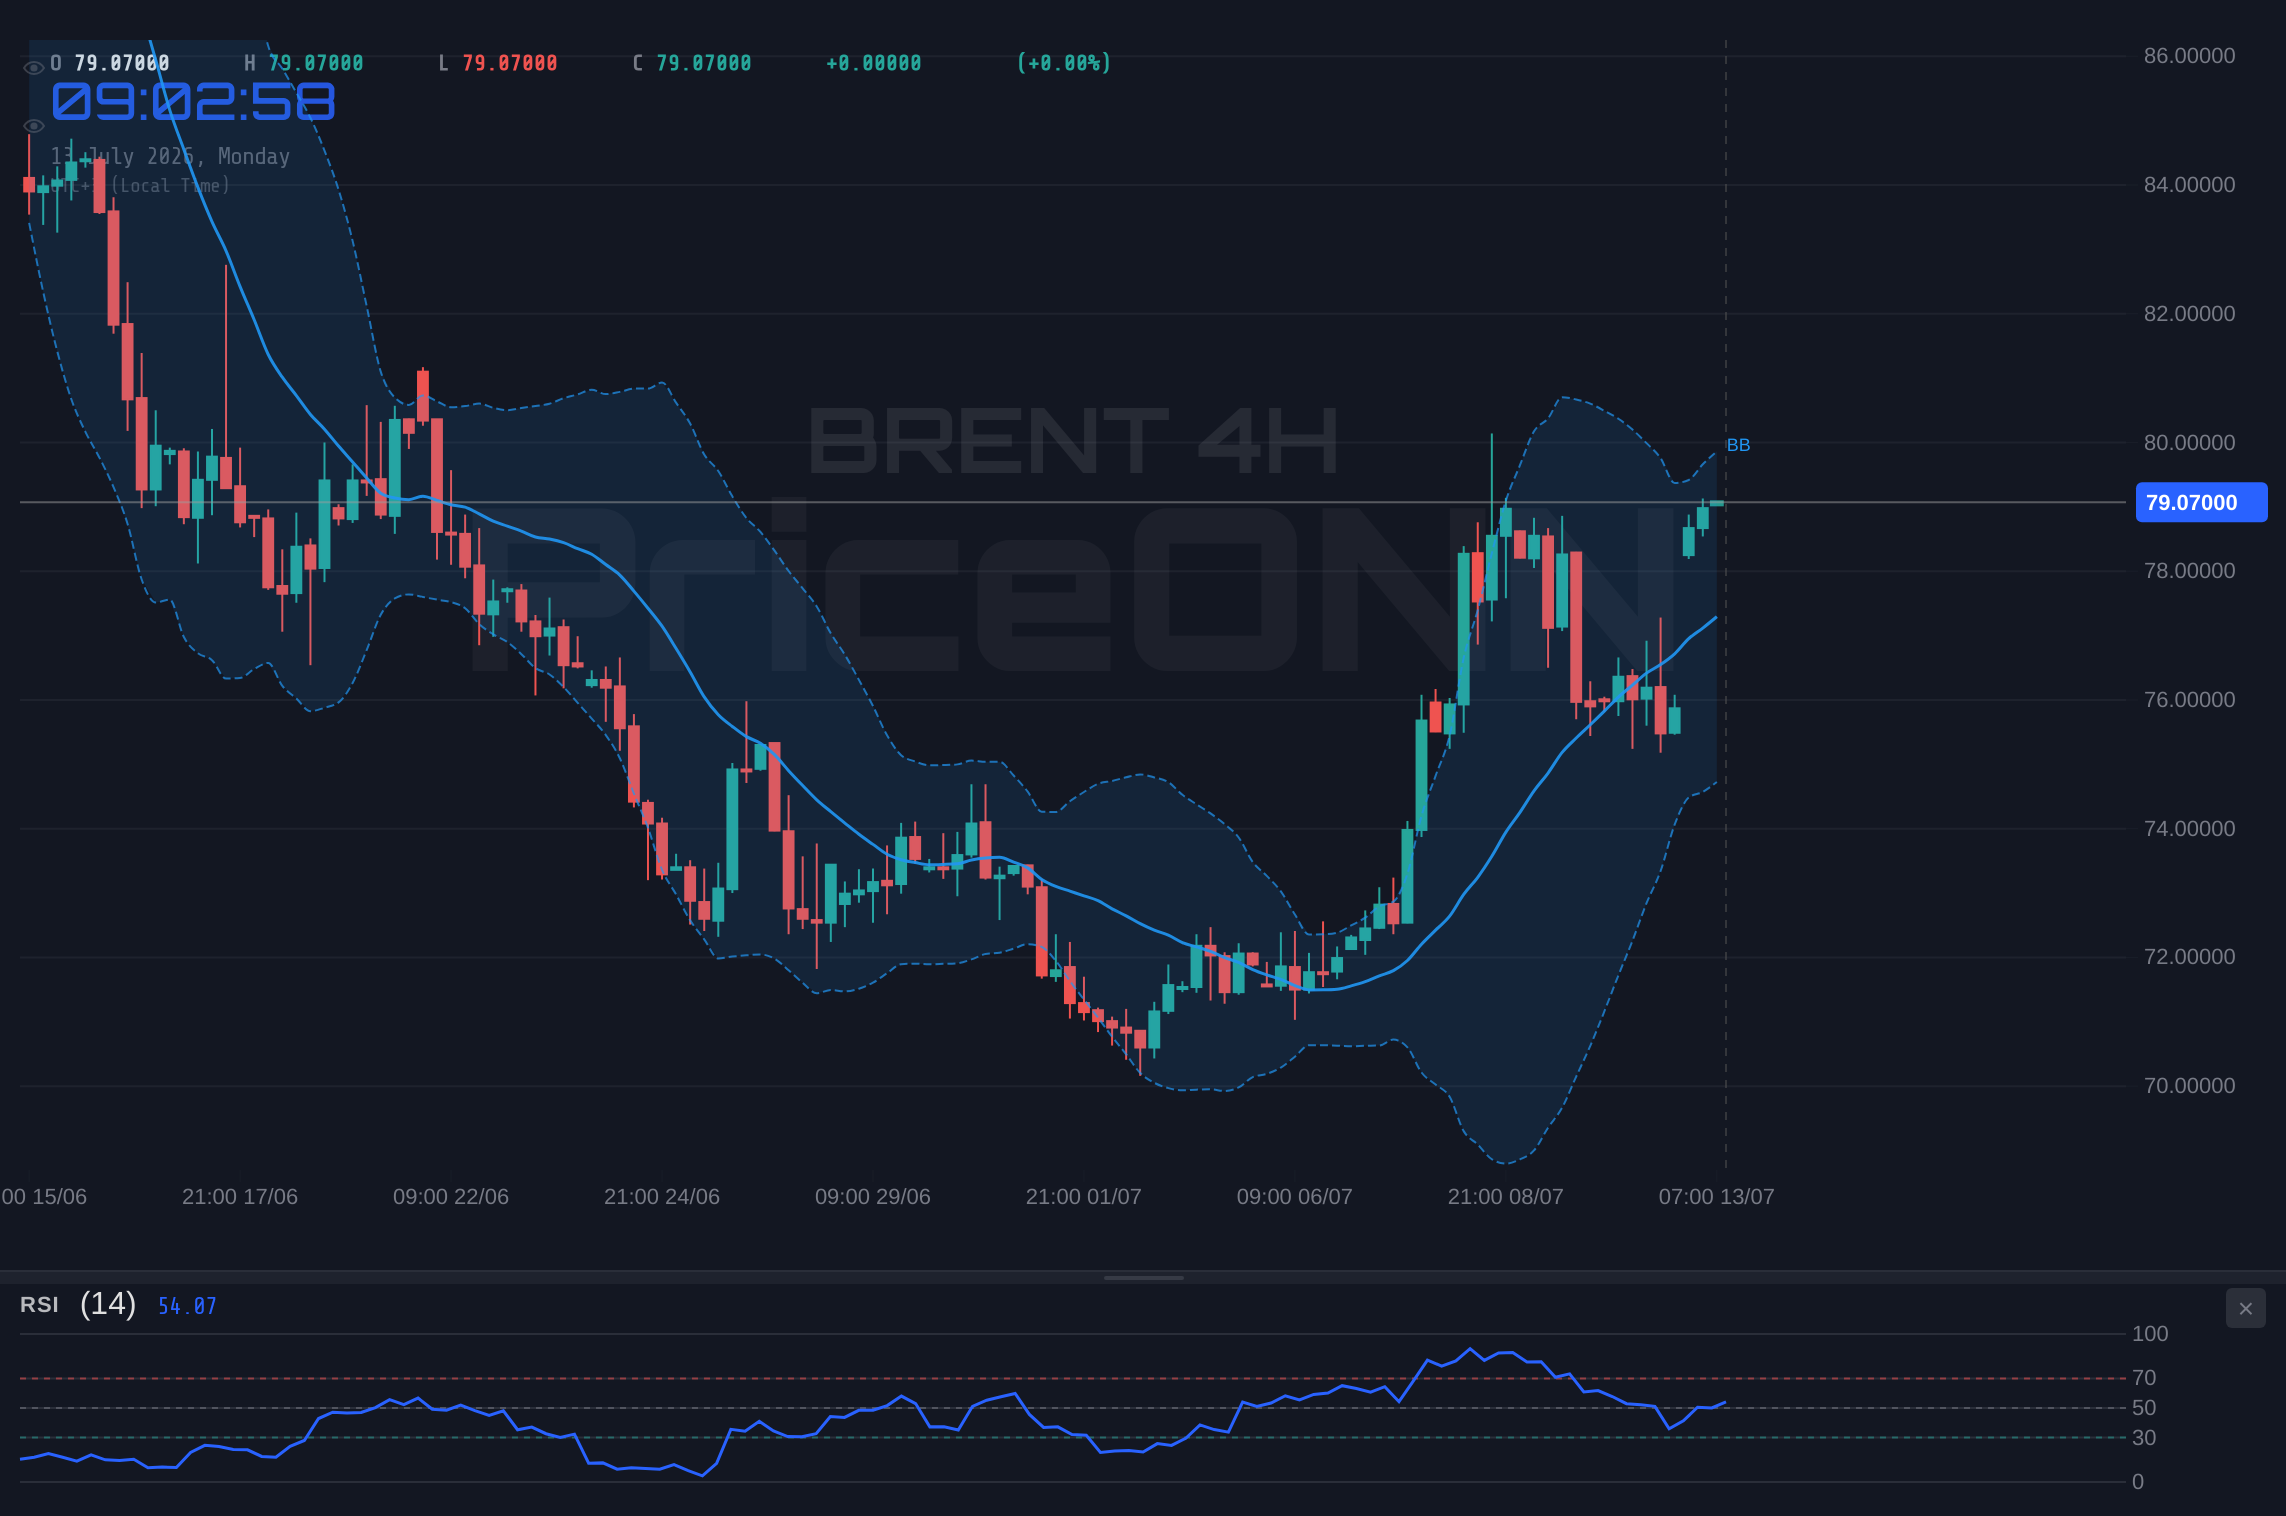
From a technical perspective, the move above the $78.97 resistance level on the 4-hour chart is significant. This level has acted as a repeated ceiling, and its breach suggests that the bulls are gaining momentum. On the 1-hour timeframe, the ADX at 25.25 indicates a strengthening trend, and the RSI at 70.25, while nearing overbought territory, is still within a range that can sustain upward price action in a strong trend. The Stochastic oscillator, with K at 92.94 and D at 82.52, is deep in overbought territory, signalling strong buying pressure. This suggests that the momentum behind the current rally is substantial. If Brent can maintain its position above the $79.05 immediate resistance on the 1-hour chart and consolidate, the path towards the $79.66 and $80.00 psychological level seems plausible. A decisive close above $80.00 could unlock further upside, potentially targeting the $85 level as suggested by some market commentary.
The Narrative of Reopening Demand
Beyond the immediate geopolitical fireworks, there's an underlying narrative that supports higher oil prices: the potential for a robust global economic recovery. While mixed, some economic indicators still hint at underlying strength. If major economies, particularly in Asia, continue to show resilience or surprising upside in their manufacturing and services PMIs, the demand for oil could outstrip current supply expectations. This bullish demand-side story, when combined with supply-side anxieties, creates a potent cocktail for higher prices. The narrative is that the market is not just reacting to fear, but also to the prospect of genuine demand growth, which could absorb current supply levels and push prices higher, especially if OPEC+ producers remain disciplined.
The Bearish Counter-Argument: Cracks in the Foundation
DXY Strength and Macroeconomic Headwinds
However, the bullish case is far from airtight. A significant headwind for commodities, including Brent crude, is the strengthening U.S. Dollar Index (DXY). Currently trading at 101.15, the DXY's upward trajectory suggests that the dollar is gaining strength against its major peers. This correlation is critical: a stronger dollar typically makes dollar-denominated commodities like oil more expensive for holders of other currencies, thereby dampening demand. If the Federal Reserve continues to signal a hawkish stance or if U.S. economic data remains robust relative to other economies, the dollar could continue its ascent, acting as a potent brake on oil prices. The fact that the 1-hour DXY shows positive momentum and a general buy signal across timeframes cannot be ignored by oil bulls. This macro backdrop is a constant threat to any commodity rally.
Signs of Demand Weakness
Despite the optimistic narrative of recovery, several economic indicators are painting a less rosy picture for global oil demand. Manufacturing PMIs in key regions have shown signs of slowing, and consumer sentiment, while recovering in some areas, remains fragile in others. If inflation remains sticky, central banks might be forced to maintain higher interest rates for longer, which would inevitably cool economic activity and, by extension, oil consumption. The data from Nasdaq 100, down 1.35%, and S&P 500, up a modest 0.74% but still showing signs of strain, reflects a cautious risk appetite. A significant drop in equity markets typically correlates with reduced demand expectations for industrial commodities like oil. The daily RSI for Brent at 47.2, while not overtly bearish, indicates a lack of strong upward momentum and susceptibility to negative news.
Technical Overbought Conditions and Divergence
While the 1-hour chart shows bullish momentum, the longer-term picture presents concerns. The daily RSI for Brent at 47.2 suggests that the current rally is not supported by broad-based buying interest. More importantly, the daily Stochastic oscillator shows K at 68.4 and D at 59.14, indicating a strong upward signal, but the ADX at 33.63 points to a strong *downward* trend, creating a contradiction. This divergence between momentum indicators and trend strength is a classic sign of a potentially weakening trend or a market that is losing conviction. The fact that the daily chart is in a downtrend (as per the data) despite the short-term surge is a major red flag. The 1-hour RSI at 70.25 and Stochastic deep in overbought territory (K=92.94) suggest that the current move is potentially overextended and ripe for a pullback or consolidation. A failure to hold above the $79.05 resistance could lead to a sharp reversal.
The Unpredictability of Geopolitics
While geopolitical tensions are currently driving prices higher, they are also inherently unpredictable. The situation between the U.S. and Iran could de-escalate as quickly as it has flared up. Geopolitical 'noise' can often be priced in, and then a lack of actual physical supply disruption can lead to a sharp price reversal as the market corrects its overreaction. Furthermore, the response from other major oil producers, or even internal shifts within OPEC+, could alter the supply landscape. The market's reaction to news is often emotional and can overshoot fair value, creating opportunities for sharp reversals when the initial fear subsides. This makes betting solely on a geopolitical surge a risky proposition.
Weighing the Scales: Verdict on Brent's Trajectory
The Technical Confluence: A Tug-of-War
Looking at the technicals across different timeframes reveals a market in conflict. The 1-hour chart, with its strong buy signals and momentum, suggests further upside potential, perhaps targeting the $79.66 and $80.00 levels. The ADX at 25.25 supports this short-term bullish trend. However, the daily chart presents a starkly different picture. The trend is officially classified as 'Düşüş' (Down), with an ADX of 33.63 indicating a strong downward trend, contradicting the short-term bullish signals. The daily RSI at 47.2 is not confirming the upside, and the Stochastic shows a weakening picture, despite the K line being above D. This divergence is crucial. It suggests that while short-term traders might be pushing prices up on fear, the longer-term trend remains under pressure. The $79.19 price point is currently sitting just below the 1-hour resistance of $79.26, a critical juncture.
Fundamental Crosscurrents: Demand vs. Fear Premium
The fundamental picture is equally divided. The fear premium driven by U.S.-Iran tensions is undeniable and has pushed Brent to $79.19. This can be a powerful short-term driver. However, the underlying global demand picture, influenced by inflation concerns and the potential for higher interest rates, remains a significant overhang. The strengthening DXY at 101.15 adds another layer of complexity, potentially capping any sustained rally. The market must decide whether the geopolitical risk premium is sufficient to overcome potential demand destruction and dollar strength. The fact that the 1D Brent signal is 'NÖTR' (Neutral) with an equal split of buy and sell signals underscores this tension.
The Verdict: Caution Prevails Above $79.19
Given the conflicting signals, the most prudent approach is one of caution. While the short-term surge to $79.19 is impressive and driven by understandable fear, the longer-term technicals and macroeconomic headwinds suggest that a sustained rally to $85 is not guaranteed and faces significant hurdles. The daily downtrend signal, the DXY strength, and the potential for demand to falter under higher interest rates all weigh on the bullish narrative. For Brent to convincingly break out and target $85, it would need to overcome not only the immediate resistance around $79.26 but also establish a sustained bullish trend on the daily chart, supported by improving demand indicators and a less hawkish global central bank outlook. Until these conditions are met, the current price action above $79.19 should be viewed with skepticism. A close below the $78.84 support on the 1-hour chart could signal the beginning of a reversal, invalidating the short-term bullish sentiment. The market is at a critical juncture, and patience will be key for traders looking to navigate this volatility.
Bearish Scenario: The $79.19 Wall
65% ProbabilityConsolidation Scenario: The $79.19 Seesaw
25% ProbabilityBullish Scenario: Breaking the $80 Barrier
10% ProbabilityFrequently Asked Questions: BRENT Analysis
What happens if BRENT fails to hold above $79.19 and breaks below $78.84 support?
If BRENT breaks below the $78.84 support on the 1-hour chart, the short-term bullish sentiment driven by geopolitical fears would likely be invalidated. This could trigger a move towards the next significant support at $78.28 on the 4-hour timeframe, as the market corrects its overreaction.
Should I buy BRENT at current levels around $79.19 given the RSI is at 70.25?
Buying at current levels around $79.19 with the 1-hour RSI at 70.25 presents a high-risk scenario. While the short-term trend is up, this RSI reading indicates overbought conditions, suggesting a pullback is more likely than a sustained rally without consolidation. Patience for a pullback to support or a confirmed breakout above $79.66 is advised.
Is the ADX at 33.63 on the daily chart a sell signal for BRENT despite the intraday surge?
The ADX at 33.63 on the daily chart indicates a strong downward trend, which directly contradicts the intraday bullish price action. This divergence suggests the current rally might be a counter-trend move within a larger downtrend, making it a potential sell signal for longer-term traders if key daily resistances are not decisively broken.
How will the strengthening DXY at 101.15 affect BRENT's potential move towards $85?
A strengthening DXY, currently at 101.15, typically acts as a headwind for dollar-denominated commodities like BRENT. It makes oil more expensive for non-dollar buyers, potentially capping rallies and limiting the upside potential towards targets like $85. Sustained DXY strength could force a reassessment of bullish oil scenarios.
| Indicator | Value | Signal | Interpretation |
|---|---|---|---|
| RSI (14) | 47.2 | Neutral | Lacks strong momentum confirmation for the current price action. |
| MACD Histogram | 0.48 | Bullish | Momentum is positive on the daily chart, but needs to confirm trend strength. |
| Stochastic | K:68.4, D:59.14 | Bullish | Bullish crossover signals potential upside, but daily trend is down. |
| ADX | 33.63 | Bearish | Strong downward trend indicated on daily chart; current rally may be counter-trend. |
| Bollinger | Middle Band | Watch | Price is above middle band on 1D, but below on 1H, indicating short-term volatility. |
Key Levels
Track markets in real-time
AI-powered analysis, technical indicators and real-time price data.
Join Our Telegram Channel
Breaking market news, AI analysis and trading signals instantly.
Join Channel