

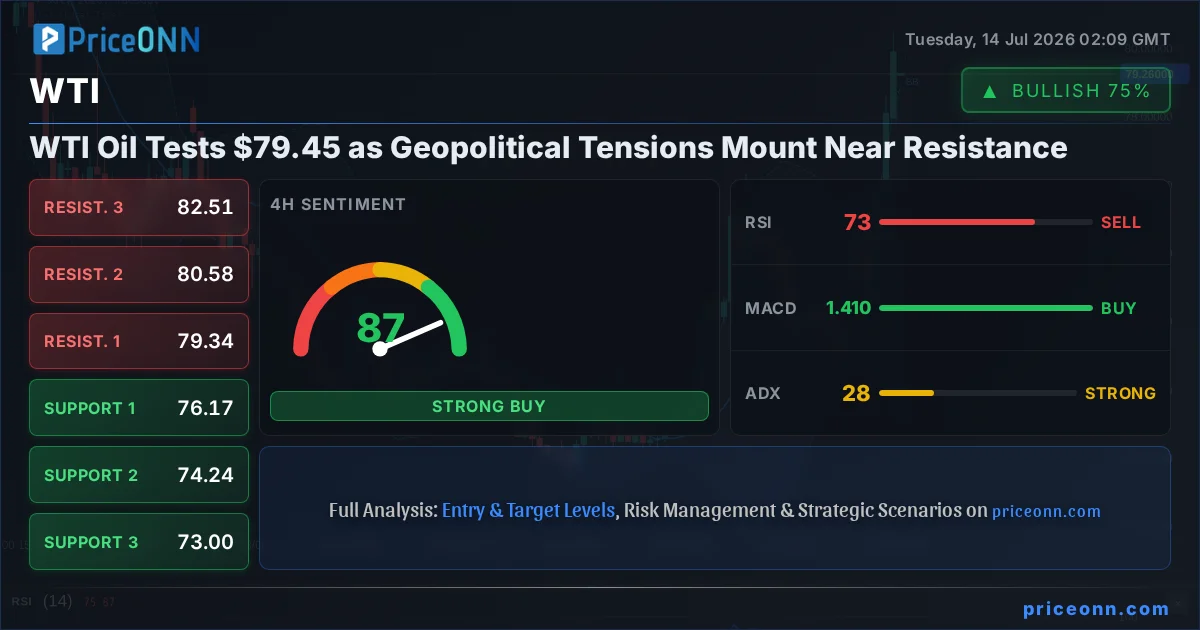
The oil market is on edge, with WTI crude oil currently trading at $79.45. This pivotal moment arrives as geopolitical tensions in the Middle East escalate, pushing Brent crude to $83.48 and creating a complex backdrop for the commodity. While the daily charts suggest a strong upward trend for WTI, the 1-hour and 4-hour indicators present a more cautious picture, hinting at potential consolidation or a pullback before any significant move higher. This analysis delves into the interplay of technical indicators, macroeconomic correlations, and geopolitical catalysts to decipher the immediate path forward for WTI.
- WTI crude oil is trading at $79.45, with Brent at $83.48, amid heightened Middle East tensions.
- The 1-hour and 4-hour technical signals for WTI lean towards caution, despite a strong daily uptrend and ADX of 28.02.
- RSI at 79.02 on the 1H chart signals overbought conditions, suggesting potential for profit-taking.
- Key support for WTI is identified at $78.88, while resistance looms around $80.69.
- The strengthening DXY at 101.25 adds a layer of pressure on oil prices, indicating a complex correlation environment.
The current price action for WTI crude oil, hovering precariously near the $79.45 mark, demands a granular examination of both the immediate technical landscape and the broader market forces at play. The significant daily surge, pushing WTI from a low of $72.68 to its current perch, is undeniable. However, this upward momentum is now confronting resistance levels and a mixed bag of short-term indicators that warrant close attention. The stark contrast between the robust daily trend strength and the more cautionary signals on lower timeframes creates a critical juncture for traders and investors attempting to navigate this volatile energy market. Understanding these nuances is paramount for formulating a coherent trading strategy.
Navigating the Short-Term Technical Crosscurrents
On the 1-hour chart, WTI exhibits a strong upward trend with 100% strength, yet the RSI at 79.02 screams 'overbought,' suggesting that the recent rapid ascent may be due for a pause or a correction. This divergence between the trend's strength and the overbought RSI is a classic signal to watch for potential exhaustion. The MACD is showing positive momentum, with the MACD line above the signal line, which generally supports the bullish case. However, the Stochastic Oscillator, with K at 87.6 and D at 90.09, is firmly in overbought territory, further reinforcing the notion that immediate upside might be limited. The ADX at 46.13 indicates a strong trend, but when coupled with overbought oscillators, it can also signal an unsustainable move.
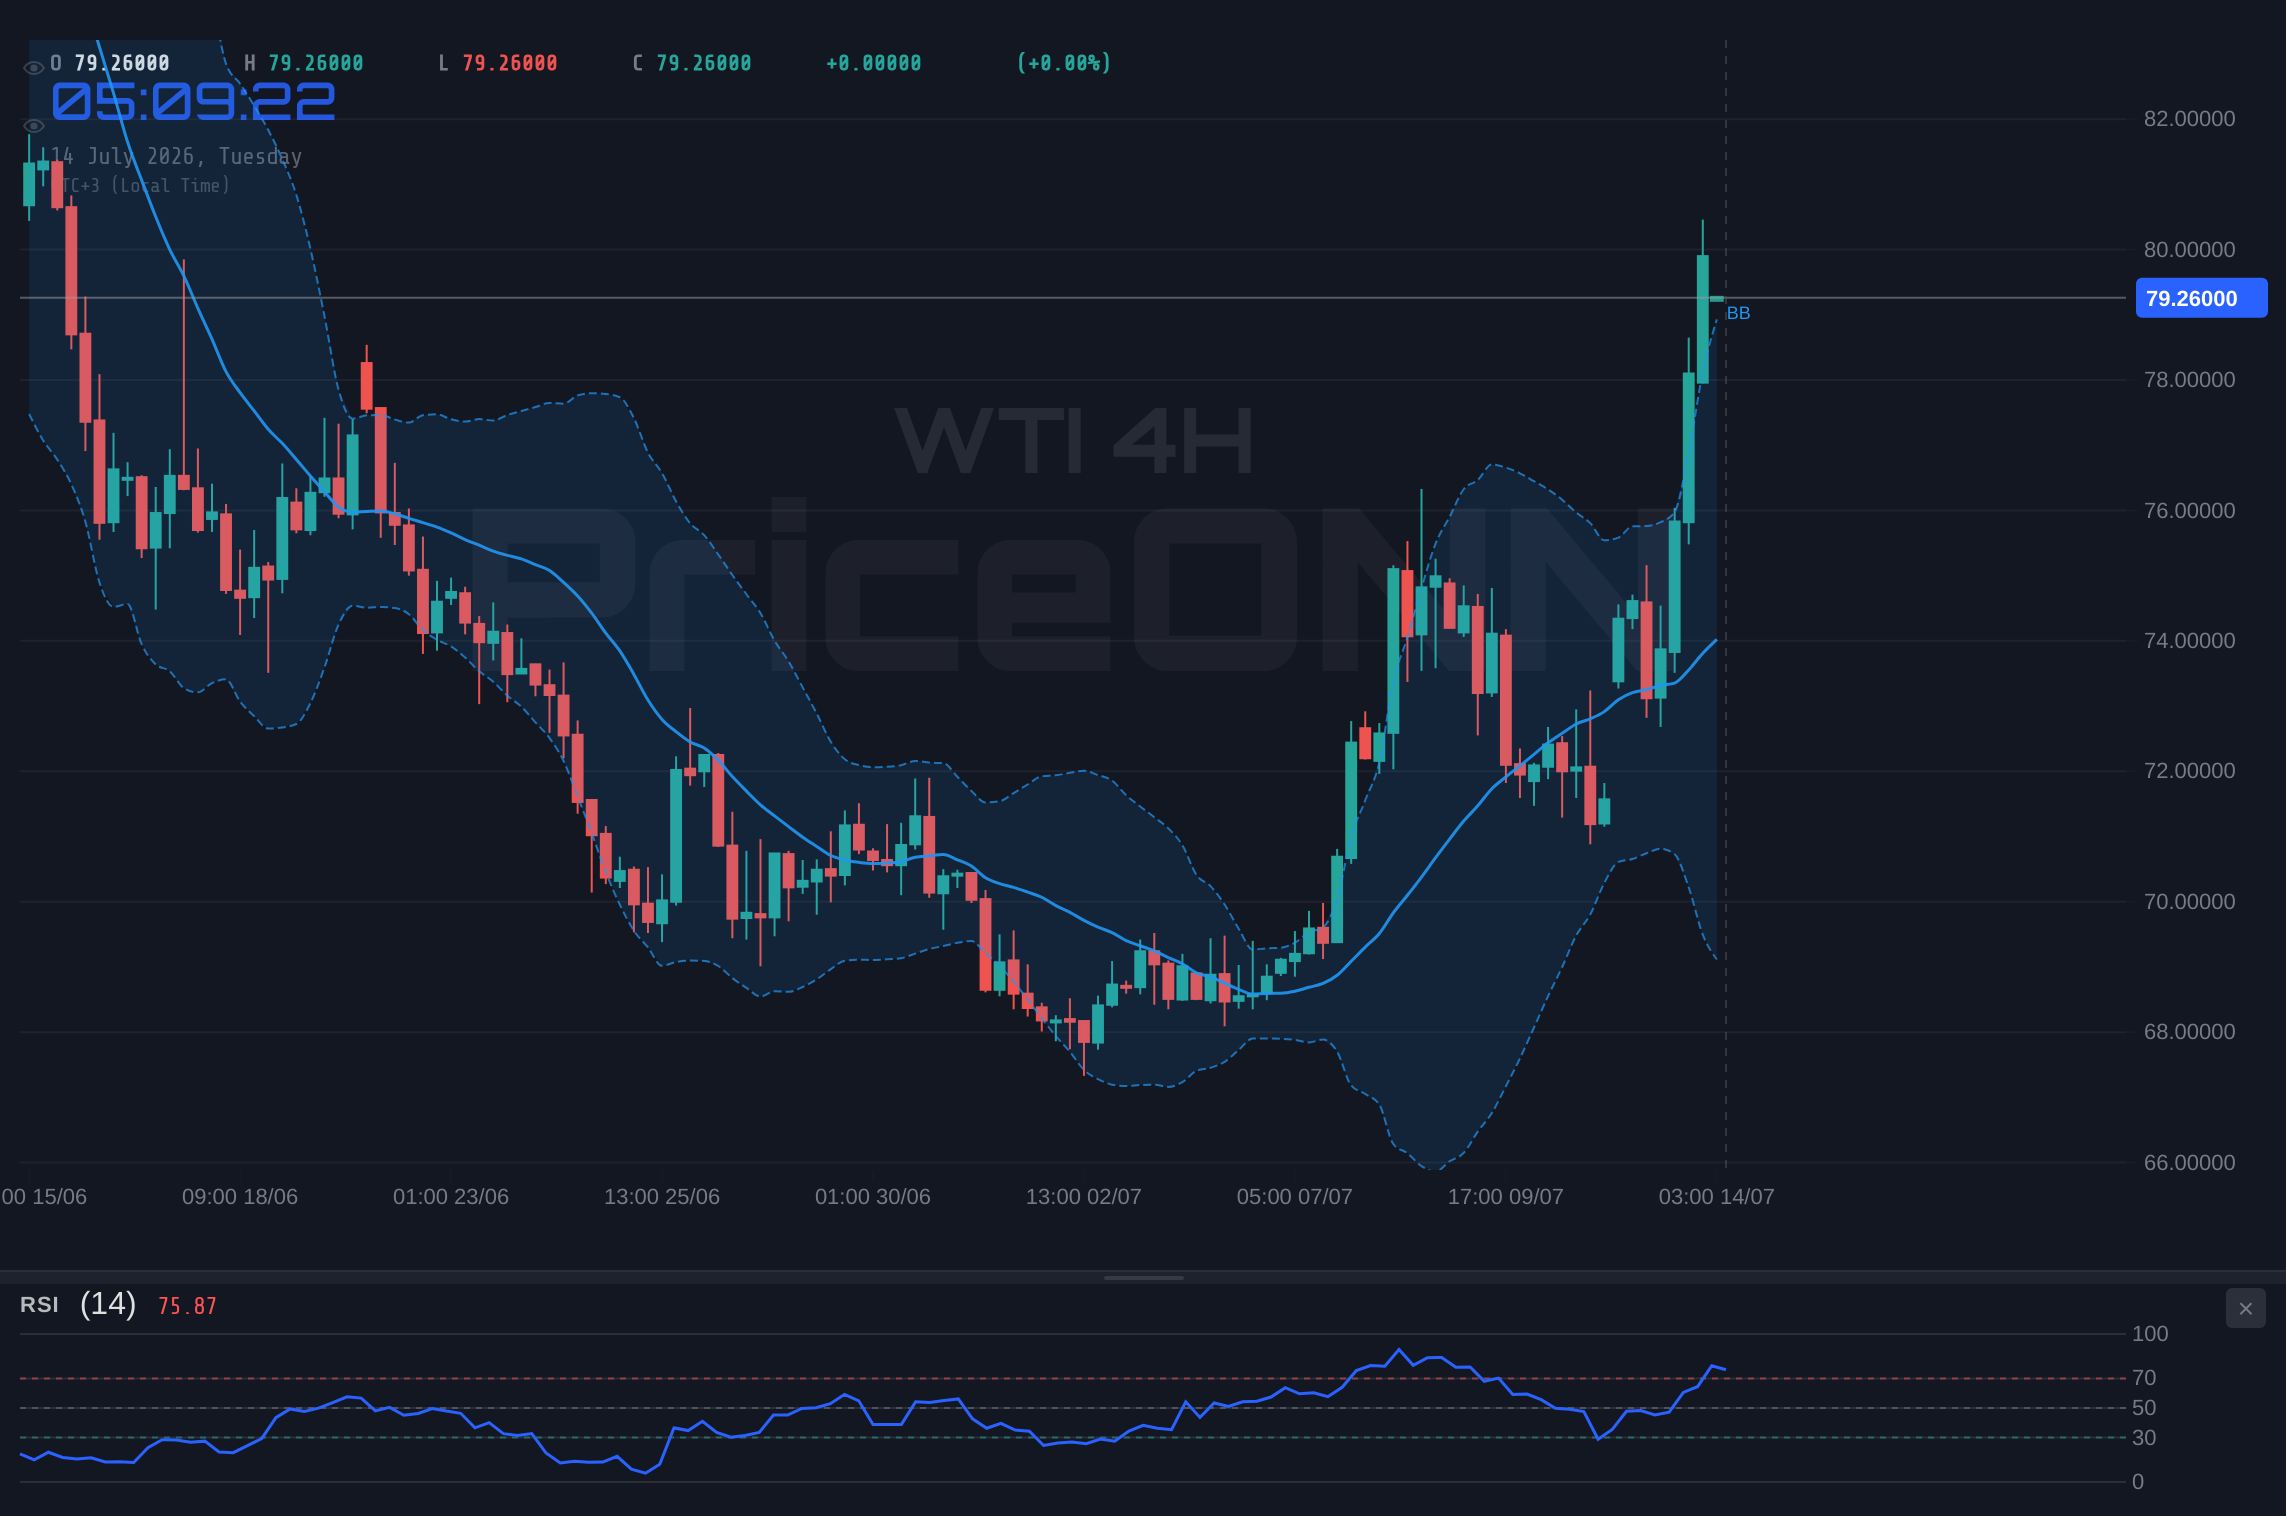
The 4-hour timeframe offers a slightly different perspective, though still leaning bullish. The trend here is also strong at 99% strength, with the RSI at 73.14, still in overbought territory but slightly less extreme than the 1-hour. The MACD remains positive, supporting the ongoing rally. The Stochastic Oscillator, with K at 92.77 and D at 79.3, is also deeply overbought, signaling that sellers could step in soon. The ADX at 28.02 indicates a strong trend, confirming the market's directional conviction. Bollinger Bands on both the 1-hour and 4-hour charts are hugging the upper band, a common characteristic during strong uptrends but also a sign of potential volatility expansion or a reversal if price pulls back sharply.
The daily chart presents the most compelling bullish case, with a trend strength of 91% and the ADX at 32.6, indicating a solid trend. The RSI at 53.66 is comfortably in neutral territory, showing room for further upside before becoming overbought. The MACD is positive, and the Stochastic Oscillator, with K at 66.15 and D at 55.76, suggests continued upward momentum. However, it's crucial to remember that daily trends can be influenced by significant news events or shifts in broader market sentiment. The current confluence of short-term overbought conditions against a strong daily uptrend creates a scenario where caution is advised, especially for those looking to initiate new long positions at these elevated levels.
The Macroeconomic and Geopolitical Undercurrents
The surge in WTI prices is not occurring in a vacuum. The escalating geopolitical tensions in the Middle East, particularly the recent US strikes on Iran and Iran's response, have undeniably fueled supply fears. Reports from sources like Reuters and Bloomberg highlight the increased risk premium being factored into oil prices. This geopolitical risk premium is a significant driver, often overshadowing purely technical considerations. When conflict erupts in key oil-producing regions, the market's immediate reaction is to price in potential supply disruptions, pushing prices higher regardless of other indicators. The fact that Brent crude is also trading higher at $83.48 underscores the broad-based impact of these tensions on the energy complex.
Adding another layer of complexity is the movement of the US Dollar Index (DXY). Currently at 101.25, the DXY is showing a strong upward trend on the 1-hour and 4-hour charts, with a neutral daily trend. A stronger dollar typically exerts downward pressure on dollar-denominated commodities like oil, as it makes them more expensive for holders of other currencies. This inverse correlation means that any further strengthening of the DXY could act as a headwind for WTI, even amidst bullish supply-side news. The market is thus caught between two powerful, potentially opposing forces: geopolitical supply fears pushing oil up, and a strengthening dollar potentially capping gains.
Furthermore, the performance of major stock indices like the SP500 and Nasdaq100 provides insights into overall risk sentiment. The SP500's daily chart shows a bearish trend with RSI at 45.35, while the Nasdaq100 is also in a bearish trend. This risk-off sentiment, as indicated by the indices' performance, can sometimes lead investors to seek safer assets, potentially diverting capital away from commodities. However, in the case of oil, geopolitical risks can sometimes override general risk aversion, leading to a simultaneous rise in oil prices and a fall in equities. The current situation suggests that the immediate supply concerns are dominating market psychology, but a sustained equity selloff could eventually spill over into the commodity markets.
Key Levels and Potential Scenarios
From a technical standpoint, the immediate support for WTI is found around the $78.88 level, followed by $77.86. These are the levels where buying interest has historically emerged, and a sustained hold above them is crucial for maintaining the bullish narrative. On the resistance side, the $80.69 level is the first significant hurdle, followed by $81.48 and $82.50. A decisive break above $80.69, especially on increasing volume and with supportive broader market conditions, could signal a continuation of the uptrend. Conversely, a failure to hold the $78.88 support could open the door for a deeper correction.
Given the conflicting signals – short-term overbought conditions versus a strong daily uptrend and bullish geopolitical drivers – a period of consolidation or a minor pullback seems plausible in the very short term. The ADX readings across all timeframes suggest a strong trend is in place, but the overbought oscillators on the 1-hour and 4-hour charts indicate that this trend might be overextended in the immediate term. Traders will be closely watching how WTI reacts to the $79.45 price point and the immediate support at $78.88. A failure to hold this support could trigger a wave of profit-taking, potentially pushing prices down towards the $77.86 area.
The interplay between the DXY and WTI will be critical. If the dollar continues its ascent, it could provide the catalyst for a short-term reversal in oil prices, especially if geopolitical tensions ease slightly or are perceived as being priced in. Conversely, any further escalation or credible threat of supply disruption in the Middle East could propel WTI higher, potentially ignoring dollar strength in the short run. The market is currently pricing in a significant risk premium, and any de-escalation could lead to a sharp unwinding of this premium, resulting in a swift price decline.
Bearish Scenario: Profit-Taking Amidst Overbought Conditions
65% ProbabilityNeutral Scenario: Consolidation Around Key Levels
25% ProbabilityBullish Scenario: Continued Momentum Driven by Supply Fears
10% ProbabilityFrequently Asked Questions: WTI Analysis
What happens if WTI breaks below the $78.88 support level?
A break below $78.88 would likely trigger further selling pressure, invalidating the immediate bullish outlook. This could lead to a pullback towards the $77.86 support level, driven by profit-taking and a potential decrease in the geopolitical risk premium.
Should I buy WTI at current levels of $79.45 given the RSI at 79.02?
Buying at $79.45 with the 1-hour RSI at 79.02 carries significant risk due to overbought conditions. A more prudent approach might be to wait for a pullback to a stronger support level like $78.88, or confirmation of a breakout above $80.69, before considering new entries. The probability of a short-term reversal is elevated.
Is the RSI at 79.02 a sell signal for WTI right now?
An RSI reading of 79.02 on the 1-hour chart strongly suggests overbought conditions, signaling that the recent rally may be unsustainable in the short term. While not a direct sell signal on its own, it indicates that the market is extended and vulnerable to a correction or consolidation, especially if other indicators also show bearish divergence.
How will the strengthening DXY at 101.25 affect WTI prices this week?
The strengthening DXY at 101.25 typically puts downward pressure on dollar-denominated assets like WTI. This could counteract the bullish impact of geopolitical supply fears. If the DXY continues to rise, it may cap WTI's upside potential or even contribute to a short-term price decline.
The Path Forward: Risk Management is Key
The current market environment for WTI oil is characterized by a strong underlying trend, amplified by significant geopolitical risk, yet tempered by short-term overbought technical conditions and a strengthening dollar. This confluence of factors creates a high-volatility scenario where disciplined risk management is not just advisable, but essential. For traders looking to capitalize on the upward momentum, waiting for a confirmation of a breakout above resistance or a pullback to a well-defined support level offers a more favourable risk-reward profile.
The fundamental drivers, particularly the ongoing conflict in the Middle East and its potential impact on global oil supply, remain the dominant narrative. However, it's crucial to monitor how the market digests this information. If the perceived risk premium becomes excessive or if de-escalation efforts emerge, a sharp correction could follow. Similarly, shifts in the DXY or broader risk sentiment could quickly alter the trajectory of WTI prices. The strength of the trend indicated by the ADX suggests that any move will likely be decisive, but the conflicting short-term signals advise caution.
Ultimately, the price of WTI crude oil at $79.45 represents a critical point where short-term technicals clash with powerful geopolitical and macroeconomic forces. While the daily trend remains bullish, the immediate future likely holds volatility. Traders should prioritize risk management, watch key levels like $78.88 for support and $80.69 for resistance, and remain attuned to news flow from the Middle East and shifts in the DXY. Patience and a clear strategy will be key to navigating these turbulent waters successfully.
Technical Outlook Summary
| Indicator | Value | Signal | Interpretation |
|---|---|---|---|
| RSI (14) | 79.02 | Overbought | Potential for pullback or consolidation |
| MACD Histogram | +0.76 | Positive Momentum | Supports upward trend |
| Stochastic | K:87.60, D:90.09 | Overbought | Signals potential reversal or pause |
| ADX | 46.13 | Strong Trend | Confirms directional move |
| Bollinger Bands | Upper Band | Watch | Price near upper band, potential volatility |
Key Levels
Track markets in real-time
AI-powered analysis, technical indicators and real-time price data.
Join Our Telegram Channel
Breaking market news, AI analysis and trading signals instantly.
Join Channel