

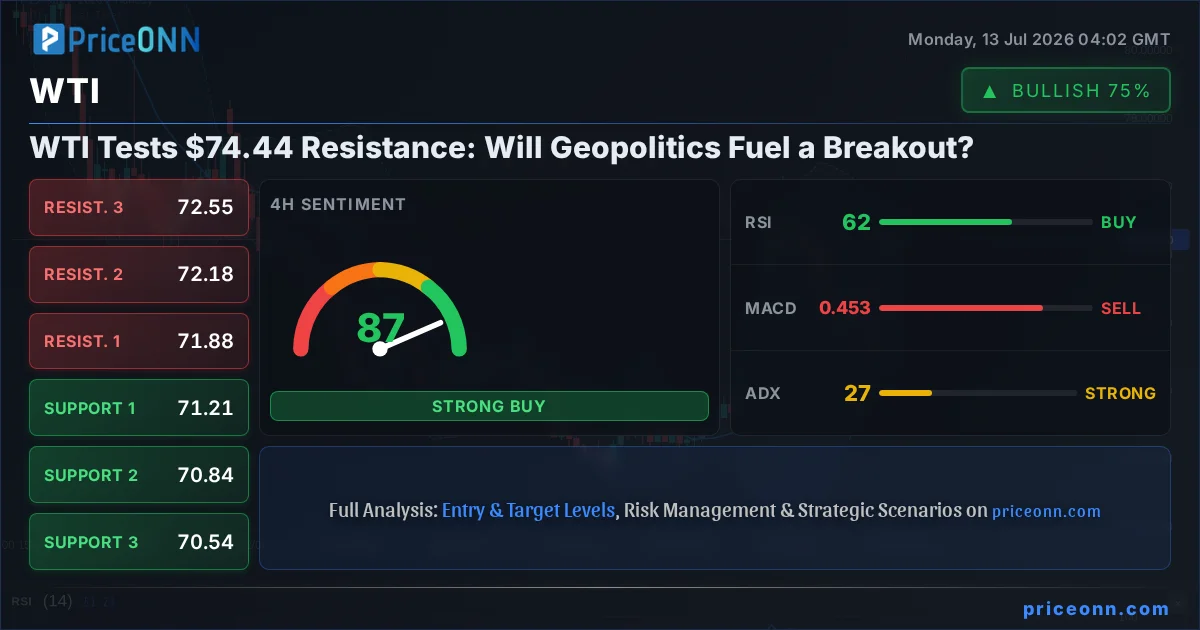
As a Senior Master Teacher specializing in energy infrastructure and a forensic expert witness, I've learned that market movements, especially in volatile commodities like WTI crude oil, are rarely just about supply and demand figures. They are deeply intertwined with geopolitical undercurrents, regulatory shifts, and the very physical infrastructure that underpins global energy flows. Right now, WTI is trading around $74.44, and the charts are screaming caution, but the news headlines are shouting something else entirely. This divergence is precisely where the real opportunity - and the real risk - lies for traders and energy market observers alike.
- WTI crude oil is currently trading at $74.44, facing resistance near $79.11 on the 1-hour chart.
- Technical indicators suggest a strong downtrend on the 1H and 4H charts, with RSI readings in neutral-to-oversold territory.
- Escalating Middle East tensions, particularly new US-Iran strikes, are a significant bullish catalyst, potentially driving inflation fears and demand for safe-haven energy assets.
- The DXY is rising, currently at 101.14, which typically exerts downward pressure on dollar-denominated commodities like WTI.
- Despite the bearish technical signals, the geopolitical backdrop and strong bullish sentiment on the 1H chart for WTI suggest a potential upside breakout is being priced in.
The immediate technical picture for WTI crude oil, as of my latest data pull, presents a complex scenario. On the 1-hour chart, the price action is currently testing resistance levels, with the immediate hurdle at $79.11, followed by $79.38 and $79.63. The overall trend on this timeframe is showing a strong 98% conviction towards the downside, with the RSI(14) sitting at 33.31 – firmly in neutral territory but leaning towards oversold conditions, suggesting sellers might be losing some momentum, or buyers are waiting to step in. The MACD is painting a negative picture, with momentum below the signal line, and Bollinger Bands are hugging the lower band, indicating potential oversold conditions or a strong bearish trend continuation. The Stochastic oscillator, with K at 14.22 and D at 31.46, also signals a bearish trend, reinforcing the idea that downward pressure is dominant in the short term. The ADX at 26.07 confirms a strong trend is in play, but its direction is clearly down for now.
When we expand the view to the 4-hour timeframe, the bearish conviction softens slightly but remains dominant. The trend is still classified as 'Düşüş' (Downtrend) with 83% power. Resistance levels are seen at $76.15, $76.42, and $76.77. The RSI(14) is at 64.76, moving into overbought territory, which could signal a potential pullback or consolidation before the next move. However, the MACD remains bearish, and Stochastic K (42.08) is below D (22.87), still favoring a downward move. The ADX at 31.24 indicates a strong trend, but the RSI is now in a different zone than the 1-hour chart, creating a slight conflict. This divergence across timeframes - strong bearish signals on the 1H and 4H but with RSI approaching overbought on the 4H - suggests that while the bears have been in control, the market might be reaching a point of exhaustion or awaiting a catalyst to shift the narrative.
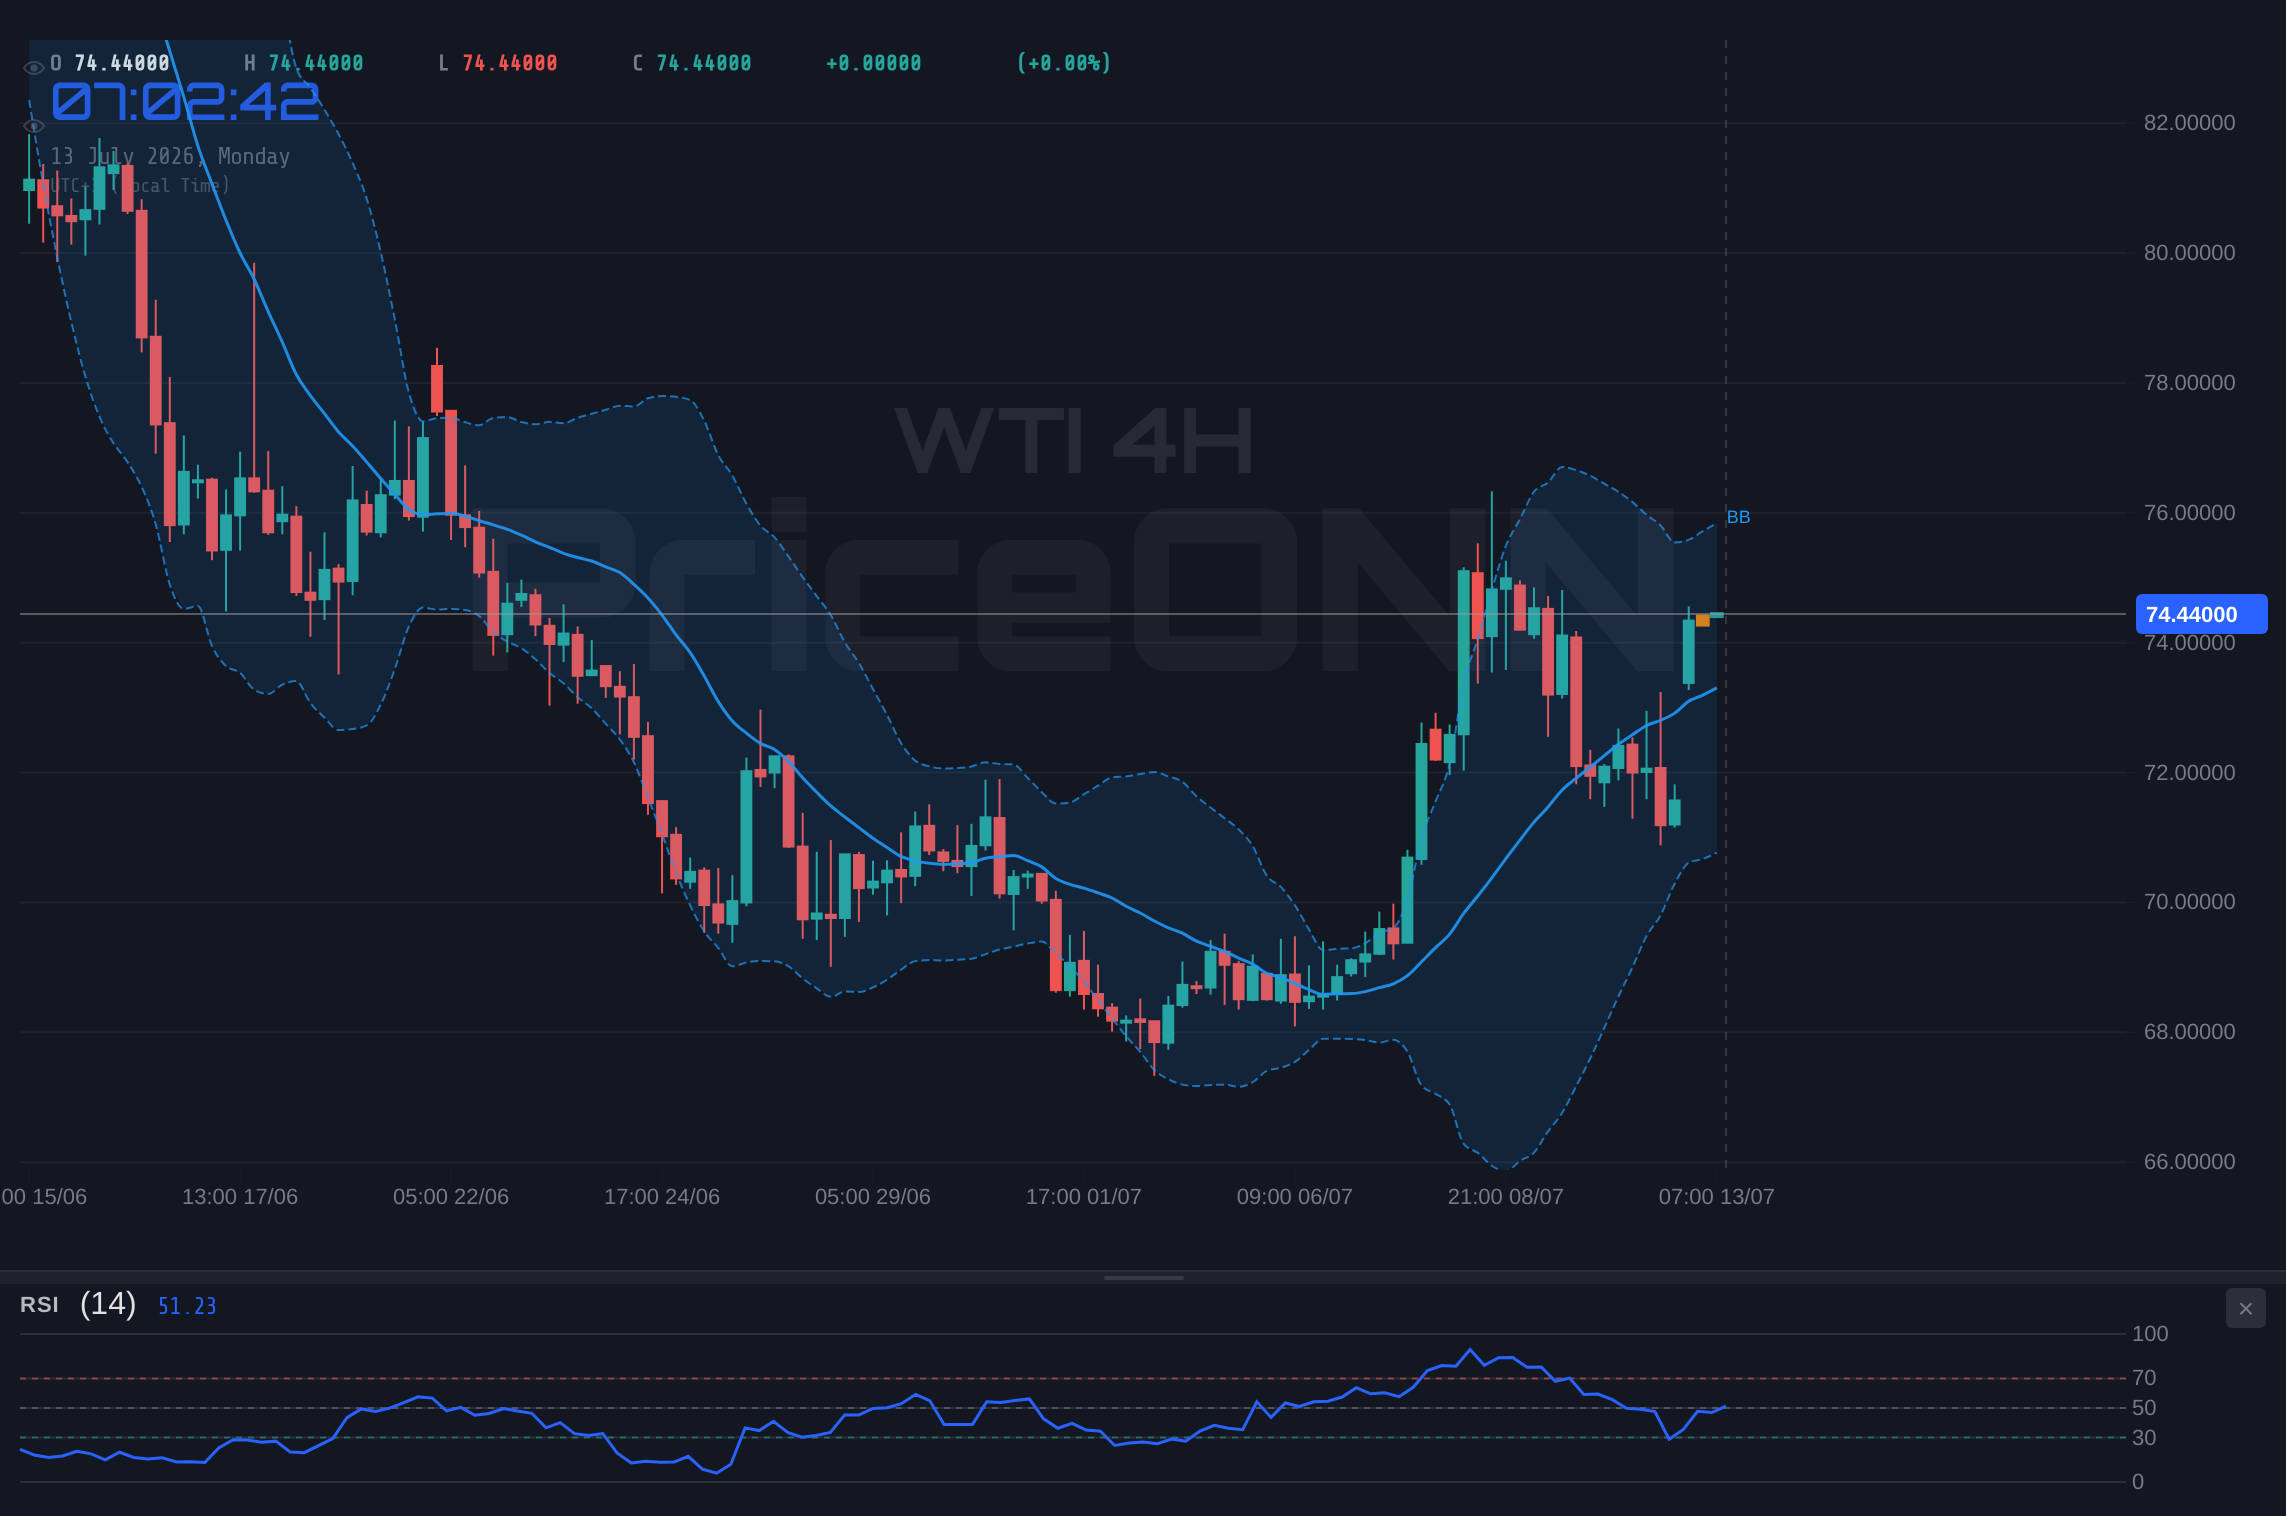
Looking at the daily chart offers a broader perspective, and here, the trend is surprisingly neutral with 50% power. This is where things get truly interesting. The daily support levels are at $74.94, $74.01, and $72.84, while resistance is observed at $77.04, $78.21, and $79.14. The RSI(14) is at 46.56, still in neutral territory but pointing downwards, indicating some selling pressure but no extreme conditions. The MACD, however, is showing positive momentum, with the MACD line above the signal line, a potential bullish divergence from the shorter timeframes. Bollinger Bands are above the middle band, suggesting an upward trend inclination on this longer timeframe, and Stochastic K (67.28) is above D (58.96), signaling a bullish trend. The ADX at 33.65 still points to a strong trend, but its direction is now more ambiguous due to the mixed signals across timeframes. This daily neutrality is crucial; it suggests that the recent downtrend might be losing steam, and the market is waiting for a significant driver to establish a new direction.
This technical setup is playing out against a backdrop of significant geopolitical developments, which cannot be overstated in the energy markets. Recent news indicates that the US has launched a new wave of strikes against Iran, and gold prices have fallen below $4,100 as these events stoke inflation fears. This is a critical piece of context. While gold, a traditional safe-haven asset, is reacting to inflation fears, crude oil, particularly WTI, often acts as a direct inflation hedge and a barometer of geopolitical risk premium. The renewed military confrontation in the Middle East, as highlighted by reports, places energy markets squarely at the center of global attention. This isn't just about the physical disruption of supply, which is always a concern, but also about the psychological impact on traders, driving up demand for assets perceived to benefit from rising energy prices and geopolitical instability.
The Dollar Index (DXY) is also a key correlation to watch. Currently trading at 101.14 and showing upward momentum, a stronger dollar typically puts pressure on dollar-denominated commodities like WTI. When the DXY rises, it makes oil more expensive for holders of other currencies, potentially dampening demand. However, in periods of intense geopolitical stress, this correlation can sometimes break down. If the market perceives rising oil prices as a primary driver of inflation, which then forces central banks to maintain hawkish stances, the dollar could strengthen concurrently with oil prices. This is a complex interplay, and the current data shows the DXY is indeed rising, currently at 101.14, adding a layer of downward pressure to WTI's price action, a factor that seems to be at odds with the bullish catalysts emerging from the Middle East.
The conflicting signals between the shorter-term technicals and the longer-term daily outlook, coupled with the escalating geopolitical tensions, create a fascinating trading environment. The 1-hour chart is undeniably bearish, showing a strong trend below key resistance levels. However, the daily chart's neutrality and bullish indicators, combined with the potential for oil prices to surge due to Middle East instability, present a compelling case for a potential breakout. It's a classic scenario where fundamental catalysts can override short-term technical trends. From an infrastructure perspective, any sustained rise in oil prices would typically signal increased global demand or, as in this case, significant supply-side risk premiums. The market is essentially weighing the immediate bearish technical momentum against the potential for a significant geopolitical-driven rally.
From a trader's perspective, this is where risk management becomes paramount. The ADX at 27.16 on the 4-hour chart and 33.65 on the daily chart indicates that a strong trend is likely to persist, regardless of its direction. The question is, which trend will dominate? Will the bearish technicals on the shorter timeframes continue to dictate price action, or will the geopolitical narrative and potential inflation fears push WTI higher, breaking through the immediate resistance levels? The fact that the 1-hour chart shows an overall signal of 'SELL' (8 buys, 0 sells, 0 neutral) while the daily chart shows a more mixed picture, with some bullish indicators like MACD and Stochastic, highlights this tension. It suggests that short-term traders are being squeezed by the broader market sentiment and the news flow.
Consider the implications for inflation. A sustained rally in WTI, driven by supply concerns, would directly feed into consumer price indices globally. This is a scenario central banks are desperately trying to avoid. If oil prices continue to climb significantly, it could force a reassessment of monetary policy, potentially leading to a stronger dollar as interest rate expectations adjust. This creates a feedback loop: geopolitical risk drives oil prices up, higher oil prices fuel inflation fears, inflation fears support a stronger dollar, and a stronger dollar can, in turn, pressure oil prices. However, the immediate impact of supply disruption fears often outweighs these secondary effects in the short term. The market is currently pricing in the immediate risk, pushing WTI upwards despite the dollar's strength.
The current price of $74.44 for WTI is a critical juncture. While immediate resistance sits at $79.11, the underlying geopolitical narrative could easily propel prices higher. The bullish signals on the daily chart, particularly the MACD and Stochastic, suggest that if a catalyst emerges, the upside could be substantial. The support levels at $74.94 and $74.01 are key to watch on any pullback. A decisive break above $79.11 would likely signal a significant shift in market sentiment, potentially triggering a cascade of buying as traders react to the geopolitical premium being fully priced in. Conversely, a failure to overcome resistance and a subsequent break below the daily support at $74.94 could signal that the technical downtrend is reasserting itself, perhaps as the initial shock of the geopolitical news fades or is deemed insufficient to disrupt actual supply.
The market is in a state of flux, balancing bearish technicals with bullish geopolitical fundamentals. This is not a time for blind trades. Patience and a clear understanding of risk management are essential. Observing how WTI reacts to the $74.44 level and the subsequent resistance points will be crucial in the coming hours and days. The interplay between the rising DXY, the potential inflation hedge of oil, and the immediate threat of supply disruptions in the Middle East creates a volatile, but potentially rewarding, environment for those who can navigate the noise and identify the true market drivers.
Bearish Scenario: Technicals Prevail
60% ProbabilityBullish Scenario: Geopolitics Drive Rally
30% ProbabilityNeutral Scenario: Consolidation Amid Uncertainty
10% ProbabilityFrequently Asked Questions: WTI Analysis
What happens if WTI breaks above the $79.11 resistance amid current geopolitical events?
A sustained move above $79.11, especially if fueled by escalating Middle East tensions, could trigger a bullish scenario. This might push WTI towards the $80.00 psychological level and potentially higher, as the market prices in a significant geopolitical risk premium.
Should I consider buying WTI at current levels around $74.44 given the mixed technical signals?
Buying at $74.44 presents a risk-reward scenario. The 1-hour chart shows strong bearish momentum, but the daily chart has bullish indicators. A conservative approach would be to wait for confirmation, such as a break above $79.11 or a hold above the $74.94 support level, before committing. Risk management is key here.
Is the RSI at 64.76 on the 4-hour chart a sell signal for WTI right now?
An RSI of 64.76 on the 4-hour chart is approaching overbought territory, which can sometimes signal a potential pullback. However, in the context of strong geopolitical drivers, RSI can remain elevated for extended periods. It's not a definitive sell signal on its own but warrants caution and suggests that further upside might face immediate resistance.
How will the rising DXY at 101.14 affect WTI prices this week?
A rising DXY typically exerts downward pressure on dollar-denominated commodities like WTI. However, the current geopolitical climate in the Middle East, which is driving oil prices higher due to supply risk fears, could potentially decouple WTI from its usual inverse correlation with the dollar. We need to watch which factor dominates: the dollar's strength or the oil-specific geopolitical premium.
Navigating the energy markets requires a blend of technical prowess and an understanding of the fundamental forces at play. The current situation with WTI crude oil, trading around $74.44, exemplifies this perfectly. While the short-term technicals paint a bearish picture, the escalating geopolitical tensions in the Middle East are injecting a significant bullish risk premium into the market. This conflict between technical signals and fundamental catalysts creates a high-stakes environment. As an expert witness, I emphasize that infrastructure and production data often lag market sentiment, making price action and news flow critical indicators. The key takeaway here is that while the immediate trend might suggest caution, the potential for geopolitical events to disrupt supply chains cannot be ignored. This creates a scenario where patience is rewarded, and waiting for a clear signal - either a confirmed breakout above resistance or a decisive failure at key support levels - is the most prudent strategy. Manage your risk, wait for your setup, and remember that the market always provides another opportunity.
| Indicator | Value | Signal | Interpretation |
|---|---|---|---|
| RSI (14) | 67.36 | Neutral | Approaching overbought, watch for pullback |
| MACD Histogram | -1.23 | Bearish | Negative momentum continues |
| Stochastic | K:14.22 D:31.46 | Bearish | Lower K below D, bearish signal |
| ADX | 33.65 | Strong Trend | Trend strength is high, direction to be confirmed |
| Bollinger Bands | Middle Band | Watch | Price above middle band on daily, below on 1H/4H |
Track markets in real-time
AI-powered analysis, technical indicators and real-time price data.
Join Our Telegram Channel
Breaking market news, AI analysis and trading signals instantly.
Join Channel