

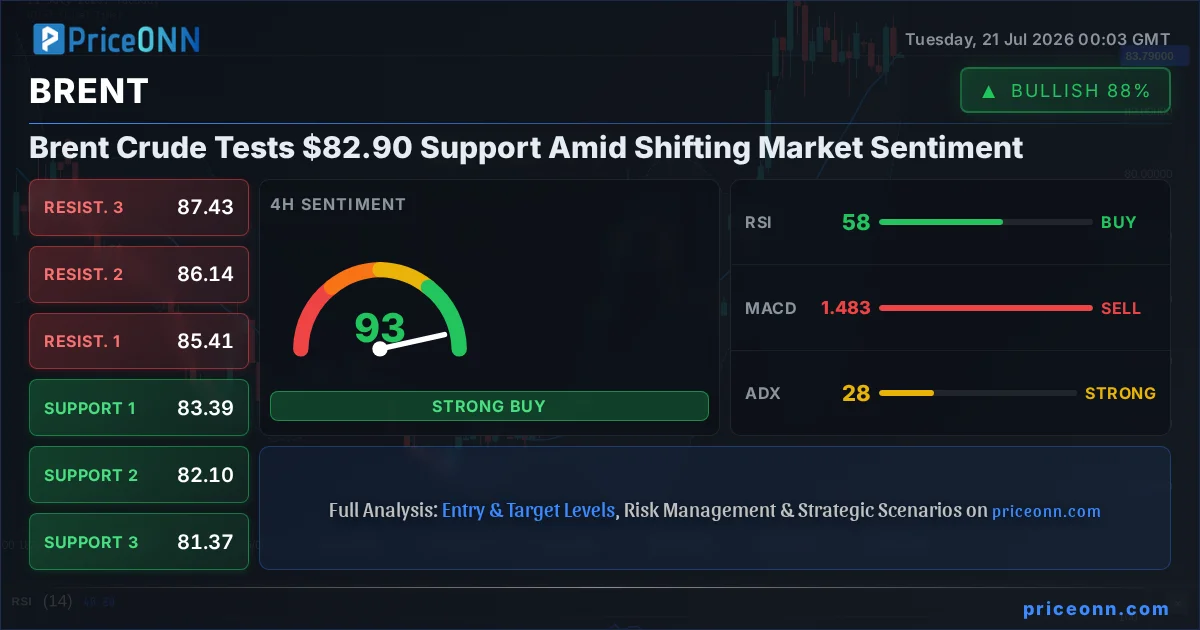
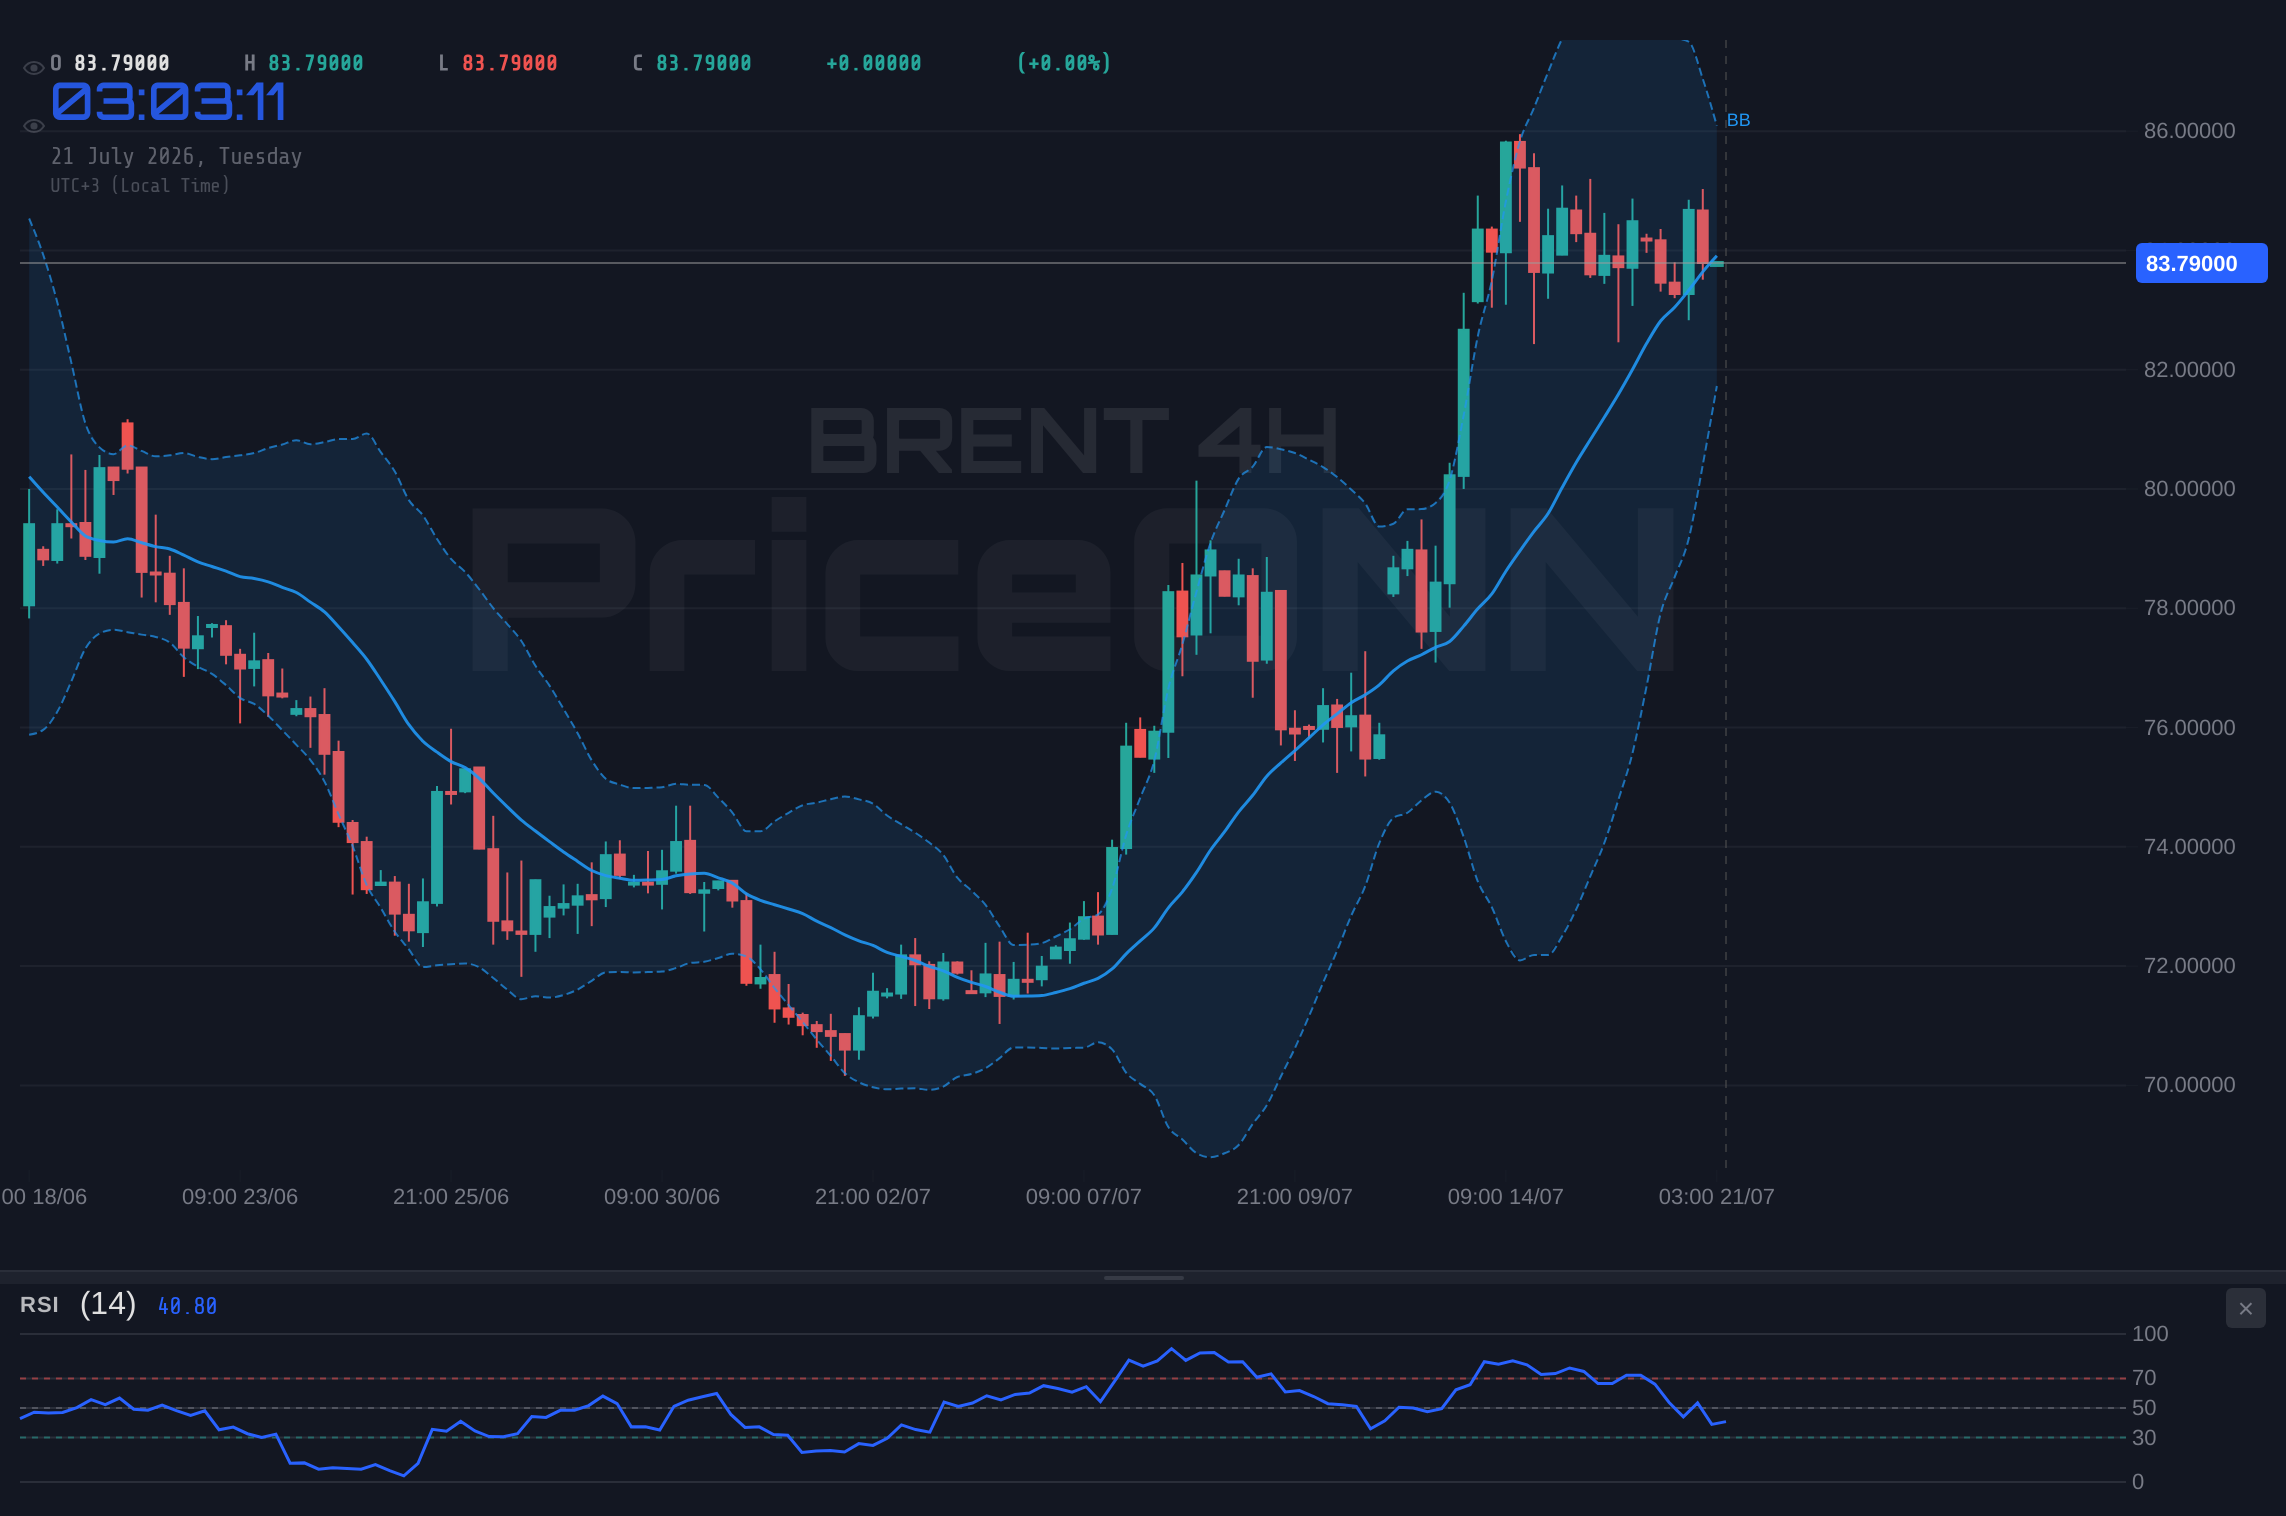
The oil market is at a critical juncture. Brent Crude, currently trading at $83.79, is testing key support levels around $82.90. This isn't just another price fluctuation; it's a moment where the interplay of geopolitical tensions, inflation expectations, and shifting central bank narratives is coming to a head. As an analyst who has closely followed the energy markets, particularly the intricate dance between production, infrastructure, and global demand, I see this period as crucial for understanding the underlying forces shaping the price of oil. The ADX reading on the daily chart, sitting at a robust 31.85, indicates a strong trend is in play, but the mixed signals across other indicators suggest the market is grappling with conflicting information. This makes today's price action on Brent a fascinating case study in market psychology and technical confluence.
- Brent Crude is currently testing support at $82.90, with the current price at $83.79.
- The daily ADX at 31.85 indicates a strong trend, but other indicators present mixed signals.
- Geopolitical risks, particularly US-Iran tensions and their potential impact on supply, are a key focus.
- Inflation expectations and central bank policy shifts are creating cross-currents for oil prices.
Navigating the $83.79 Crossroads: A Technical Deep Dive
The 1-Hour Chart: A Battle for Momentum
On the 1-hour chart, Brent Crude is showing a neutral trend with a power of 50%. The immediate support is identified at $83.44, followed by $83.18 and $82.85. Resistance is currently capped at $84.03, then $84.36, and $84.62. The RSI(14) is at 49.74, sitting squarely in neutral territory but leaning towards a bearish inclination, suggesting that the bulls are not yet in full control. Meanwhile, the MACD is exhibiting positive momentum, with the MACD line above its signal line, which typically signals potential upward movement. However, this is contradicted by the Bollinger Bands, which are situated below the middle band, indicating a bearish bias on this shorter timeframe. The Stochastic indicator presents a bearish signal with K at 43.33 and D at 59.32, where %K
The 4-Hour Chart: Bearish Undercurrents Persist
Shifting to the 4-hour timeframe, the trend remains neutral, but the power has increased to 50%. This suggests a more defined, albeit not yet dominant, directional bias. Support levels are more clearly defined at $83.39, $82.10, and $81.37. Resistance is found at $84.41, $85.41, and $86.14. The RSI(14) is at 58.18, still within the neutral zone but showing a more pronounced upward eğilim. This suggests that while not overbought, the market is showing some latent buying interest. The MACD, however, is displaying negative momentum, with the MACD line below its signal line, contrary to the RSI’s lean. This divergence is a critical point of analysis: the price action might be attempting a recovery, but the underlying momentum indicators are not yet confirming it. The Bollinger Bands are trading above the middle band, hinting at a potential bullish trend, which aligns with the RSI's upward lean. The Stochastic indicator shows K at 53.04 and D at 47.99, presenting a bullish signal as %K > %D. This is a crucial confirmation for potential upside. The ADX stands at 27.68, indicating a strong uptrend is developing. The combination of a bullish RSI, Stochastic, and a strong ADX, despite a bearish MACD, paints a picture of a market that is potentially consolidating before a significant move. The key here is the MACD's bearish divergence; if this continues to weigh on price action, the bullish signals from other indicators might be invalidated.
The Daily Chart: The Trend is Still Your Friend, Mostly
On the daily chart, Brent Crude exhibits a neutral trend with 50% power, indicating a lack of strong conviction from longer-term investors. Key support levels are located at $82.90, $81.31, and $80.16. Resistance is forming at $85.64, $86.79, and $88.38. The RSI(14) is at 54.4, in neutral territory but with a clear upward eğilim, suggesting room for further appreciation before hitting overbought conditions. The MACD is positive, with the MACD line above its signal line, reinforcing the potential for bullish momentum. This aligns well with the Bollinger Bands, which are positioned above the middle band, indicating an ongoing bullish trend on the daily scale. The Stochastic indicator is showing a strong bullish signal, with K at 88.3 and D at 79.63, both in overbought territory and %K > %D. This suggests significant buying pressure. The ADX at 31.85 confirms a strong uptrend. The confluence of a bullish RSI, a strong bullish Stochastic signal in overbought territory, a positive MACD, and a strong daily ADX is compelling. However, the immediate price action testing $82.90 support cannot be ignored. The market is at a crossroads where the longer-term bullish technical picture is being challenged by near-term price action and potentially conflicting short-term indicators.
The Geopolitical Tightrope: Iran Tensions and Supply Fears
The recent escalation in US-Iran tensions, as reported by forex news outlets, injects a significant layer of geopolitical risk into the oil market. Brent Crude's price action is highly sensitive to any perceived threat to supply from the Middle East, a region responsible for a substantial portion of global oil output. The brief spike in Brent prices to $90 in Asian trade on July 20th, following fresh escalation reports, underscores this sensitivity. While that surge may have been a knee-jerk reaction and has since subsided, the underlying risk remains. Traders are constantly assessing the probability of supply disruptions, which could rapidly shift the market's balance from one of ample supply to one of scarcity. This geopolitical risk premium is a crucial, albeit volatile, component of the current oil price. The market's reaction to these tensions is often amplified by the existing supply landscape. With OPEC+ production decisions and global demand patterns constantly evolving, any disruption in the Middle East can have outsized effects. The current neutral trend on the daily chart, despite strong technical buy signals, suggests that traders are exercising caution, perhaps waiting for more clarity on the geopolitical front before committing to a strong directional bet. The market's ability to digest these tensions without a sustained rally above resistance levels like $85.64 will be telling.
Inflation Expectations and Central Bank Signals: The Macro Crosscurrents
Beyond immediate geopolitical flashpoints, the broader macroeconomic environment continues to cast a long shadow over oil prices. Inflation remains a central concern for major economies, and oil prices are a significant contributor to inflationary pressures. The latest data from Canada, showing headline CPI rising by 2.8% YoY in June, indicates that inflation is cooling but remains a persistent factor. This backdrop directly influences central bank policy. If inflation proves stickier than anticipated, it could lead to prolonged higher interest rates, which in turn could dampen economic growth and reduce oil demand. Conversely, signs of cooling inflation might embolden central banks, like the Federal Reserve, to consider rate cuts sooner rather than later. The US Dollar Index (DXY), currently hovering around 100.7, is a key barometer for this dynamic. A strengthening dollar, often driven by hawkish Fed expectations or safe-haven demand, typically puts downward pressure on dollar-denominated commodities like Brent Crude. The DXY's own technical picture, showing a neutral trend on the daily chart but with some bullish indicators on shorter timeframes, adds another layer of complexity. If the Fed signals a continued hawkish stance, it could strengthen the dollar and weigh on Brent, potentially pushing it towards the $82.90 support. Conversely, any hint of a dovish pivot could weaken the dollar and support oil prices.
Correlating Brent with the DXY and Equities
The relationship between Brent Crude and the US Dollar Index (DXY) is a critical one for traders to monitor. Typically, a strengthening DXY leads to a weakening Brent price, and vice versa, due to oil being priced in U.S. dollars. With the DXY trading around 100.7, and showing mixed signals across timeframes - bullish on 1H, neutral on 4H, and neutral on 1D - its influence is currently complex. The 1-hour chart suggests a potential dollar strength, which would be bearish for Brent. However, the daily chart's neutral stance implies that this dollar strength might not be sustained. Furthermore, the performance of major equity indices like the S&P 500 and Nasdaq provides insight into risk appetite. The S&P 500, currently trading around 6572.87 and showing a strong daily downtrend despite a bullish 1-hour signal, indicates underlying weakness in risk assets. The Nasdaq, also showing a daily downtrend and bearish signals across timeframes, reinforces this risk-off sentiment. When risk appetite wanes, investors often move away from riskier assets like commodities and towards safer havens, which can pressure oil prices. This correlation suggests that if equity markets continue to show weakness, it could exacerbate any downward pressure on Brent, potentially accelerating a move towards the $82.90 support level.
Trading Scenarios: Navigating the Uncertainty
Bearish Scenario: Testing the Lower Bounds
65% ProbabilityNeutral Scenario: Consolidation Around $83.79
25% ProbabilityBullish Scenario: Reclaiming Higher Ground
10% ProbabilityThe Trader's Edge: Actionable Insights and Risk Management
What the Indicators Are Telling Us - A Pragmatic View
The technical indicators on Brent Crude present a complex, often contradictory, picture. On the daily chart, the ADX at 31.85 is strong, pointing to a trending market, while the RSI at 54.4 and MACD's positive momentum suggest underlying bullishness. The Stochastic oscillator is particularly noteworthy, flashing a strong buy signal at 88.3/79.63, indicating significant buying pressure and potential for further upside, albeit in overbought territory. However, this optimistic daily outlook is tempered by the shorter timeframes. The 1-hour chart shows a neutral trend with bearish elements like Bollinger Bands below the middle band and a bearish Stochastic signal. The 4-hour chart, while showing some bullish signs, is also marred by a bearish MACD divergence. This conflict is the essence of trading: identifying the dominant signal amidst the noise. For a swing trader, the daily chart's strength and bullish signals might be the primary focus, suggesting that dips towards $82.90 could be buying opportunities. However, the intraday choppiness and the bearish divergence on the 4-hour MACD demand caution. Confirmation of a sustained move above $84.03 resistance on the 1-hour chart, or a clear break and hold of $82.90 support on the daily chart, would be crucial for establishing a high-conviction trade. The key takeaway is that while the long-term technicals might lean bullish, the immediate path is fraught with short-term uncertainty.
Risk Management is Paramount: Protecting Your Capital
In a market environment characterized by mixed signals, geopolitical uncertainty, and fluctuating inflation expectations, robust risk management is not just advisable - it's essential. The current price of $83.79 for Brent Crude, with support at $82.90 and resistance at $84.03 on the 1-hour chart, presents a relatively tight trading range. For those considering a bearish position, a stop-loss order placed just above $84.03 would protect against a potential breakout. For a bullish stance, a stop-loss below the $82.90 support level would be prudent, especially given the bearish divergence seen on the 4-hour MACD. It’s also vital to consider the broader market correlations. If the DXY strengthens significantly or risk-off sentiment intensifies in equity markets, these factors could override the bullish technical signals on Brent. Always ensure your position sizing is appropriate for your risk tolerance. Remember, the market always offers another opportunity; preserving capital is the first step to capturing future gains. The current environment demands patience and discipline. Waiting for clear confirmation of the dominant trend before entering a trade significantly increases the probability of success.
Beware of Volatility Spikes: Geopolitical news, particularly concerning the Middle East, can cause rapid and significant price swings in Brent Crude. Always ensure your stop-loss orders are appropriately set and consider wider buffers during periods of heightened geopolitical tension. The $82.90 support level is critical, but a sudden news event could see it tested aggressively.
The Path Forward: What to Watch in Brent Crude
The immediate focus remains on the $82.90 support level. A sustained break below this could trigger further selling towards $81.31. Conversely, a decisive move above the $84.03 resistance, followed by a push past $84.62, would signal a potential shift in momentum, targeting higher resistance levels around $85.64. The interplay between these levels, influenced by geopolitical headlines and macroeconomic data, will dictate Brent's trajectory in the short to medium term.
Frequently Asked Questions: Brent Crude Analysis
What happens if Brent Crude breaks below the $82.90 support level?
If Brent Crude closes decisively below the $82.90 support on the daily chart, it would invalidate the current bullish bias suggested by longer-term indicators. This could trigger a move towards the next significant support at $81.31, driven by increasing selling pressure and potential stop-outs.
Should I consider buying Brent at current levels around $83.79 given the mixed signals?
Buying at $83.79 requires caution due to the mixed signals and the test of $82.90 support. A more prudent approach would be to wait for confirmation: either a solid bounce off $82.90 with bullish divergence, or a confirmed breakout above $84.03 resistance. Risk management is key; consider a stop-loss below $82.85 for any bullish entry.
Is the RSI at 54.4 on the daily chart a buy signal for Brent Crude?
An RSI of 54.4 is in neutral territory and shows an upward eğilim, suggesting room for price appreciation. While not an immediate buy signal on its own, it supports a bullish outlook if confirmed by other indicators and price action, especially if Brent holds above $82.90 support.
How will potential US-Iran tensions affect Brent Crude prices this week?
Heightened US-Iran tensions significantly increase the risk premium on oil prices. Any perceived threat to supply routes or production in the Middle East could rapidly push Brent Crude towards resistance levels like $85.64 or even higher, overriding current technical patterns.
Technical Outlook Summary
| Indicator | Value | Signal | Interpretation |
|---|---|---|---|
| RSI (14) | 54.4 | Neutral | Suggests room for upside, but not overbought. |
| MACD | Positive | Bullish | Momentum above signal line on daily chart. |
| Stochastic | 88.3 / 79.63 | Bullish (Overbought) | Strong buying pressure, but nearing extreme levels. |
| ADX | 31.85 | Strong Trend | Indicates a strong trending market on daily chart. |
| Bollinger Bands | Above Mid Band | Bullish | Price trading above the middle band on daily. |
Key Levels
Bearish Scenario: Testing the Lower Bounds
65% ProbabilityNeutral Scenario: Consolidation Around $83.79
25% ProbabilityBullish Scenario: Reclaiming Higher Ground
10% ProbabilityTrack markets in real-time
AI-powered analysis, technical indicators and real-time price data.
Join Our Telegram Channel
Breaking market news, AI analysis and trading signals instantly.
Join Channel