

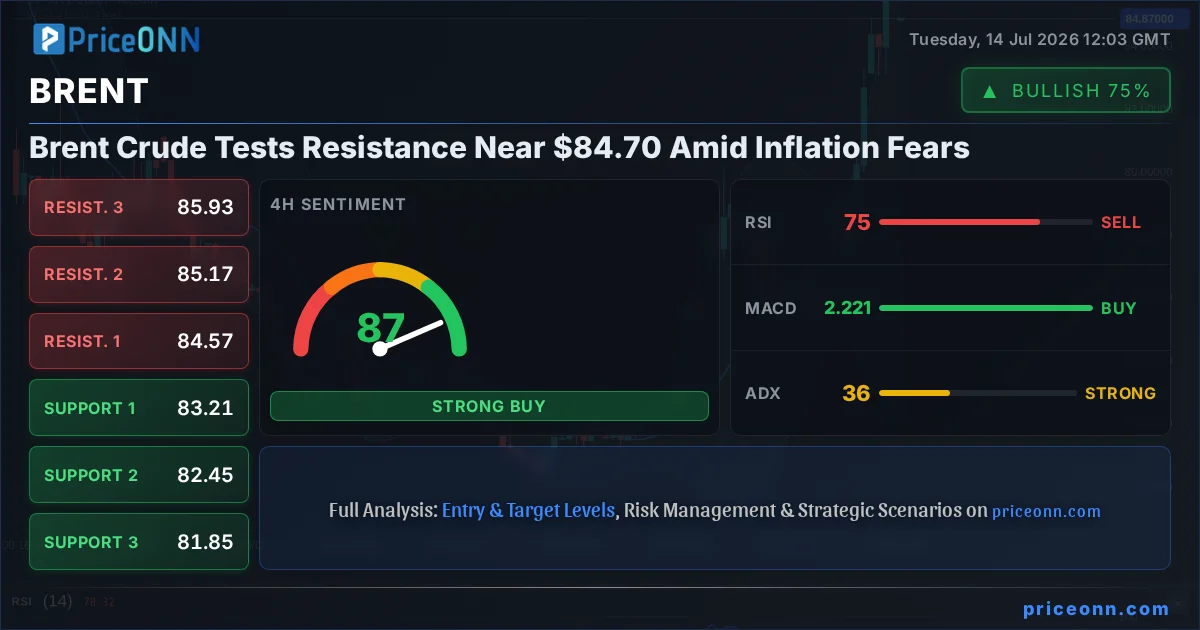
Brent Crude is currently navigating a critical juncture, trading at $84.70 and probing resistance levels that could dictate its near-term trajectory. The recent surge in oil prices, driven by a confluence of geopolitical anxieties and a renewed focus on inflation, has brought Brent back into the spotlight. As traders eye the $84.94 resistance, the market is grappling with conflicting signals: strong upward momentum in oil prices clashes with broader economic uncertainties and the potential for central bank policy shifts. This analysis delves into the technical and fundamental underpinnings of Brent's current price action, exploring the key drivers and offering a forward-looking perspective on potential market movements.
- RSI at 66.94 indicates a strong upward trend but hovers near overbought territory, suggesting caution is warranted.
- Key resistance sits at $84.94, a level that needs to be decisively broken for further upside momentum.
- The ADX at 52.94 shows a very strong uptrend on the 1-hour chart, confirming robust buying pressure.
- Geopolitical tensions and upcoming US CPI data are key factors influencing Brent's correlation with inflation expectations and the DXY.
The energy market is witnessing a significant uptick in activity, with Brent Crude leading the charge. Currently priced at $84.70, the commodity has shown a remarkable daily increase of 2.04%, adding $1.64 to its value. This upward momentum is not a fleeting event; it's supported by a powerful trend strength indicated by the ADX at 52.94 on the 1-hour timeframe, classifying it as a very strong uptrend. This technical backdrop suggests that buyers are firmly in control, pushing prices higher with conviction. The 1-hour RSI at 66.94, while indicating a strong upward trend, is also approaching the overbought threshold, hinting that a short-term pause or consolidation might be on the horizon before any significant continuation. The immediate price action is focused on the $84.94 resistance level, a critical barrier that, if breached decisively, could pave the way for further gains.
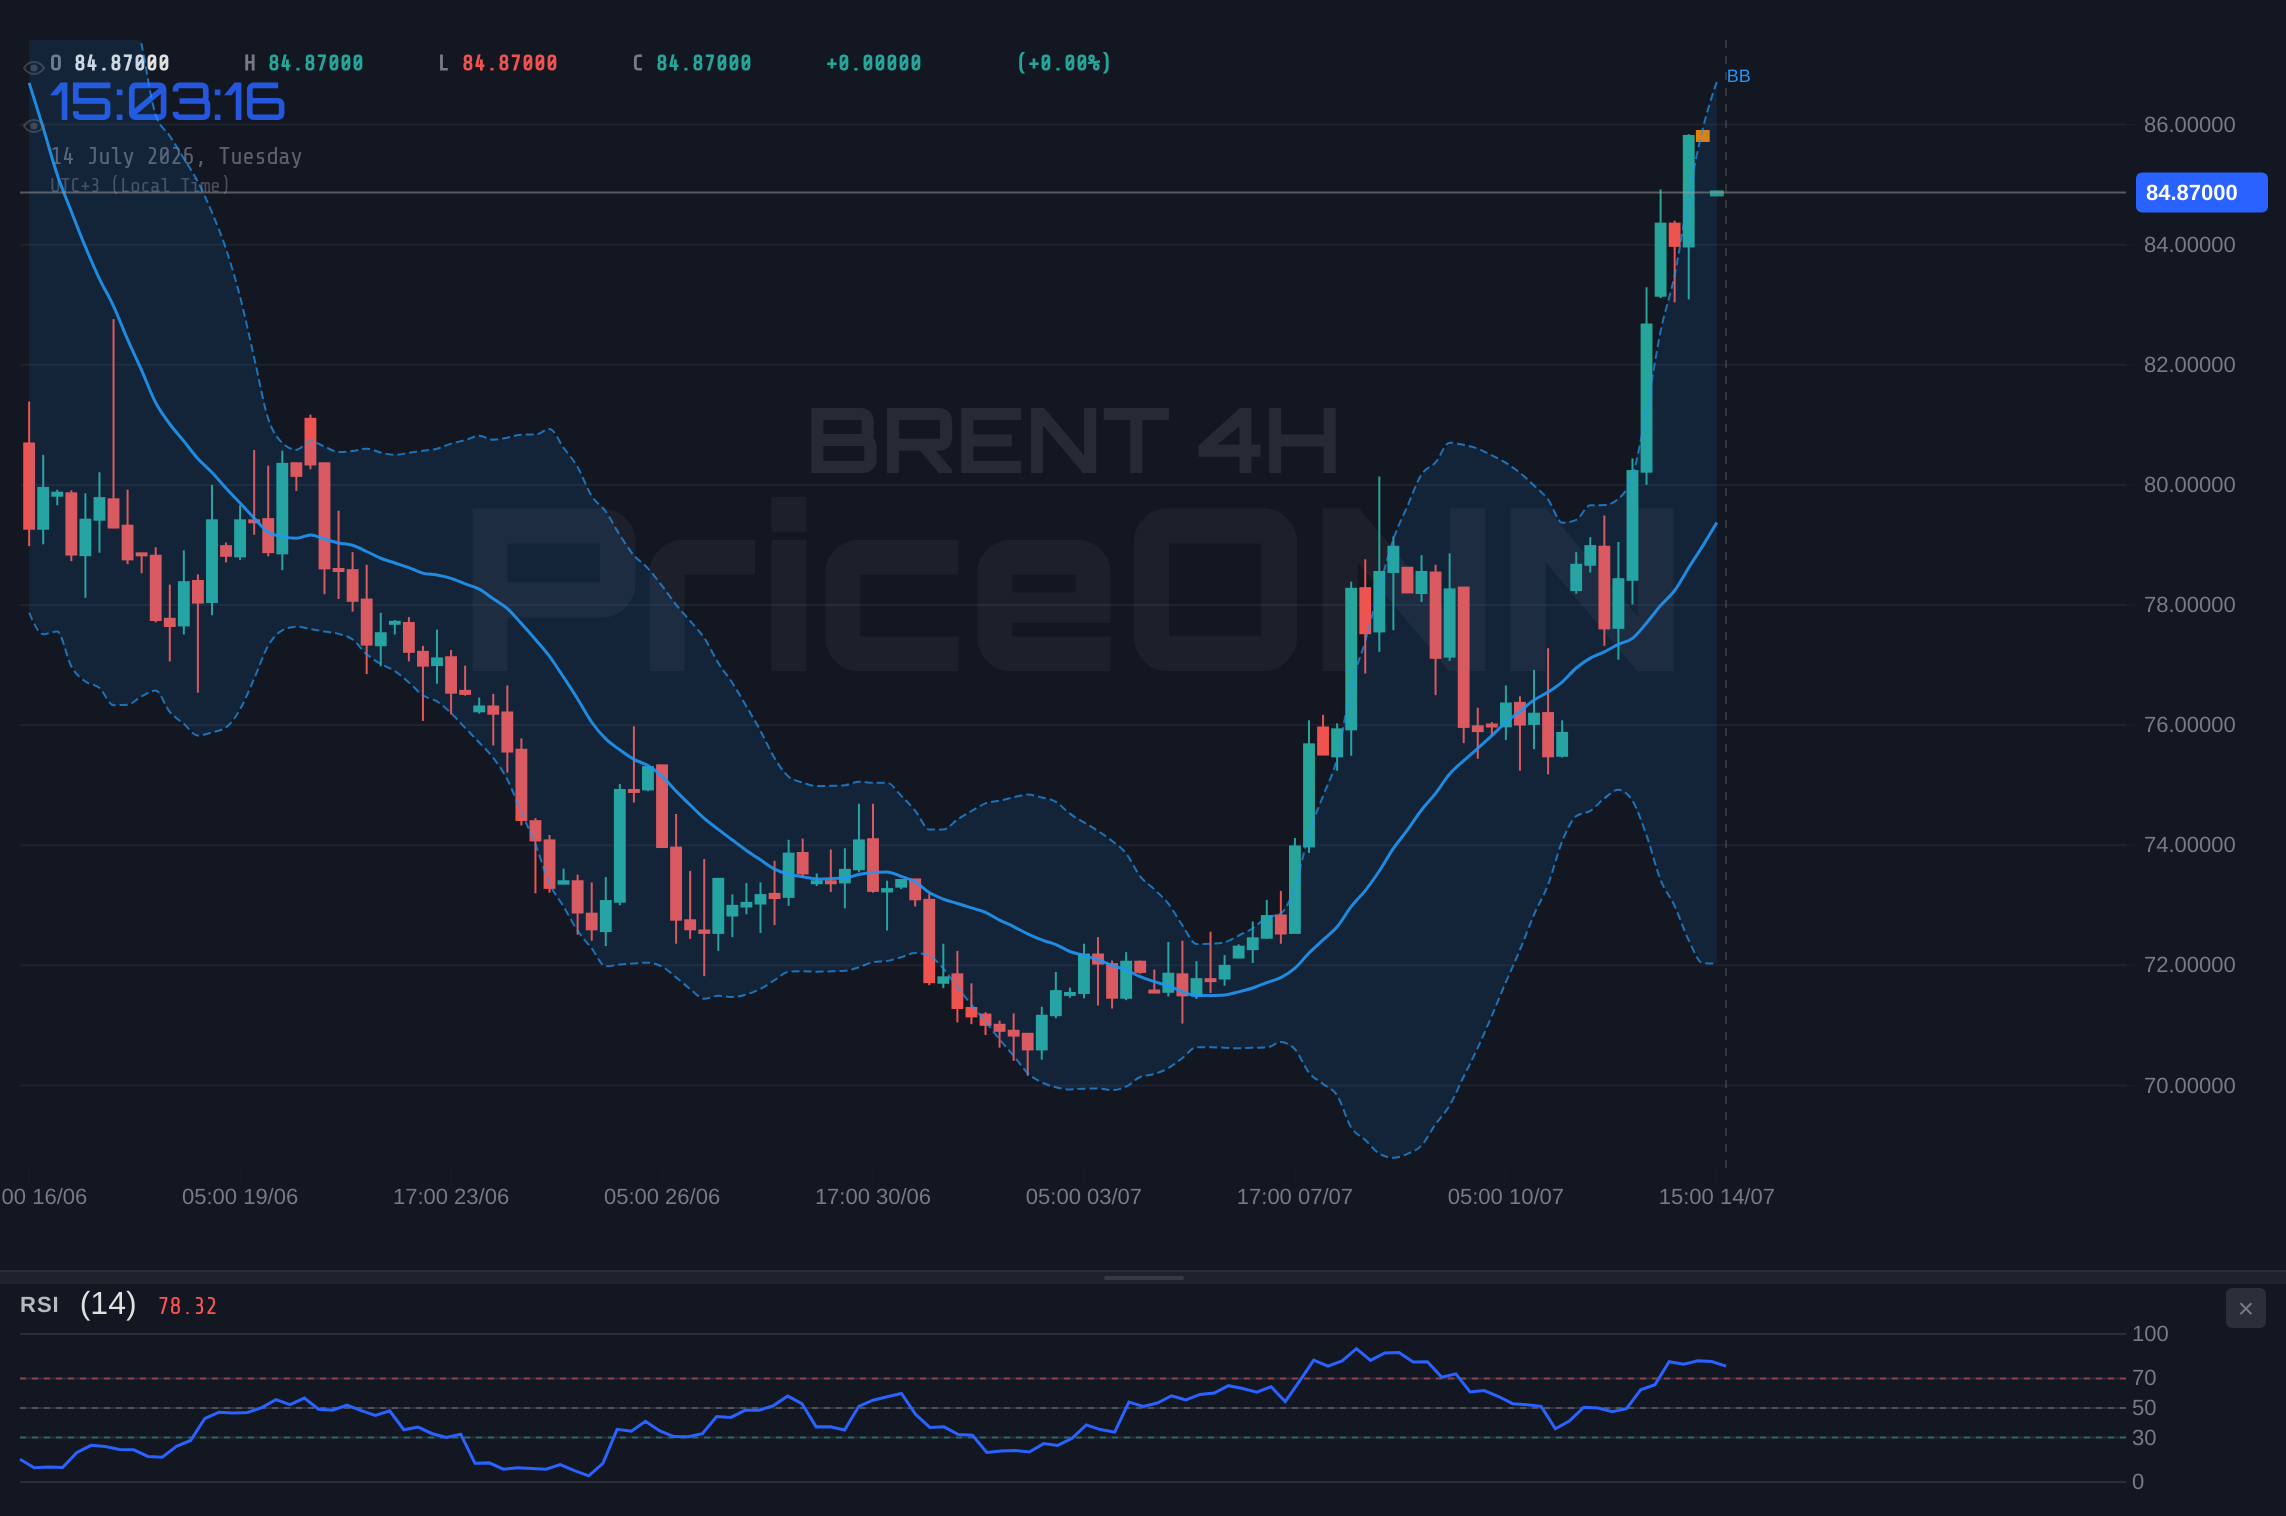
Delving deeper into the technical indicators, the 4-hour chart paints a similarly bullish picture, albeit with a slight cautionary note. The RSI at 74.9 is firmly in overbought territory, suggesting that the market may be overheated and susceptible to profit-taking. However, the MACD is showing positive momentum, with the MACD line above the signal line, and Bollinger Bands are trading above the upper band, indicating strong upward pressure. The ADX at 36.33 still signifies a strong uptrend, reinforcing the bullish sentiment. The Stochastic Oscillator, with K at 90.39 and D at 86.1, is also in overbought territory, further emphasizing the potential for a near-term pullback. Despite these overbought conditions, the overall trend direction remains upward, suggesting that any dips might be viewed as opportunities by longer-term buyers.
On the daily timeframe, Brent Crude's trend is currently neutral, with a 50% trend strength. This suggests a period of equilibrium after the recent strong moves, or perhaps a consolidation phase before the next significant directional move. The RSI at 56.09 sits comfortably in the neutral zone, showing room for further upward movement. The MACD is positive, with the MACD line above the signal line, and Bollinger Bands are trading above the upper band, indicating a bullish inclination. The Stochastic Oscillator, with K at 81.53 and D at 69.46, is in overbought territory, reinforcing the idea of potential consolidation or a minor pullback. The ADX at 33.48 still indicates a strong uptrend, suggesting that the underlying strength supporting the price remains significant, even if the immediate direction is consolidating. The key support level on the daily chart is identified at $78.74, while resistance lies at $84.94, followed by $87.22.
The Inflationary Echo: How Oil Prices Shape Macroeconomic Narratives
The resurgence in oil prices, with Brent Crude at $84.70, is more than just a commodity market movement; it's a significant signal for the broader economy, particularly concerning inflation. Rising energy costs have a cascading effect, influencing transportation, manufacturing, and consumer spending. The recent uptick in oil prices, fueled by geopolitical tensions and supply-side concerns, is rekindling fears of sustained inflation. This is particularly relevant as the US prepares to release its June Consumer Price Index (CPI) data. Analysts anticipate that falling fuel prices might have cooled overall inflation, but the surge in crude could present a sticky component, challenging this narrative. The market's reaction to this data will be crucial, as it could influence central bank policy, especially the Federal Reserve's stance on interest rates. A higher-than-expected CPI reading, potentially driven by energy costs, could bolster the case for a more hawkish monetary policy, impacting everything from equity markets to currency valuations.
The correlation between oil prices and inflation expectations is a well-established phenomenon. When oil prices rise, as they are doing with Brent Crude testing $84.70, it directly impacts the cost of goods and services, contributing to inflationary pressures. This is particularly concerning for central banks like the Federal Reserve, which are striving to bring inflation back to their target levels. The market is closely watching the US CPI report, scheduled for release, for clues on the trajectory of inflation. If the energy component remains elevated or shows signs of renewed strength, it could complicate the Fed's decision-making process. This could lead to a more cautious approach towards monetary easing, or even a reconsideration of future rate hikes, which would have significant implications for global financial markets. The DXY, currently trading around 101.08, is also a key indicator to watch; a strengthening dollar typically exerts downward pressure on commodities like oil, creating a complex interplay of forces.
Furthermore, geopolitical developments continue to play a pivotal role in shaping the oil market's outlook. The news that the ceasefire in a conflict zone is over, and fighting has started, directly impacts supply-side concerns. Such events create uncertainty and risk premiums in oil prices, pushing them higher. This is a classic example of how geopolitical instability can translate into tangible market movements. The market's sensitivity to these events means that any escalation or de-escalation can lead to rapid price adjustments. For Brent Crude, currently at $84.70, these geopolitical risks are a significant supporting factor, contributing to the upward pressure alongside fundamental supply and demand dynamics. The market’s reaction to such news often involves a swift repricing, reflecting the perceived immediate threat to oil supply chains.
Navigating the Currents: Technical Signals and Price Action
From a technical standpoint, the $84.70 price for Brent Crude presents a fascinating battleground. The 1-hour chart shows strong bullish signals with an ADX of 52.94, indicating a powerful trend. However, the RSI at 66.94 and Stochastic K at 76.5, D at 81.58 suggest that the immediate upside might be limited by overbought conditions. This creates a scenario where a short-term pullback to test the $84.72 support level is plausible. A failure to hold this support could lead to a deeper correction, potentially towards the $84.35 level. Conversely, a decisive break above the $84.94 resistance, coupled with sustained buying volume, could signal the continuation of the bullish trend, with the next significant resistance at $86.07.
The 4-hour chart reinforces the bullish trend, but with clearer signs of overextension. The RSI at 74.9 is a strong indicator of overbought conditions, and the Stochastic K at 90.39 is extremely high, suggesting a potential reversal or at least a significant pause. While the MACD and ADX (36.33) still point to a strong uptrend, the confluence of overbought indicators on shorter timeframes suggests that caution is warranted for new entries. Any pullback could target the $83.21 support level. For the bullish case to remain intact, prices need to consolidate above the $84.70 mark and ideally break through the $84.94 resistance without a significant drop in momentum. The market structure here is key: is this a healthy continuation pattern, or a blow-off top before a correction?
On the daily chart, the picture is more balanced, with a neutral trend and RSI at 56.09 offering room for further upside. The MACD shows positive momentum, and the Bollinger Bands are above the upper band, indicating bullish bias. However, the Stochastic K at 81.53 and D at 69.46 suggests overbought conditions are developing. The ADX at 33.48 still confirms a strong trend, but the neutral 50% trend strength suggests that the market is in a transition phase. Key support levels to watch on the daily chart are $78.74 and $74.82, while resistance is eyed at $84.94 and $87.22. The current price of $84.70 is right at the cusp of a significant resistance, making the next few trading sessions crucial for determining the short-to-medium term direction.
The Dollar's Dance and Equity's Echo
The movement of the US Dollar Index (DXY) is intrinsically linked to the performance of commodities like Brent Crude. Currently, the DXY is trading around 101.08, showing a slight downtrend on the 1-hour chart but a bullish trend on the 4-hour and daily charts. Generally, a stronger dollar tends to put downward pressure on oil prices, as oil is typically priced in dollars. However, the current market dynamics show oil prices rising despite a mixed dollar signal. This could indicate that specific supply-side factors and geopolitical risks are overriding the typical dollar-commodity correlation, or that the dollar's strength is not yet significant enough to counteract the bullish sentiment in oil. If the DXY were to resume a strong upward trend, it could pose a headwind for Brent Crude, potentially capping further gains above $84.70.
Simultaneously, the performance of major equity indices like the S&P 500 and Nasdaq provides insights into overall market risk appetite. The S&P 500 is currently showing a bullish trend on the 1-hour and 4-hour charts, trading at 6572.87, but a bearish trend on the daily chart. The Nasdaq 100 is also showing mixed signals across timeframes. A general risk-off sentiment, reflected in falling equity markets, often leads investors to seek safe-haven assets, which can include gold and sometimes the dollar, but can also reduce demand for riskier assets like commodities if it signals a broader economic slowdown. Conversely, a strong risk-on environment, with equities rallying, can boost demand for oil as it signals economic growth. The current mixed signals from equities suggest a cautious market sentiment, where investors are weighing inflation concerns against potential economic slowdowns, adding another layer of complexity to Brent's price discovery around $84.70.
Looking Ahead: Catalysts and Scenarios
The path forward for Brent Crude at $84.70 will likely be shaped by several key catalysts. The upcoming US CPI data is paramount. If inflation proves stickier than expected, especially with rising energy prices, it could force the Fed into a more hawkish stance, potentially strengthening the dollar and pressuring oil. Conversely, if inflation cools as anticipated, it might allow the Fed more room to consider easing, which could weaken the dollar and support commodity prices. Geopolitical developments in the Middle East and other key oil-producing regions remain a constant wildcard, capable of introducing sudden supply shocks and price spikes. Additionally, OPEC+ production decisions and global demand forecasts will continue to be fundamental drivers. The market's ability to digest these factors will determine whether Brent can sustain its push above the $84.94 resistance or if it faces a significant correction.
Bearish Scenario: Profit-Taking Pressure Mounts
35% ProbabilityNeutral Scenario: Consolidation Around $84.70
40% ProbabilityBullish Scenario: Resistance Breakout Continues
25% ProbabilityFrequently Asked Questions: Brent Crude Analysis
What happens if Brent Crude breaks above $84.94 resistance?
A decisive break above $84.94 resistance, especially with increased volume, would likely signal a continuation of the bullish trend. This could target the next key resistance level at $85.95, potentially extending towards $86.44 as buyers gain further control.
Should I buy Brent Crude at current levels around $84.70 given the RSI at 67?
Buying at $84.70 with an RSI of 67 presents a mixed risk-reward. While momentum is bullish, the RSI is approaching overbought territory, suggesting a potential for a short-term pullback. A more prudent approach might involve waiting for a confirmed break above $84.94 or a pullback to a support level like $84.35, offering a better risk-reward ratio.
Is the ADX at 52.94 a strong buy signal for Brent Crude's trend analysis?
An ADX reading of 52.94 on the 1-hour chart indicates a very strong trend, confirming robust buying pressure. While this signals a strong uptrend, it doesn't necessarily dictate a buy entry on its own. It suggests that if a breakout occurs, it is likely to be sustained, but traders should still look for confirmation from other indicators and price action, especially considering the overbought RSI.
How will upcoming US CPI data affect Brent Crude prices around $84.70?
Upcoming US CPI data is a critical catalyst. If inflation is higher than expected, particularly driven by energy costs, it could strengthen the dollar and pressure Brent Crude, potentially pushing it below $84.70. Conversely, cooler inflation might weaken the dollar and support oil prices, aiding a move above $84.94.
Technical Outlook Summary
| Indicator | Value | Signal | Interpretation |
|---|---|---|---|
| RSI (14) | 66.94 | Neutral | Approaching overbought, watch for pullback |
| MACD Histogram | Positive | Bullish | Momentum is strong |
| Stochastic | K:76.50, D:81.58 | Bearish | Overbought, potential reversal |
| ADX | 52.94 | Bullish | Very strong trend |
| Bollinger | Upper Band | Bullish | Price above upper band |
Track markets in real-time
AI-powered analysis, technical indicators and real-time price data.
Join Our Telegram Channel
Breaking market news, AI analysis and trading signals instantly.
Join Channel