

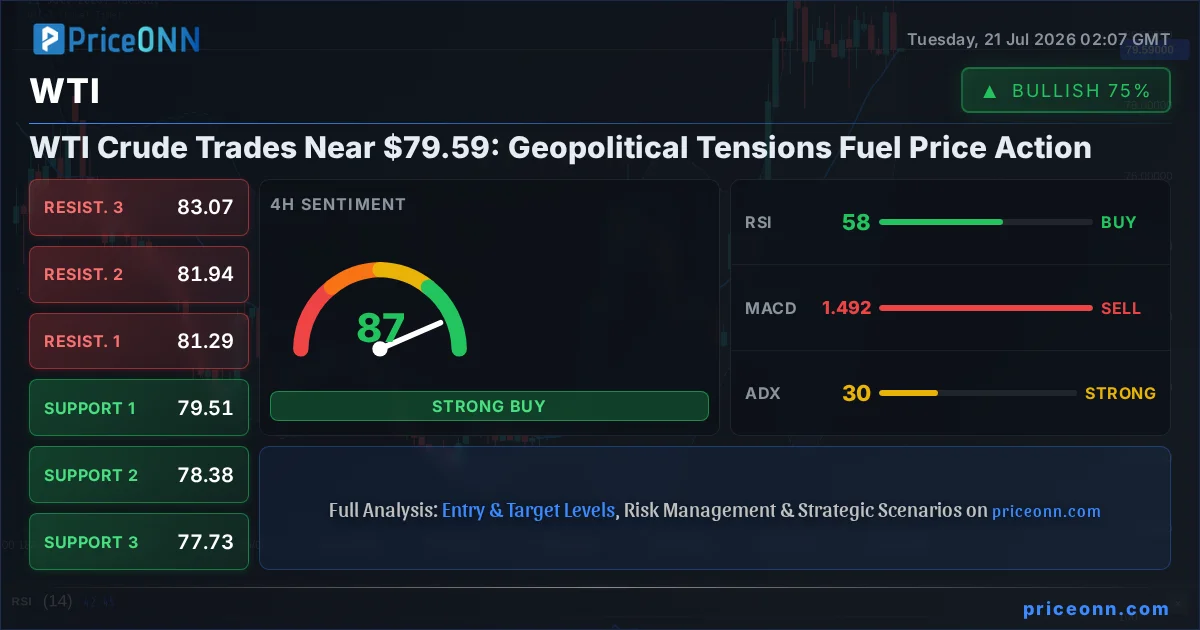
WTI crude oil is currently navigating critical levels, trading near the $79.59 mark. This price point is drawing significant attention as renewed geopolitical tensions, particularly between the U.S. and Iran, inject a potent dose of volatility into the energy markets. The specter of potential supply disruptions in the Middle East, a region pivotal to global oil production, is the primary catalyst driving this price action. As traders digest these developments, the interplay between crude oil, the U.S. Dollar Index (DXY), equity markets, and broader inflation expectations becomes paramount for understanding the immediate and medium-term trajectory of WTI.
- RSI at 46.91 on the 1H chart signals a neutral to slightly bearish momentum, suggesting a lack of strong conviction.
- Critical support for WTI sits at $79.23 (1H support), a level that needs to hold for the bulls to maintain any semblance of control.
- The ADX at 10.18 on the 1H timeframe indicates a weak trend, implying that the current price action may be range-bound or a precursor to a larger move.
- DXY's strength near 100.7 is putting pressure on commodities like WTI, reflecting a broader risk sentiment influenced by geopolitical events.
The Bull's Roadmap: Can WTI Push Higher?
For WTI crude oil to break its current bearish lean and establish a sustained upward trajectory, several technical and fundamental conditions must align. The immediate hurdle is the $79.83 resistance level on the 1-hour chart. A decisive break and hold above this mark, ideally with increasing volume, would signal a potential shift in sentiment. Confirmation would come from the RSI moving above 50 and MACD showing stronger positive momentum. Should this bullish scenario unfold, the next target would be the $80.17 resistance, followed by the $80.43 level. The 4-hour chart also presents a more optimistic picture, with a general signal leaning towards 'BUY'. The ADX at 30.49 on this timeframe suggests a strengthening trend, and if the price can consolidate above $79.59, aiming for the 4H resistance at $81.29 could become a realistic short-term objective. However, the overall trend strength on the 1D chart remains neutral (50%), indicating that while there are bullish signals on shorter timeframes, the longer-term picture is still undecided, requiring caution.
Where Bears Take Control: Revisiting Lower Levels
The bearish case for WTI hinges on its failure to hold key support levels. The immediate 1-hour support is identified at $79.23. A close below this level would likely trigger a cascade of selling, targeting the subsequent support at $78.97 and then $78.63. The 1-hour RSI currently at 46.91 shows room to fall before reaching oversold territory, and the MACD's negative momentum reinforces this bearish outlook. On the 4-hour timeframe, while the overall signal is mixed, a break below the $79.51 support could accelerate downside pressure, pointing towards the $78.38 and $77.73 levels. The daily chart, however, presents a more concerning picture for the bulls. With an ADX of 29.46 indicating a strong trend (though directionally neutral at 50% strength), any significant bearish catalyst could see WTI revisit lower ground. The confluence of geopolitical de-escalation, a stronger U.S. Dollar, or signs of easing inflation could easily push prices down. A break below the $78.99 daily support would be a significant bearish signal, opening the door for a deeper correction towards the $77.57 and $76.63 levels.
The Waiting Game: Consolidation and Mixed Signals
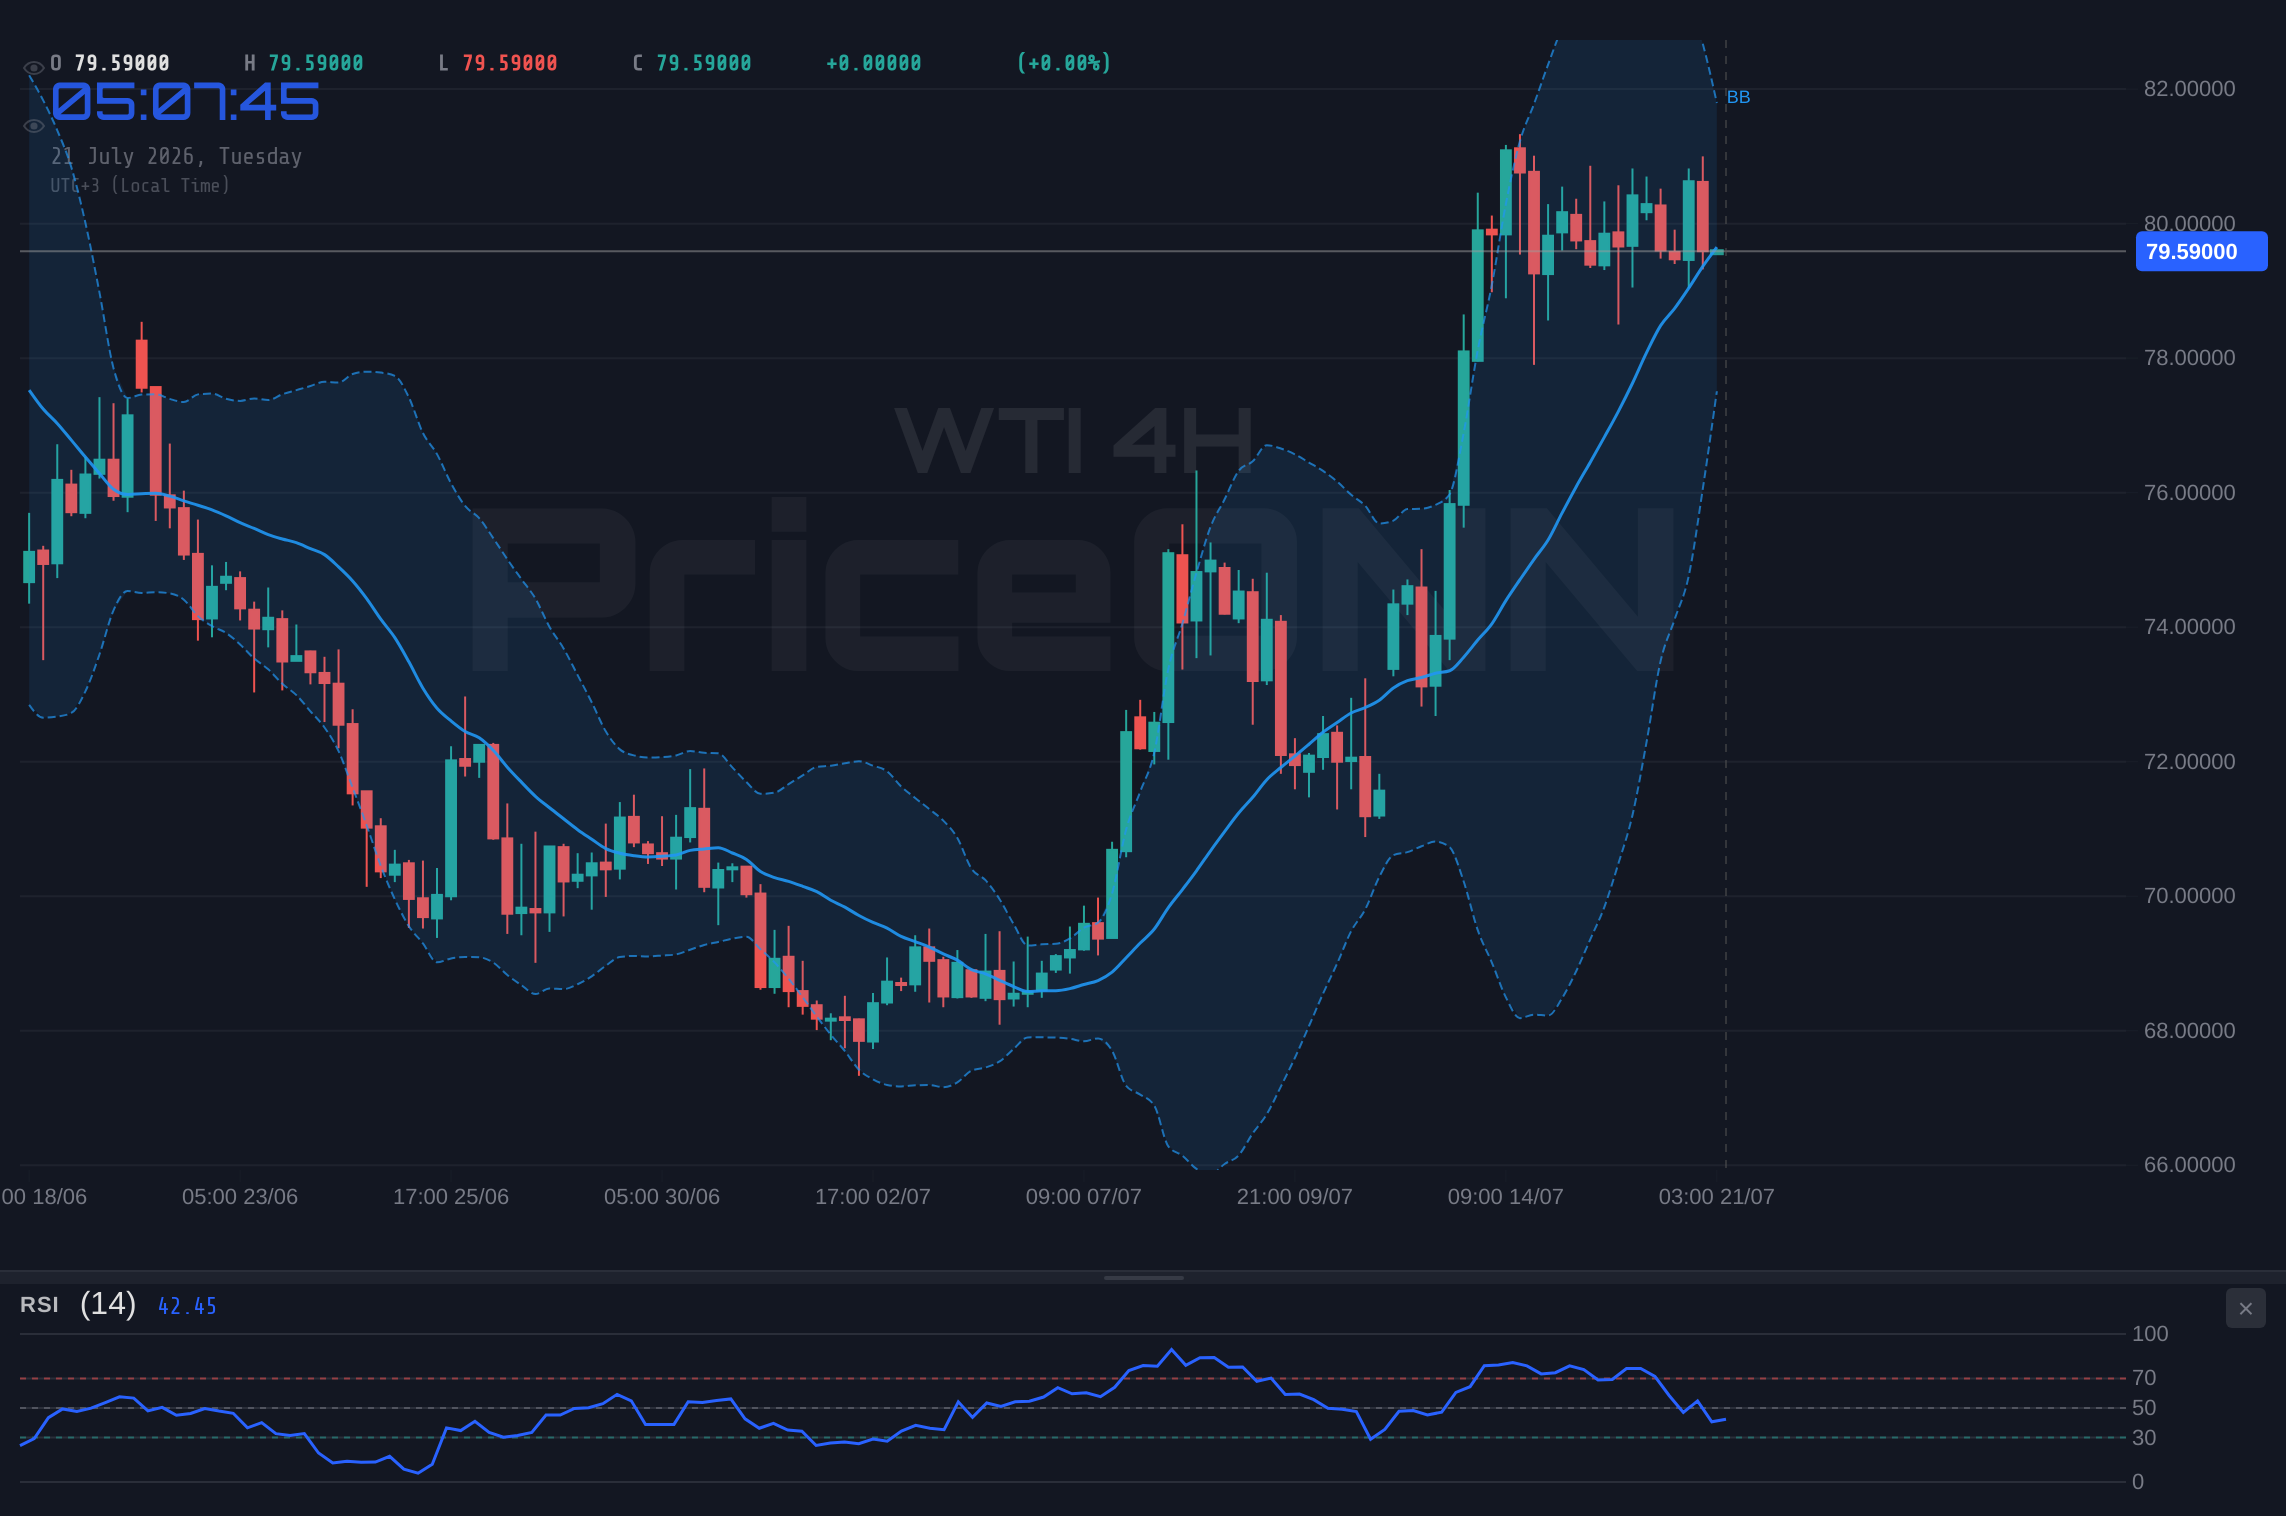
The current market data paints a picture of indecision, particularly when looking across different timeframes. While shorter-term charts (1H) show mixed signals with weak trend strength (ADX: 10.18), and the 1D chart remains neutral at 50% strength, the 4H chart exhibits a stronger trend (ADX: 30.49) but with conflicting indicator signals. For instance, the 1H Stochastic is showing a potential rise (%K > %D), while the MACD suggests negative momentum. Conversely, the 1D Stochastic is flashing a strong buy signal (%K > %D), yet the MACD indicates negative momentum. This divergence suggests that WTI might be consolidating, awaiting a clearer catalyst to break out of its current range. The narrow daily range of $79.04 - $81 suggests a market in a holding pattern. Traders are likely waiting for more definitive news regarding U.S.-Iran relations, OPEC+ production decisions, or key economic data releases that could influence global demand and inflation expectations. Until then, price action may remain choppy, with gains likely to be capped and pullbacks finding temporary support.
Market Correlations: DXY, Equities, and the Inflation Narrative
The price action in WTI crude oil cannot be viewed in isolation. Its movements are intrinsically linked to broader market dynamics. The U.S. Dollar Index (DXY) is currently showing a rising trend, trading near 100.7. A stronger dollar typically exerts downward pressure on dollar-denominated commodities like oil, as it becomes more expensive for holders of other currencies. The DXY's 1H chart shows a bullish signal with RSI at 56.6 and MACD in positive territory, reinforcing this inverse correlation. Simultaneously, equity markets present a mixed picture. The S&P 500 is showing a daily downtrend (ADX: 47.51) despite a recent positive daily change, while the Nasdaq 100 shows a strong 1H downtrend (ADX: 33.23). This suggests a cautious risk appetite, which usually weighs on commodity prices unless specific supply-driven factors are at play, as seen with the U.S.-Iran tensions. Furthermore, oil prices remain a key indicator for inflation expectations. Any sustained rally in WTI could reignite inflation concerns, potentially influencing central bank policy decisions, although current data shows a neutral stance on the 1D chart for DXY (50% strength).
The U.S.-Iran Factor: Supply Risk Premium
The immediate driver behind the recent surge in WTI crude oil prices is the heightened geopolitical tension between the United States and Iran. Reports indicate renewed escalations, raising concerns about potential disruptions to oil flow from the Persian Gulf. Historically, such events inject a 'risk premium' into oil prices, reflecting the market's anticipation of supply shortages, even if actual disruptions haven't yet occurred. This premium can be difficult to quantify but often leads to sharp, albeit sometimes short-lived, price increases. The Brent crude market has also reacted, briefly touching $90 per barrel according to recent news. This suggests a broader market sensitivity to Middle Eastern instability. While the current WTI price is $79.59, any further escalation could push it towards the key resistance levels discussed earlier. Conversely, diplomatic de-escalation or reassurances of stable supply routes could quickly erode this risk premium, leading to a sharp price correction. The market is thus in a delicate balancing act, pricing in potential future supply issues while awaiting concrete developments.
Economic Calendar Watchlist: Key Data Points
Looking ahead, several economic data releases could significantly impact WTI's price trajectory. The U.S. Consumer Price Index (CPI) and Producer Price Index (PPI) are crucial for gauging inflation trends, which directly influence oil demand and central bank policy. Upcoming employment data, such as Non-Farm Payrolls (NFP), will provide insights into the health of the U.S. economy and its capacity to consume energy. Additionally, any statements or decisions from OPEC+ regarding production levels will be closely monitored. Recent news also highlighted Canada's CPI rising 2.8% year-on-year, indicating persistent inflation in major economies, which could support oil prices if demand remains robust. The market's reaction to these figures will be critical in determining whether WTI consolidates near $79.59 or makes a decisive move towards higher resistance or lower support levels. The current neutral stance of the DXY on the daily chart (50% strength) suggests that these economic releases will play an even more significant role in dictating currency strength and, consequently, commodity prices.
Scenario Analysis: Charting Potential Paths for WTI
Given the current confluence of technical signals and geopolitical uncertainty, WTI crude oil is poised at a critical juncture. The market is grappling with conflicting indicators and a need for clearer direction. Below, we outline three potential scenarios, each with its own triggers, invalidation points, and price targets, based on the provided market data.
Bearish Scenario: Downside Risk Dominates
65% ProbabilityBullish Scenario: Geopolitical Premium Fuels Rally
25% ProbabilityNeutral Scenario: Range-Bound Waiting Game
10% ProbabilityWhat I'm Watching This Week
The coming week is pivotal for WTI. My focus will be on three key areas. First, the geopolitical developments between the U.S. and Iran – any concrete news of de-escalation or further escalation will be a major price driver. Second, I'll be closely monitoring the $79.23 support level on the 1-hour chart. A failure to hold this level, especially on increasing volume, would validate the bearish scenario. Third, I'm watching the DXY's ability to maintain its strength above 100.50. A weakening dollar could provide a tailwind for WTI, even amidst geopolitical uncertainty. The interplay of these factors will likely determine whether WTI can sustain its current position or is headed for further declines.
Frequently Asked Questions: WTI Analysis
What happens if WTI breaks below the $79.23 support level?
If WTI closes below $79.23 on the 1-hour chart, the bearish scenario becomes more probable. This could trigger a move towards the next support levels at $78.97 and potentially $78.63, as negative momentum builds and sellers gain control.
Should I buy WTI at current levels near $79.59 given the mixed signals?
Buying at $79.59 is speculative given the mixed signals and weak trend strength. A more prudent approach would be to wait for a confirmed breakout above $80.43 resistance or a clear test and hold of support around $79.23, with confirmation from RSI and MACD indicators.
Is the RSI at 46.91 a sell signal for WTI right now?
An RSI of 46.91 on the 1H chart is in the neutral zone and indicates slightly bearish momentum, not an outright sell signal. It suggests sellers have a slight edge, but it doesn't confirm a strong downtrend. Confirmation would require further price weakness and a move below key support levels.
How will escalating U.S.-Iran tensions affect WTI this week?
Escalating tensions typically add a geopolitical risk premium to oil prices, potentially pushing WTI higher towards resistance levels like $80.43 or even $81.29. However, this effect is highly dependent on the severity and duration of the conflict, and any signs of de-escalation could rapidly erase these gains.
| Indicator | Value | Signal | Interpretation |
|---|---|---|---|
| RSI (14) | 46.91 | Neutral | Slightly bearish momentum, room to fall. |
| MACD Histogram | -0.15 | Bearish | Negative momentum, below signal line. |
| Stochastic | K=28.74, D=52.74 | Bearish | %K |
| ADX | 10.18 | Weak Trend | Lack of strong trend; consolidation likely. |
| Bollinger Bands | Middle Band | Below | Price below middle band indicates bearish pressure. |
Track markets in real-time
AI-powered analysis, technical indicators and real-time price data.
Join Our Telegram Channel
Breaking market news, AI analysis and trading signals instantly.
Join Channel