

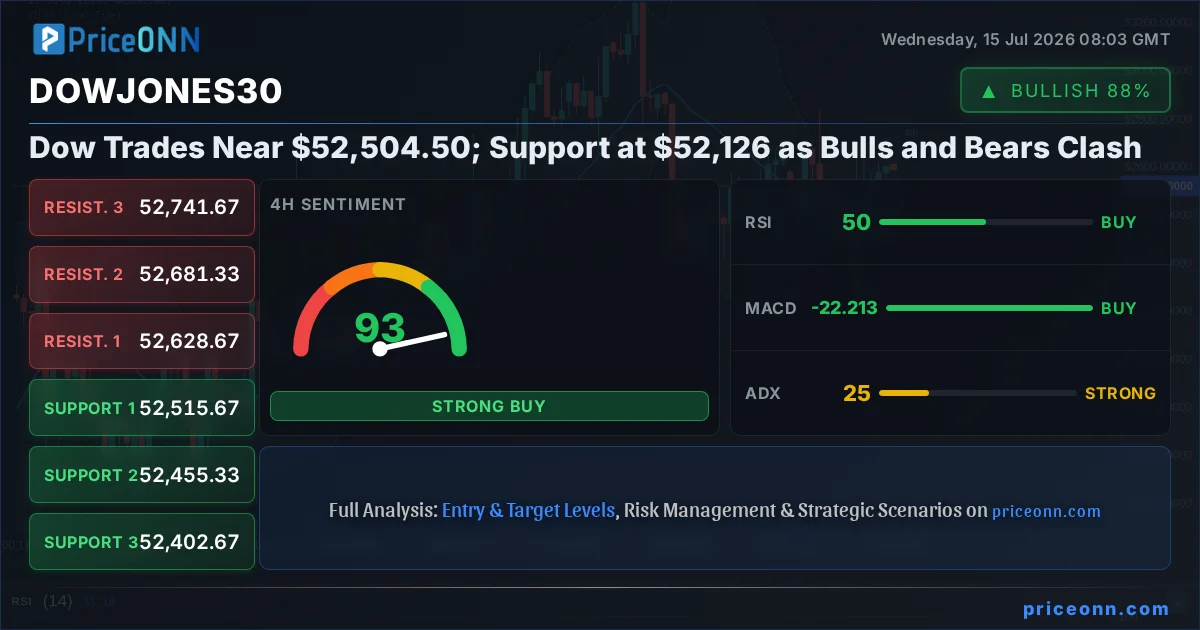
The Dow Jones Industrial Average is currently locked in a fierce battle near the $52,504.50 mark, a critical juncture where bulls and bears are visibly wrestling for control. This indecision reflects broader market anxieties, with investors keenly watching for clues to break the stalemate. Is this a pause before a renewed ascent, or a prelude to a significant pullback? The technical indicators and macroeconomic undercurrents offer conflicting signals, making it imperative to dissect the current landscape with precision. Understanding the interplay between the Dow's price action and global market dynamics, from the dollar's strength to oil price volatility, is key to navigating this complex environment.
- The DowJones30 is trading at $52,504.50, with bulls and bears locked in a critical battle.
- Key support for the DowJones30 is identified at $52,126.67, a level that has held significant weight historically.
- The ADX reading of 25.22 on the 4-hour chart suggests a strong trend is building, but its direction remains uncertain.
- Correlation analysis shows the DXY at 100.91, currently exerting downward pressure on risk assets, while oil prices are rising, fueling inflation concerns.
The DowJones30 today analysis reveals a market at a crossroads. After a period of upward momentum, the index has stalled, creating a volatile trading range that demands careful observation. The $52,504.50 level is not just a number; it represents a psychological and technical pivot point. On the 1-hour chart, the ADX, a measure of trend strength, shows a reading of 10.22, indicating a weak trend, almost a consolidation. However, delve deeper into the 4-hour timeframe, and the ADX jumps to 25.22, signaling a stronger trend is forming. This divergence across timeframes underscores the current market tension. Traders are trying to decipher whether the recent upward push was a genuine breakout or a bull trap designed to lure unsuspecting buyers before a sharp reversal. The lack of clear direction is amplified by mixed signals from other major indices like the S&P 500 and Nasdaq, which are also exhibiting signs of topping out or consolidating after significant rallies.
The bullish case hinges on several factors, primarily the underlying strength suggested by the 1D ADX at 27.29, indicating a robust upward trend despite the current consolidation. Furthermore, the 4-hour Stochastic (%K: 67.93, %D: 42.81) shows a bullish crossover, suggesting potential for upward momentum. If the bulls can defend the crucial support at $52,126.67, we might see a retest of the recent highs and potentially push towards the next resistance level at $52,681.33. This scenario is supported by the general upward trend in other indices like the Nasdaq 100, which, despite some overbought conditions on its 1-hour chart, maintains a strong upward trend on the 4-hour and 1-day timeframes. The narrative supporting the bulls often includes the expectation of continued economic resilience, steady corporate earnings, and potentially accommodative central bank policies later in the year, even if the immediate outlook is mixed.
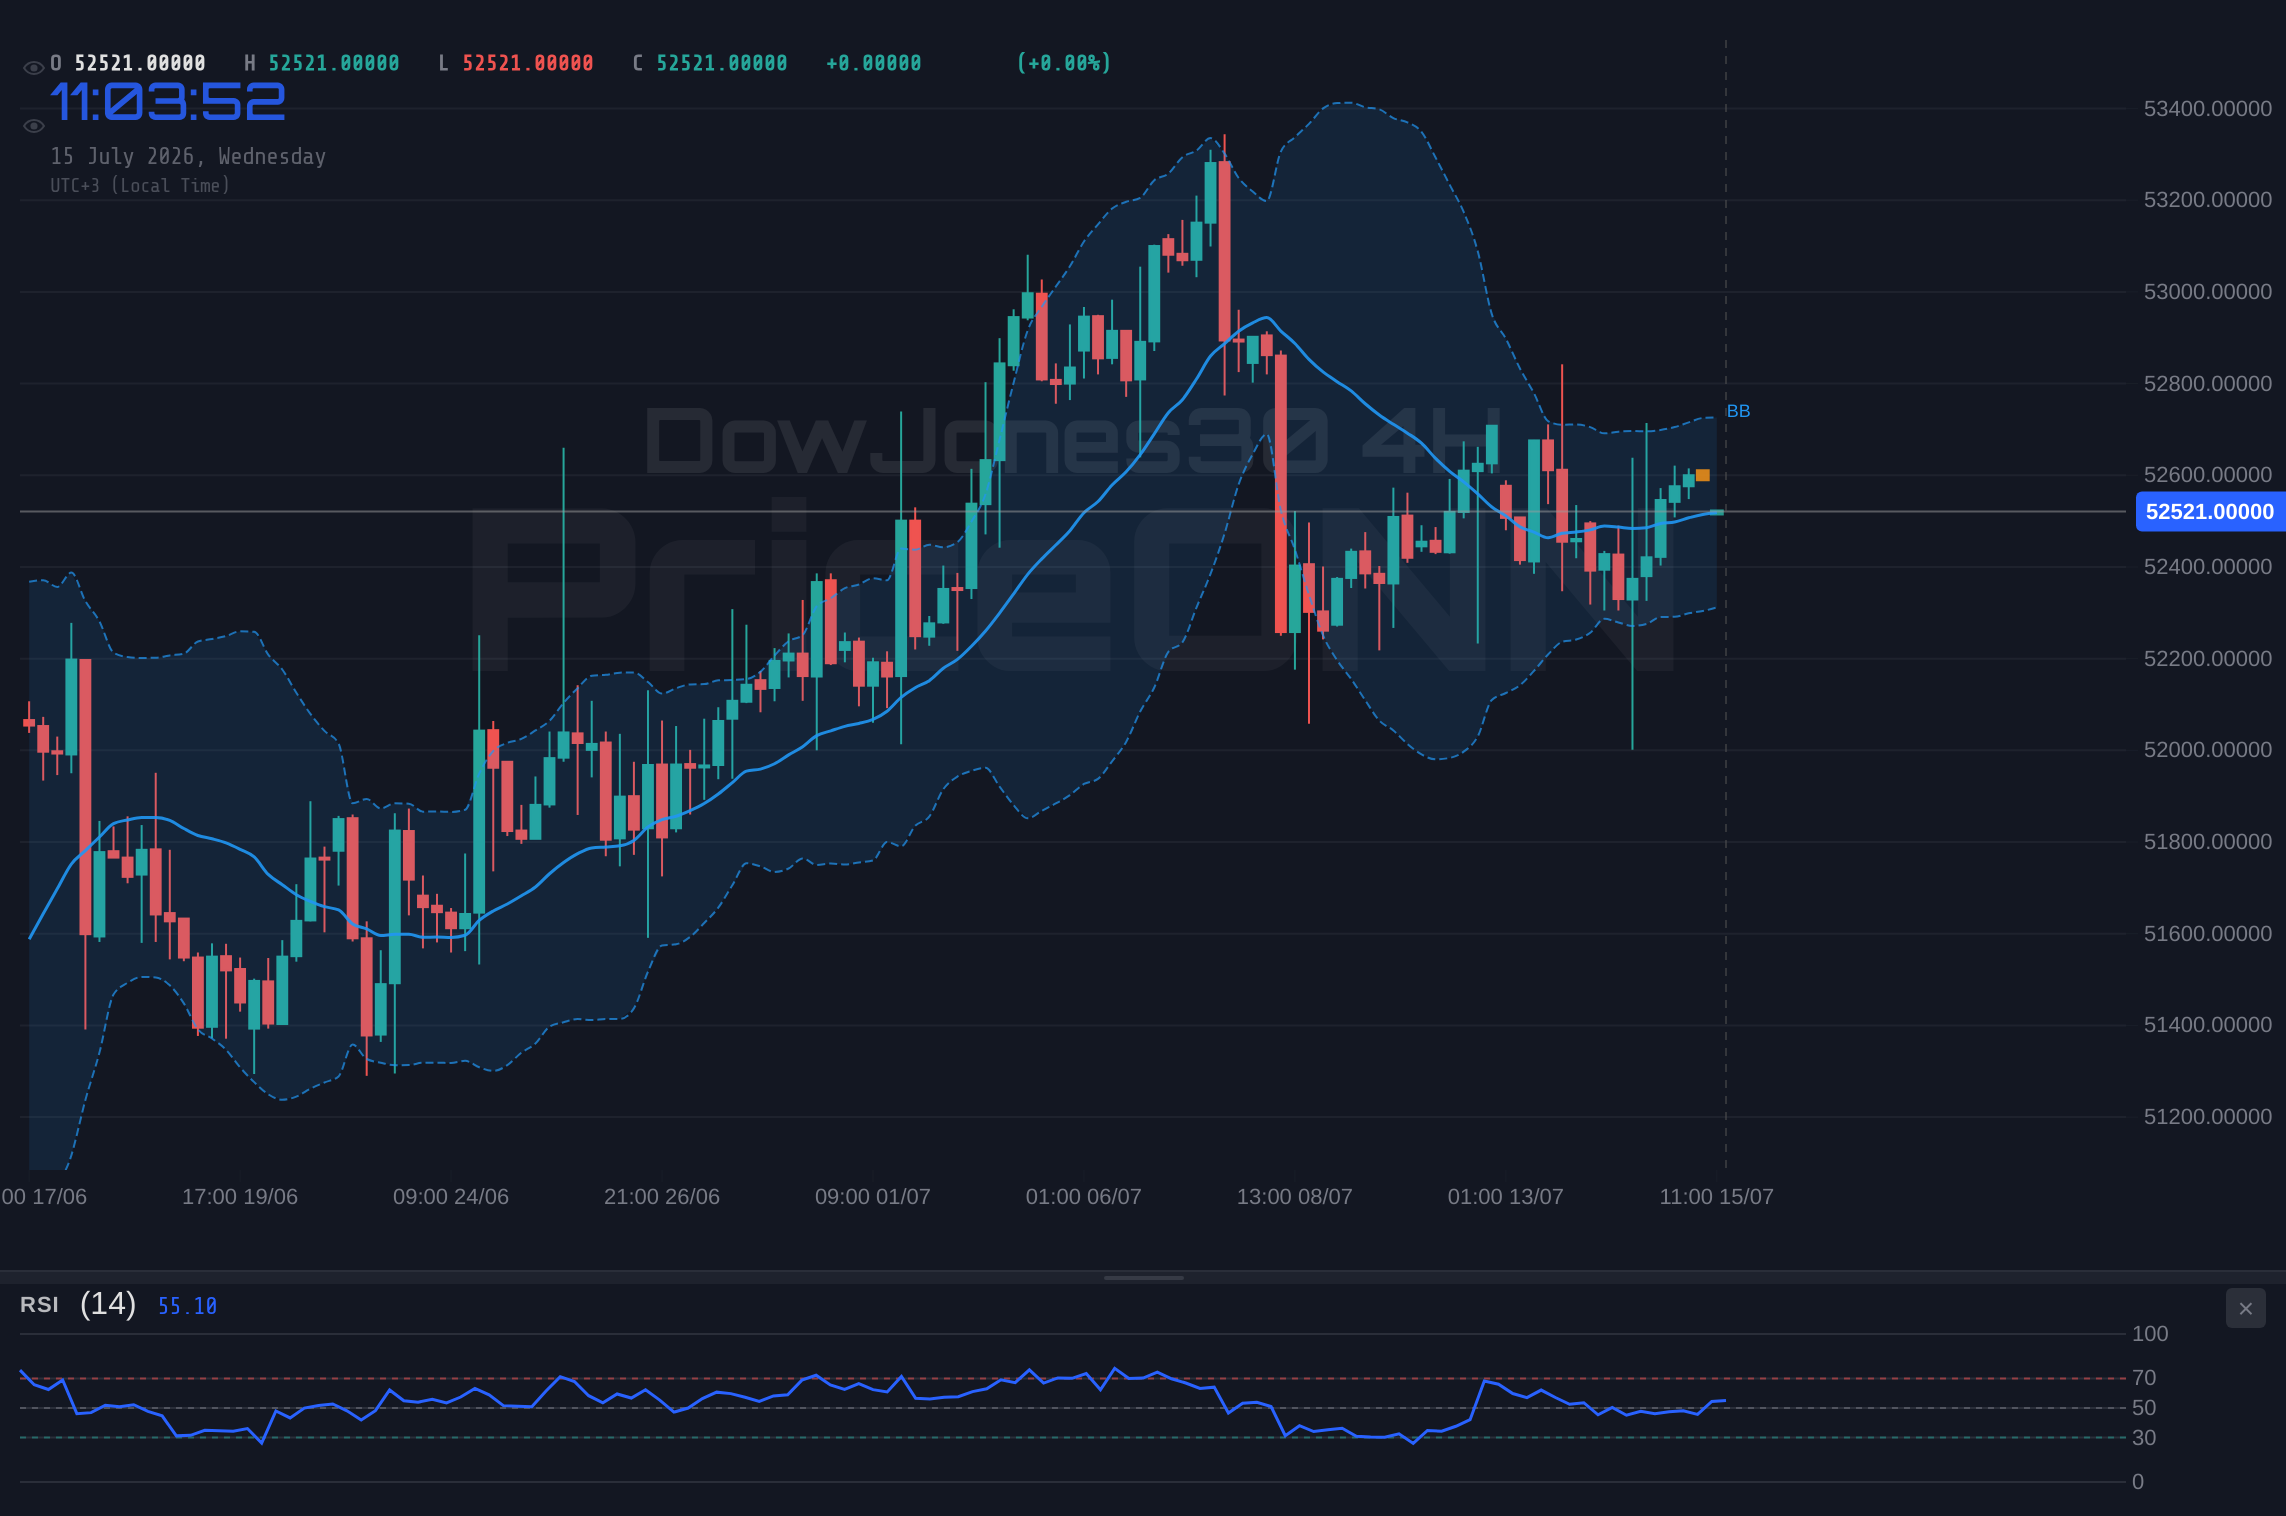
However, the bearish argument is gaining traction, fueled by rising inflation concerns and a strengthening US Dollar. The DXY is currently trading at 100.91, a level that typically exerts downward pressure on risk assets like the Dow Jones. The rising oil prices, with Brent at $85 and WTI at $80.64, add to these inflation fears, potentially forcing central banks to maintain a hawkish stance for longer than anticipated. On the technical front, the 1-hour RSI for the Dow Jones is at 49.24, indicating a slight bearish tilt, and the MACD histogram is negative, below the signal line, suggesting bearish momentum. The 1-hour Stochastic shows a bearish crossover (%K: 45.7, %D: 73.51), reinforcing the idea of short-term weakness. Moreover, the S&P 500, while showing a strong 1-hour trend, has an RSI of 70.95, bordering on overbought territory, and its 1-day trend is clearly bearish. This suggests that the broader market sentiment might be shifting, and a risk-off move could drag the Dow Jones down to its next support level at $51,707.33.
The current market environment presents significant risks. The conflicting signals from technical indicators and the uncertainty surrounding inflation data mean that sharp reversals are possible. Traders should exercise caution and implement strict risk management strategies, especially given the ADX readings suggesting a trend is building, which could accelerate moves in either direction. The upcoming economic calendar, particularly any inflation-related data, could be a major catalyst.
Delving deeper into the DowJones30's price action, the 1D trend is still categorized as 'Uplifting (Strength: 89%)', which is a strong bullish signal on the daily timeframe. This suggests that despite the current indecision, the larger trend remains intact. The support level at $52,126.67 is particularly important. It has been tested multiple times and held, forming a base for potential upward moves. If this level breaks convincingly, however, the narrative shifts dramatically. The bears would likely target the next significant support at $51,707.33, and potentially even lower towards $51,413.67. The strength of this potential downtrend would be amplified if accompanied by a weakening DXY and a surge in safe-haven assets, though currently, the DXY is strong and oil is rising, which complicates the typical safe-haven narrative.
The correlation with other markets is a crucial piece of the puzzle. The rising DXY at 100.91 is a headwind for global equities, including the Dow. Historically, a stronger dollar often correlates with lower commodity prices and can signal tighter global liquidity, which is generally bearish for stock markets. However, the current scenario sees both the dollar and oil prices rising, a less common but potent combination that points towards inflationary pressures and potential central bank tightening. This dynamic creates a challenging environment for risk assets. The S&P 500's bearish 1-day trend and Nasdaq's mixed signals further add to the cautionary outlook. If the correlation between rising oil prices, a strong dollar, and fears of persistent inflation continues, it could lead to a broader risk-off sentiment, impacting the Dow Jones significantly.
Bearish Scenario: Inflation Fears Grip Markets
65% ProbabilityNeutral Scenario: Range-Bound Consolidation
25% ProbabilityBullish Scenario: Economic Resilience Shines Through
10% ProbabilityTechnically, the Dow Jones 30 is at a critical inflection point. The 1-day chart shows a strong upward trend (ADX 27.29), but the 1-hour and 4-hour charts present a more mixed picture, with the 1-hour ADX at a weak 10.22 and the 4-hour ADX at a stronger 25.22. This suggests that while a trend might be forming, its conviction is still being tested. The RSI values across timeframes are also telling a story: 49.24 (1H), 49.73 (4H), and 57.51 (1D). The lower timeframes are leaning bearish, while the daily timeframe shows a more neutral-to-slightly-bullish sentiment. The Stochastic indicators are also conflicting: bearish crossovers on the 1-hour and 4-hour charts, but a bullish crossover on the 1-day chart. This confluence of conflicting signals - a strong daily trend but mixed short-to-medium term indicators - is precisely why the market is exhibiting such indecision around $52,504.50.
The recent breaking news provides context. The report about Bitcoin's potential downside risks and the Euro rising against a correcting US Dollar ahead of CPI data highlights the underlying volatility and sensitivity to inflation readings. The mention of tumbling fuel prices impacting US CPI data suggests that inflation might be cooling, which could be a bullish signal for equities if it leads to a less hawkish Fed. However, the simultaneous surge in oil prices and the strengthening DXY complicates this interpretation. The analyst favorite status of Rio Tinto (RIO) suggests strength in the materials sector, which can sometimes correlate with industrial indices like the Dow Jones, but this is not a direct driver for the index itself. The narrative around oil depending on China rather than the Middle East indicates a shift in geopolitical supply dynamics, potentially easing some immediate supply shock fears but introducing new demand-side uncertainties.
Given the current technical and fundamental crosscurrents, the most probable scenario leans towards continued choppiness, with the potential for a bearish move if key support falters. The 65% probability assigned to the bearish scenario reflects the weight of rising inflation concerns, a strong dollar, and conflicting short-term technical signals. The neutral scenario at 25% acknowledges the possibility of the index remaining range-bound as traders await clearer direction from upcoming economic data. The bullish scenario, with only a 10% probability, is contingent on a decisive breakout above resistance levels and a more dovish-than-expected inflation report, which seems less likely given current oil price action.
| Indicator | Value | Signal | Interpretation |
|---|---|---|---|
| RSI (14) | 49.24 | Bearish | Nearing oversold territory on shorter timeframes, suggesting potential for a bounce or continued weakness. |
| MACD Histogram | -20.5 | Bearish | Negative momentum indicates selling pressure is dominant in the short term. |
| Stochastic | K:45.7, D:73.51 | Bearish | Bearish crossover below the signal line suggests further downside potential. |
| ADX | 25.22 | Bullish | Indicates a strong trend is forming on the 4H chart, but direction is uncertain. |
| Bollinger | Middle Band | Watch | Price is trading below the middle band on 1H, suggesting downward pressure. |
Frequently Asked Questions: DowJones30 Analysis
What happens if the DowJones30 breaks below the $52,126.67 support level?
A break below $52,126.67 would invalidate the current bullish outlook and likely trigger a sell-off. The next significant support levels to watch would be $51,707.33 and then $51,413.67, as bears seize control. This scenario gains probability if inflation fears intensify or the DXY continues its upward trajectory.
Should I buy DowJones30 at current levels of $52,504.50 given the mixed signals?
Buying at current levels of $52,504.50 is risky due to conflicting technical signals and macroeconomic uncertainties. A more prudent approach would be to wait for confirmation: either a clear break above $52,681.33 resistance, or a confirmed hold of $52,126.67 support. A 65% probability favors a bearish move, so caution is advised.
Is the RSI at 49.24 on the 1-hour chart a sell signal for DowJones30?
An RSI of 49.24 on the 1-hour chart is not a definitive sell signal but indicates a slight bearish leaning and a lack of strong buying pressure. It suggests that the market is not yet overextended to the upside on this timeframe, but it also doesn't signal strong buying conviction. The daily RSI at 57.51 is more neutral, indicating that the broader trend is not yet oversold.
How will rising oil prices and a strong DXY affect the DowJones30 this week?
Rising oil prices at $85 (Brent) and a strong DXY at 100.91 typically create headwinds for the Dow Jones. This combination fuels inflation concerns, potentially leading to expectations of higher interest rates. This could dampen investor sentiment and increase the probability of a bearish scenario, pushing the Dow Jones towards its support levels if risk aversion grows.
Track markets in real-time
AI-powered analysis, technical indicators and real-time price data.
Join Our Telegram Channel
Breaking market news, AI analysis and trading signals instantly.
Join Channel