

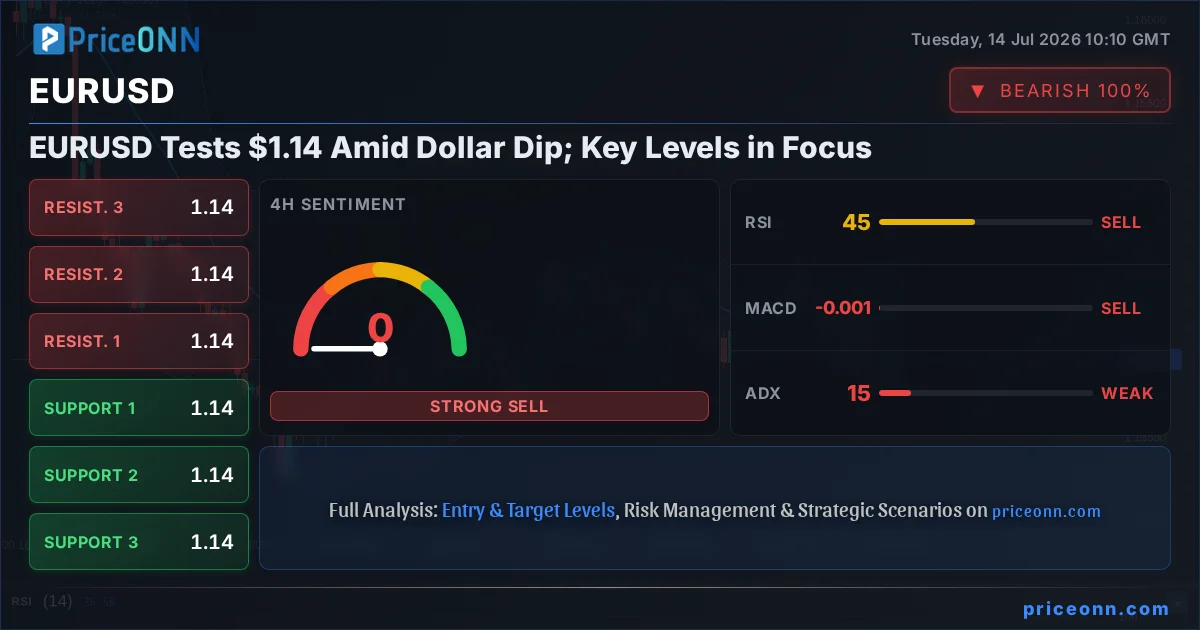
The Euro is nudging higher against the US Dollar, with EURUSD currently trading around the crucial $1.1400 handle. This uptick comes as the dollar shows signs of weakness, a move traders are scrutinizing closely ahead of key US inflation data. The question on everyone's mind is whether this dollar correction is a temporary pause or the start of a more significant trend reversal that could propel the Euro higher.
- EURUSD is trading near $1.1400 as the Dollar Index (DXY) retreats from recent highs.
- Key support for EURUSD is identified at $1.1384, with a break below potentially targeting $1.1372.
- Resistance looms at $1.1408, a break above could open the door for further gains towards $1.1423.
- The RSI(14) at 53.14 on the 1H chart suggests a neutral-to-slightly bullish bias, while the 4H RSI at 45.35 indicates room for further downside before oversold conditions appear.
Navigating the Dollar's Correction: What the DXY Data Reveals
The Dollar Index at a Crossroads: DXY's Retreat
The Dollar Index (DXY), a critical barometer for the greenback's strength against a basket of major currencies, is currently showing a retreat, trading around 101.11. This dip, while modest, is significant given the recent upward momentum the dollar has enjoyed. On the 1H chart, the DXY is showing a neutral trend with a power of 50%, supported by a weak ADX of 16.73, indicating a lack of strong directional conviction in the very short term. However, the 4H chart paints a slightly different picture, with a clear bullish trend (Power: 83%) and ADX at 15.89, suggesting underlying strength despite the current pullback. The daily chart presents a neutral stance with a strong ADX of 31.75, hinting at potential for renewed trending moves. This mixed signal from the DXY underscores the current uncertainty in the market, making the EURUSD's reaction particularly interesting.
The immediate support for the DXY is seen at 101.04, followed by 100.99 and 100.92. Resistance levels are noted at 101.17, 101.24, and 101.29. The RSI(14) on the 1H chart is at 48.81, pointing to a slight bearish lean, while the 4H RSI at 52.8 suggests a more neutral stance. The Stochastic Oscillator on the 1H shows a bearish signal (%K
Correlation Dynamics: How DXY Impacts EURUSD
The inverse relationship between the Dollar Index (DXY) and EURUSD is a well-established phenomenon in forex markets. When the DXY strengthens, it typically exerts downward pressure on EURUSD, and vice-versa. Currently, with the DXY hovering around 101.11 and showing signs of a short-term pullback, EURUSD has found some breathing room. The 1H chart analysis for DXY indicates a neutral trend, with support at 101.04 and resistance at 101.17. This suggests that the immediate pressure on EURUSD from dollar strength might be easing. However, the 4H bullish trend on the DXY, albeit with a weak ADX, means that any sustained dollar recovery could quickly cap gains for the Euro.
The key takeaway here is the delicate balance. If the DXY continues to decline, breaking below its 1H support levels, it would likely embolden Euro bulls. Conversely, a bounce from DXY support could see EURUSD reversing its gains. The daily ADX for DXY at 31.75 is a significant factor; a reading this high typically indicates a strong underlying trend, suggesting that the current pullback might be a consolidation phase within a larger bullish dollar trend. This makes the upcoming US CPI data crucial, as it could provide the catalyst for a decisive move in the DXY and, consequently, in EURUSD. Traders are closely watching to see if this dollar weakness is a precursor to further downside or merely a short-term correction before the trend resumes.
EURUSD Technical Landscape: A Tale of Two Timeframes
The 1-Hour Chart: A Glimmer of Euro Strength
Looking at the 1-hour chart for EURUSD, currently priced at $1.13997, we see a pair attempting to push higher. The trend is officially neutral with a power of 50%, but the immediate signals are leaning towards cautious optimism for the Euro. The RSI(14) is sitting at 53.14, comfortably in neutral territory and showing a slight upward inclination, suggesting there's still some room for the pair to climb without hitting immediate overbought conditions. The MACD is also providing a positive signal, with its histogram above the signal line, indicating positive momentum building in the short term. The Stochastic Oscillator, with K at 82.2 and D at 72.52, is in overbought territory, flashing a potential warning sign for immediate upside, showing %K
However, the Bollinger Bands present a more complex picture; they are located below the middle band, hinting at a potential downtrend or a significant break to the downside. This divergence between the RSI and MACD suggesting potential upside, and the Stochastic and Bollinger Bands indicating caution, highlights the chopiness in the very short term. The ADX at 17.06 confirms this, indicating a weak trend and a market that is largely range-bound. Despite the mixed signals, the overall composite signal leans towards 'BUY' (Al: 6, Sat: 2, Nötr: 0), implying that for intraday traders, the current momentum might favor short-term bullish plays, provided key resistance levels are cleared. The immediate support is at $1.13926, followed by $1.13863 and $1.13801. Resistance levels are closely watched at $1.14051, $1.14113, and $1.14176.
The 4-Hour Chart: Bears Still Hold the Reins
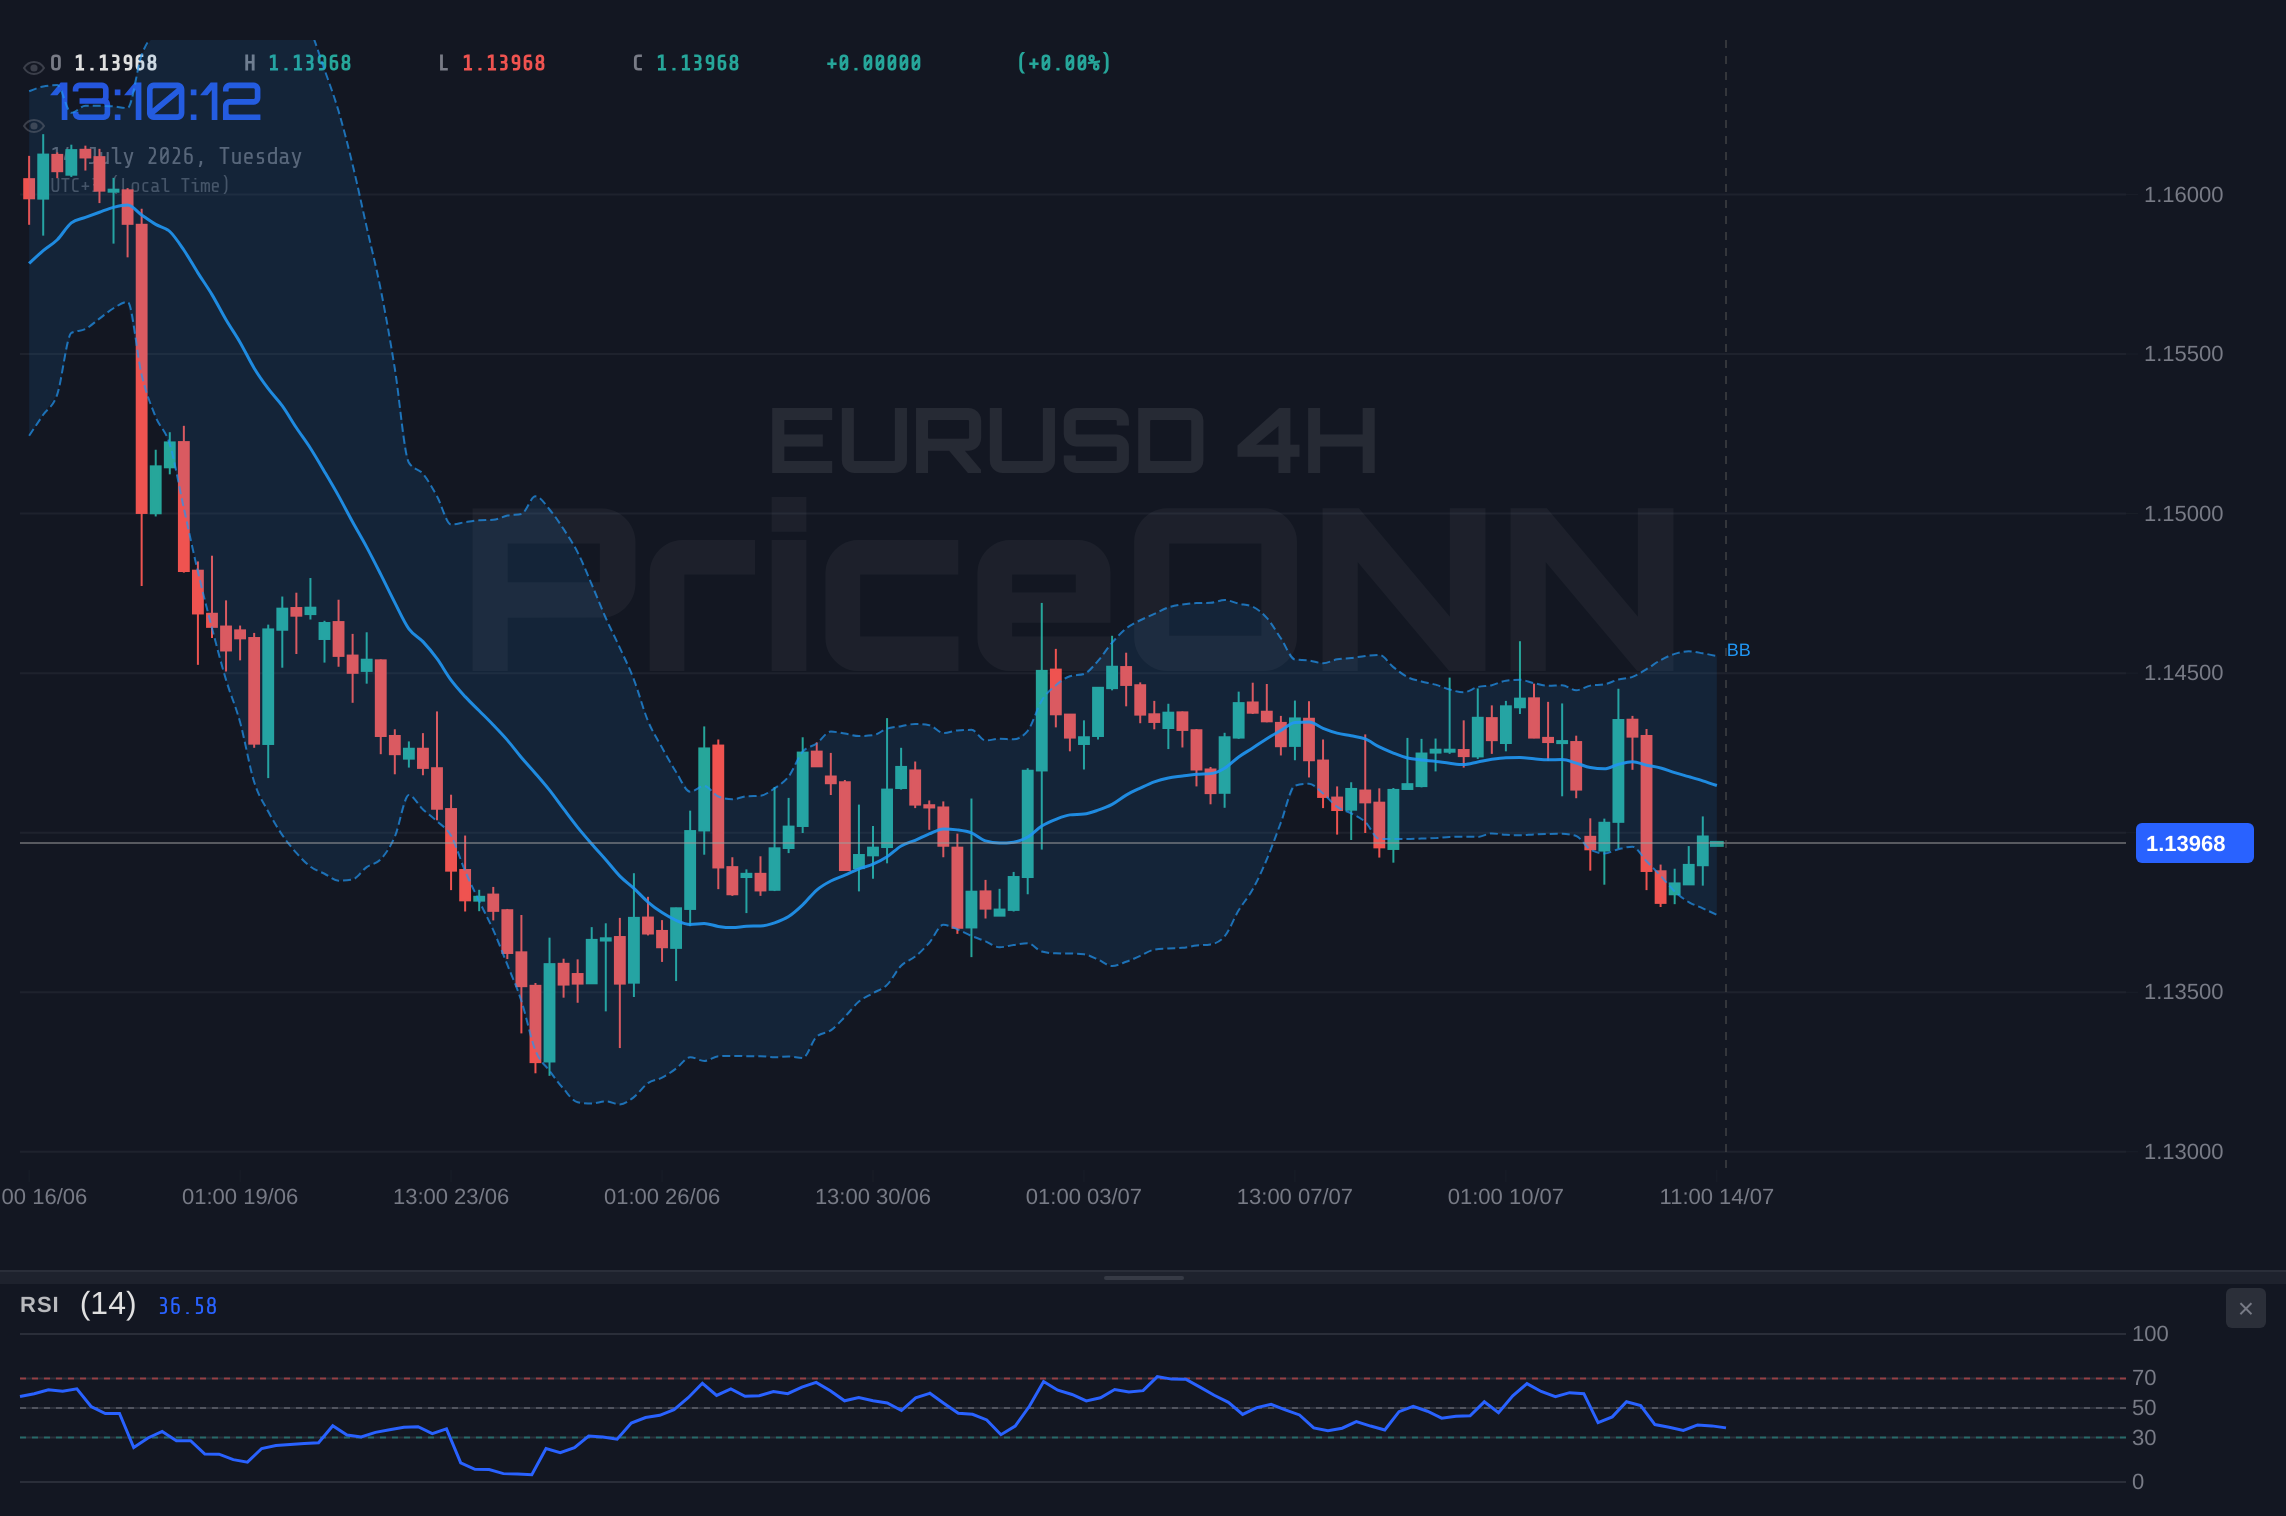
Shifting our focus to the 4-hour timeframe, the narrative for EURUSD takes a more bearish tone. Here, the trend is decidedly downwards, with a power of 83% and a strong ADX of 15.01, which, despite being a low number, indicates a persistent, albeit weak, downtrend. The RSI(14) is at 45.35, firmly in the neutral zone but with a downward slope, suggesting that there is still significant room for the price to fall before hitting oversold conditions. The MACD is also confirming the bearish sentiment, with its histogram below the signal line, indicating negative momentum. The Stochastic Oscillator, with K at 20.81 and D at 26.67, is in oversold territory and shows a bullish crossover (%K > %D), which could signal a potential bounce. However, the Bollinger Bands are positioned below the middle band, reinforcing the bearish inclination and suggesting that any upside movement might be limited.
The 'SELL' composite signal (Al: 0, Sat: 8, Nötr: 0) on this timeframe strongly suggests that the dominant trend is bearish. The immediate support levels to watch are $1.13839, $1.13778, and $1.13719. On the upside, resistance is capped at $1.13959, followed by $1.14018 and $1.14079. The conflict between the Stochastic's oversold bounce signal and the broader bearish indicators on the 4H chart highlights a key area of tension. While a short-term bounce from oversold levels is possible, the overall trend suggests that any rallies might be sold into. This makes the upcoming US CPI data particularly important; a hotter-than-expected inflation print could bolster the dollar and push EURUSD lower, validating the 4H bearish outlook.
The Daily Chart: A Neutral Stance with Lingering Downside Risks
On the daily chart, EURUSD presents a neutral trend with a power of 90%, but the underlying signals suggest a lingering downside risk. The current price of $1.13997 is below the middle Bollinger Band, indicating a bearish bias in terms of price positioning relative to volatility. The RSI(14) stands at 41.18, firmly in neutral territory and showing a downward trajectory, leaving ample room for further decline before reaching oversold conditions. The MACD is exhibiting positive momentum, with the histogram above the signal line, which is a divergence from the bearish trend indicated by the price action and RSI. This conflicting signal is something to watch closely.
The Stochastic Oscillator, with K at 29.78 and D at 52.27, is showing a bearish signal (%K
Key Levels and Potential Price Action Scenarios
The current technical picture for EURUSD is one of conflicting signals across different timeframes. The 1-hour chart offers a hint of short-term bullishness, while the 4-hour and daily charts lean towards a bearish outlook. This divergence creates a zone of indecision, where price action will likely be dictated by key upcoming events, most notably the US CPI data. The immediate levels are critical in defining the next short-term move.
EURUSD Support and Resistance Levels
Navigating the Uncertainty: Trade Scenarios for EURUSD
Bearish Scenario: Dollar Strength Resumes
70% ProbabilityNeutral Scenario: Consolidation Around $1.14
20% ProbabilityBullish Scenario: Euro Gains Momentum
10% ProbabilityEconomic Calendar and Geopolitical Undercurrents
US CPI Data: The Inflationary Gauntlet
The most significant event on the horizon for EURUSD is undoubtedly the release of the US Consumer Price Index (CPI) data. Scheduled for Tuesday, this report is expected to show a cooling inflation trend, largely attributed to tumbling fuel prices. However, the market's reaction will hinge on whether the actual figures meet, exceed, or fall short of expectations. A hotter-than-expected CPI print would likely reignite inflation fears, potentially bolstering the US Dollar as it could imply a more hawkish stance from the Federal Reserve. Conversely, a softer reading might reinforce expectations of Fed rate cuts or a pause, weakening the dollar and providing a substantial boost to EURUSD.
The current market sentiment, as reflected in the DXY's slight pullback and EURUSD's attempt to move higher, suggests that traders might be positioning for a less aggressive inflation scenario. However, the underlying strength in oil prices, a key component of inflation, adds a layer of complexity. If oil prices continue to climb, they could offset the expected decline in fuel inflation, leading to a more stubbornly high CPI reading. This makes the upcoming data release a critical inflection point. The BLS will publish the June CPI data, and analysts will be dissecting not just the headline number but also the core inflation components, which exclude volatile food and energy prices, to gauge the underlying inflationary pressures. Any surprises here could lead to significant volatility across currency markets.
Geopolitical Ripples and Their Impact on the Euro
While the focus is heavily on US inflation, geopolitical developments continue to cast a shadow over global markets. The news regarding the US President's comments on the ceasefire in the Strait of Hormuz and the associated increase in crude oil prices introduces an element of risk aversion. Such geopolitical tensions often benefit safe-haven assets, which can include the US Dollar, potentially counteracting the bearish sentiment seen in the DXY. However, the current narrative seems to be more focused on Fed policy expectations than immediate geopolitical threats, at least for the time being.
The Euro's performance is also indirectly influenced by these global dynamics. A significant escalation in Middle East tensions could lead to a broader flight to safety, which might see EURUSD pressured downwards, despite any dollar weakness stemming from Fed policy expectations. Conversely, a de-escalation of geopolitical risks could further support risk appetite, potentially benefiting the Euro if coupled with a weaker dollar. The ongoing market narrative suggests that while geopolitical risks are always present, the immediate driver for EURUSD appears to be the interplay between US inflation data, Fed policy expectations, and the resulting dollar strength or weakness. The market's current reaction seems to prioritize the inflation data, but any sudden geopolitical flare-up could quickly shift the focus.
The Trader's Perspective: What to Watch Next
Interpreting the Divergent Signals: A Trader's Dilemma
For traders, the current EURUSD setup presents a classic dilemma: conflicting signals across different timeframes. The 1-hour chart suggests a potential short-term bounce, supported by positive MACD momentum and a slightly bullish RSI. However, the more dominant 4-hour and daily charts point towards underlying weakness, with bearish trends, lower RSI readings, and the price trading below key moving averages. This divergence means that short-term scalpers might look for quick entries on the 1-hour chart, aiming for the immediate resistance at $1.14051, while swing traders and position traders would likely be more cautious, waiting for confirmation from the higher timeframes or a decisive break of key support levels.
The ADX readings are particularly telling. On the 1H, it's at 17.06 (weak trend), on the 4H at 15.01 (weak trend), and on the Daily at 29.63 (strong downtrend). This suggests that while the overall daily trend might be considered bearish, the intraday and medium-term trends lack strong conviction, indicating a choppy market. The Stochastic Oscillator is also flashing mixed signals: overbought on the 1H, oversold with a bullish crossover on the 4H, and bearish on the Daily. This confluence of conflicting indicators means that relying solely on one indicator would be a risky strategy. Confirmation through price action, especially around the key support at $1.1384 and resistance at $1.1408, will be paramount.
The Importance of Price Action Around Key Levels
The $1.1400 level is more than just a psychological number; it represents a confluence of technical factors and a critical battleground between buyers and sellers. The immediate resistance on the 1H chart at $1.14051, R1, is the first hurdle. A decisive break and hold above this level, potentially fueled by weaker-than-expected US CPI data, could see EURUSD testing the next resistance at $1.14113 and potentially aiming for $1.14176. On the flip side, failure to break above $1.14051, especially if the DXY starts to recover, could lead to a sharp reversal. The support at $1.13926 (1H S1) is the first line of defense. A break below this could accelerate towards $1.13863 (1H S2) and the more critical $1.13801 (1H S3).
The 4-hour support at $1.13839 and the daily support at $1.13548 become increasingly relevant if the bearish sentiment prevails. The fact that the 4H Stochastic is showing a potential bounce from oversold conditions adds a layer of complexity. It suggests that while the bears are in control on the higher timeframe, there might be short-term counter-trend opportunities. However, these are often risky and require strict risk management. The upcoming US CPI data will likely be the catalyst that breaks this current indecision, providing a clearer direction for EURUSD in the short to medium term. Traders should be prepared for increased volatility around the data release.
Frequently Asked Questions: EURUSD Analysis
What happens if EURUSD breaks below the $1.13801 support level?
A decisive break below the 1-hour support at $1.13801 would invalidate any short-term bullish sentiment and likely trigger further selling pressure. The 4-hour chart suggests that the next significant support lies around $1.13719, with the daily chart pointing towards $1.13548 as a potential downside target. This scenario would be reinforced if the US Dollar shows renewed strength following the CPI data.
Is the current RSI reading of 53.14 on the 1H chart a buy signal for EURUSD?
An RSI of 53.14 on the 1-hour chart is considered neutral territory, leaning slightly bullish. It indicates that while there is some upward momentum, it is not yet in overbought territory, suggesting potential for further gains. However, it's crucial to consider this alongside other indicators; the 4-hour RSI at 45.35 suggests more room for downside before oversold conditions are met, implying that a buy signal based solely on the 1H RSI might be premature without further confirmation.
How will the US CPI data impact EURUSD around the $1.1400 level?
A hotter-than-expected US CPI reading could strengthen the US Dollar, pushing EURUSD below the $1.1400 level and potentially towards the $1.1380 support. Conversely, a cooler-than-expected CPI could weaken the dollar, allowing EURUSD to break above the $1.1405 resistance and target higher levels like $1.1423. The market's reaction will depend heavily on how these figures influence Federal Reserve policy expectations.
Should traders consider buying EURUSD at current levels near $1.14 given the mixed signals?
Buying EURUSD at current levels near $1.14 requires caution due to the conflicting signals between short-term bullish indicators and longer-term bearish trends. A high-probability entry would likely require a confirmed break above the 1H resistance at $1.14051, targeting $1.14113. Alternatively, waiting for a clear break below the 1H support at $1.13801, potentially targeting $1.13719, could offer a bearish entry. Patience and strict risk management are advised.
The market is a constant dance between fear and greed, inflation and deflation, policy tightening and easing. For EURUSD, the next few hours around the US CPI data release will be crucial in determining which dance steps dominate. Stay disciplined, manage your risk, and wait for the clear signals.
Track markets in real-time
AI-powered analysis, technical indicators and real-time price data.
Join Our Telegram Channel
Breaking market news, AI analysis and trading signals instantly.
Join Channel