

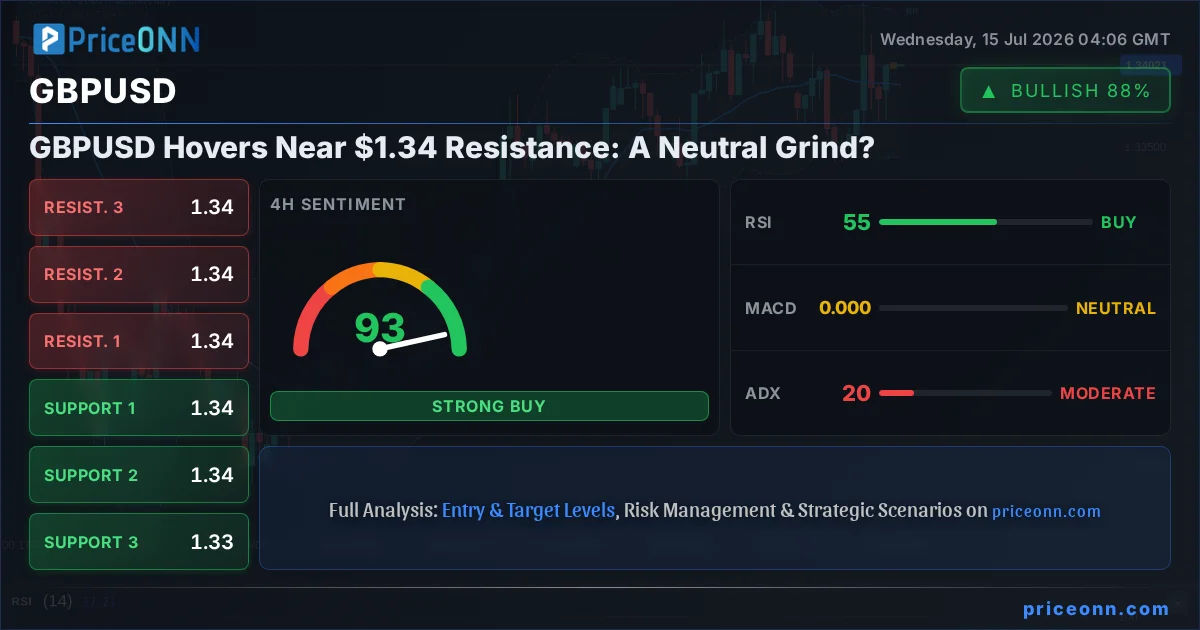
The GBPUSD pair is currently navigating a critical juncture, trading around the $1.34 mark. This price point represents a significant area of interest, not just as a psychological level, but also as a confluence of technical indicators suggesting a period of consolidation. With the daily chart showing a neutral trend despite a strong intraday push higher, the market appears to be in a holding pattern, awaiting a catalyst to break the current equilibrium. The interplay between the strong US dollar sentiment, indicated by the DXY at 100.82, and the Pound's resilience near $1.34 paints a complex picture for traders looking for clear directional signals. This analysis delves into the technical underpinnings, indicator readings, and market correlations to decipher the immediate path forward for GBPUSD.
- RSI at 59.78 on the 1H chart signals growing bullish momentum, but caution is advised as 1D RSI remains neutral at 56.45.
- Critical resistance is observed at $1.34087, with support holding firm around $1.33999 as per 1H data.
- The ADX at 23.89 on the 1H suggests a strengthening trend, but 1D ADX at 16.07 indicates overall market indecision.
- The British Pound's correlation with risk appetite is being tested as global equities show mixed signals, with S&P 500 rising but Nasdaq showing caution.
Currently, the GBPUSD pair is exhibiting a 'neutral grind' as it hovers near the $1.3400 handle. This price action is characterized by a lack of decisive momentum, despite intraday fluctuations. The 1-hour chart shows a bullish bias, with the price testing resistance levels just above $1.34087. However, the broader picture, particularly on the daily timeframe, suggests a more cautious outlook. The daily RSI at 56.45 indicates a neutral-to-slightly-bullish stance, not yet signaling overbought conditions but also not suggesting a strong upward trajectory. This divergence in signals across different timeframes is precisely what creates this 'neutral grind' environment, where short-term bullish moves are met with longer-term caution.
The strength of the US Dollar Index (DXY), currently trading at 100.82, plays a crucial role here. A stronger dollar typically exerts downward pressure on pairs like GBPUSD. Despite the DXY's slight dip of -0.09% today, its presence near the 100.80 mark suggests underlying dollar strength that could cap any significant rallies in GBPUSD. This inverse correlation is a fundamental aspect of forex trading, and observing the DXY's behavior is essential for understanding the forces acting upon the British Pound.
Navigating the Technical Landscape: Indicators in Focus
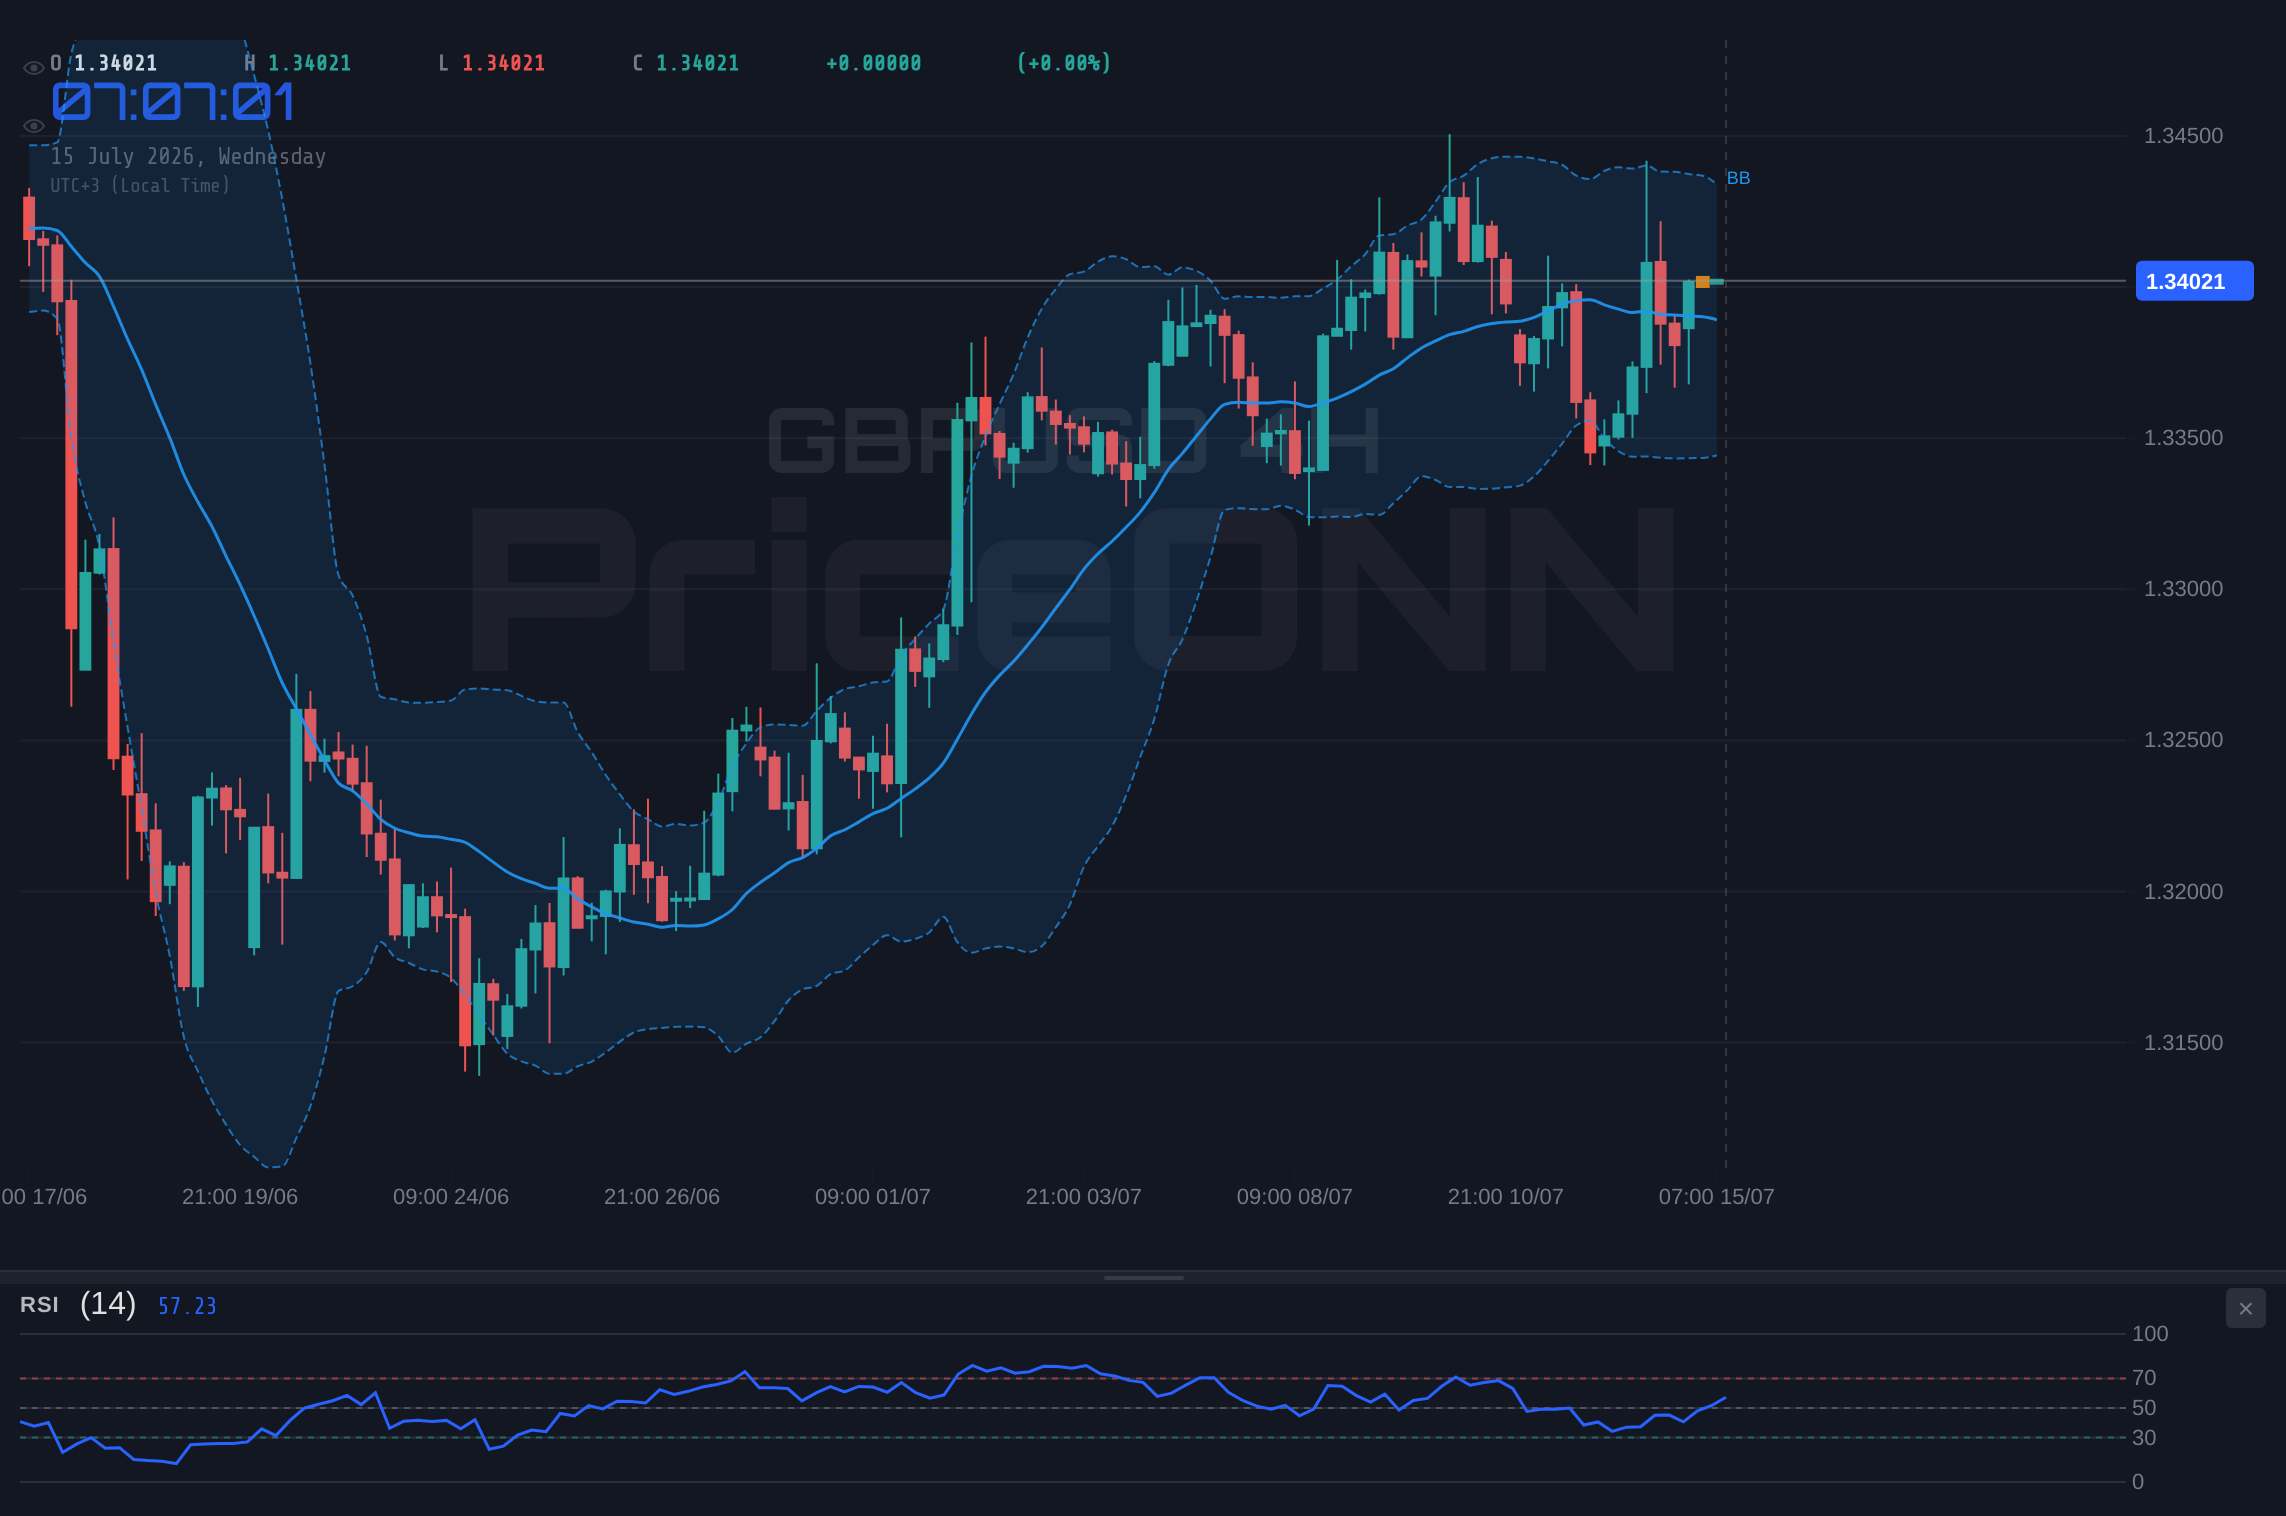
Delving deeper into the technical indicators, the 1-hour chart presents a somewhat mixed but leaning bullish signal. The RSI(14) at 59.78 suggests a healthy bullish momentum, indicating that buyers are active. Coupled with this, the Stochastic oscillator shows %K at 90.57 and %D at 68.41, firmly in overbought territory and signaling a potential pullback. This divergence between RSI and Stochastic on the 1-hour chart highlights the immediate tension: momentum is building, but the market is getting stretched in the short term. The MACD, while showing positive momentum on the 1-hour, is balanced on the 4-hour, indicating that the upward force is not yet overwhelming.
The ADX indicator provides further insight into trend strength. On the 1-hour chart, the ADX stands at 23.89, suggesting a moderately strong uptrend is in play. This aligns with the bullish sentiment seen in other short-term indicators. However, the daily ADX reading of 16.07 paints a different story, indicating a weak overall trend and potential for sideways movement. This discrepancy is key: while intraday traders might find opportunities in the short-term trend, the longer-term picture suggests that any significant breakout needs more sustained market conviction. The Bollinger Bands on the 1-hour chart are pushing above the middle band, further supporting the bullish intraday bias, but the daily Bollinger Bands show the price is near the middle band, suggesting it could go either way.
The 4-hour timeframe offers a slightly more balanced perspective. The RSI at 55.33 remains in neutral territory, indicating no immediate overbought or oversold conditions. The MACD is showing positive momentum, and the Stochastic oscillator, with %K at 48.74 and %D at 39.9, is signaling a potential upward move, with %K crossing above %D. This suggests that the short-term bullishness might continue to play out. However, the ADX on the 4-hour chart at 20.28 points to a moderate uptrend, which is still considered weak in the grand scheme of things. This reinforces the idea of a 'neutral grind' – short-term strength, but lacking the conviction for a major trend continuation.
Key Levels and Price Action Dynamics
From a price action perspective, the $1.34087 level on the 1-hour chart is acting as immediate resistance. A sustained break and close above this mark would be a significant bullish signal, potentially opening the door for further upside. Conversely, support is found at $1.33999 on the 1-hour chart. A decisive move below this level could signal a shift in short-term sentiment, inviting sellers to test lower ground. On the daily chart, the key resistance level is more clearly defined at $1.34347, while significant support lies further down at $1.33339. These levels represent important battlegrounds where the bulls and bears will likely clash.
The market’s current indecision is also reflected in the broader risk appetite. While the S&P 500 is showing a healthy rise of 0.74% and the Nasdaq 100 is up 0.75%, suggesting risk-on sentiment, their daily trends are mixed. The S&P 500's daily chart shows a bearish trend, while the Nasdaq's daily chart is neutral. This mixed signal from the equity markets adds another layer of complexity, as GBPUSD often correlates with global risk sentiment. The recent news suggesting that softer US CPI data might dampen Fed rate hike expectations, as reported by some outlets, could be a factor supporting GBPUSD's current levels. If inflation continues to cool, it might reduce the pressure on the Fed to hike aggressively, potentially weakening the dollar and offering support to the Pound.
Trade Scenarios: Charting the Path Forward
Bearish Scenario: Rejection at Resistance
60% ProbabilityNeutral Scenario: Consolidation Near $1.34
25% ProbabilityBullish Scenario: Breakout Above Resistance
15% ProbabilityThe immediate path for GBPUSD appears tilted towards a bearish outcome in the short term, given the confluence of resistance levels and the potential for profit-taking after recent gains. The news regarding softer US CPI potentially dampening Fed rate hike expectations offers some support to GBPUSD, but the overall technical picture, especially across longer timeframes, suggests that the upside might be capped for now. The DXY's firm footing near 100.82 and the mixed signals from global equities further complicate the bullish case. Therefore, a retest of support levels around $1.33999 and potentially lower seems more probable than a decisive breakout above $1.34087 in the immediate future.
What Needs to Happen for a Clearer Setup?
For GBPUSD to establish a clearer directional bias, several conditions need to be met. On the bullish side, a daily close above the $1.34347 resistance level would be a strong signal. This would require overcoming not only the immediate 1-hour resistance at $1.34087 but also the daily resistance, suggesting a significant shift in market sentiment or a strong fundamental catalyst. Such a move would likely be accompanied by a weakening DXY and a clearer risk-on sentiment in global equities, particularly if upcoming economic data continues to point towards a less hawkish stance from the Federal Reserve.
Conversely, a bearish setup would be confirmed by a decisive break below the $1.33999 support on the 1-hour chart, followed by a daily close below the $1.33339 level. This would indicate that the short-term bullish momentum has completely reversed, and sellers are taking control. Such a move could be triggered by stronger-than-expected US economic data, renewed hawkish rhetoric from Fed officials, or a significant geopolitical event that boosts the safe-haven appeal of the US dollar. The ADX on the daily chart, currently at 16.07, would need to rise significantly to confirm a strong downtrend, suggesting the market is not yet fully committed to a bearish move.
The current situation is best described as a 'watch zone'. Traders should pay close attention to the $1.34087 resistance and the $1.33999 support on the 1-hour chart. A clear break and hold above resistance, or a decisive break and hold below support on the daily timeframe, would provide the necessary confirmation for a directional trade. Until then, expect choppy price action and potential whipsaws as the market digests mixed signals from various indicators and market drivers. The volatility analysis suggests that while the trend strength is moderate to weak across different timeframes, the confluence of key levels near $1.34 creates a potential for a significant move once the indecision resolves. This is where patience and disciplined risk management become paramount.
| Indicator | Value | Signal | Interpretation |
|---|---|---|---|
| RSI (14) - 1H | 59.78 | Neutral | Bullish momentum building, but not overbought. |
| RSI (14) - 4H | 55.33 | Neutral | Balanced momentum. |
| RSI (14) - 1D | 56.45 | Neutral | No strong trend signal yet. |
| MACD - 1H | Positive | Bullish | Momentum favors upside. |
| MACD - 4H | Balanced | Neutral | Momentum is leveling off. |
| MACD - 1D | Positive | Bullish | Momentum favors upside. |
| Stochastic (%K/%D) - 1H | 90.57/68.41 | Bearish | Overbought territory, potential pullback. |
| Stochastic (%K/%D) - 4H | 48.74/39.9 | Bullish | Potential upward move. |
| Stochastic (%K/%D) - 1D | 44/48.98 | Bearish | Slightly bearish signal. |
| ADX - 1H | 23.89 | Bullish | Moderately strong uptrend. |
| ADX - 4H | 20.28 | Neutral | Weak trend strength. |
| ADX - 1D | 16.07 | Bearish | Very weak trend, sideways expected. |
Frequently Asked Questions: GBPUSD Analysis
What happens if GBPUSD breaks above the $1.34087 resistance level on the 1-hour chart?
A sustained break above $1.34087, especially with increasing volume, would signal bullish momentum continuation. This could target the daily resistance at $1.34347 and potentially higher towards $1.34887 if the bullish sentiment solidifies.
Should traders buy GBPUSD at current levels of $1.34 given the mixed signals?
Entering a trade at current levels carries significant risk due to the neutral stance on daily charts and conflicting indicators. A more prudent approach would be to wait for a clear breakout above $1.34087 or a confirmed breakdown below $1.33999 on the 1-hour chart for a higher probability setup.
Is the RSI at 59.78 on the 1-hour chart a buy signal for GBPUSD?
An RSI of 59.78 indicates bullish momentum but is not yet in overbought territory. While it supports a short-term bullish bias, it needs to be considered alongside other indicators and longer-term trends. The daily RSI at 56.45 suggests this bullishness lacks broader confirmation.
How might softer US CPI data affect GBPUSD this week?
Softer US CPI data could indeed dampen expectations for aggressive Fed rate hikes, potentially weakening the US Dollar (DXY). This would typically offer support to GBPUSD, but the pair's immediate direction will also depend on the Bank of England's stance and the overall market risk sentiment.
The current neutral grind around $1.34 for GBPUSD presents a challenging environment for traders seeking immediate directional conviction. While short-term indicators hint at bullish potential, the longer-term charts and the broader economic context, including the DXY's position and mixed equity market signals, suggest caution is warranted. The key levels identified – $1.34087 resistance and $1.33999 support on the 1-hour chart – will be crucial in determining the next significant move. Patience and disciplined risk management are essential as the market awaits a clearer catalyst.
Track markets in real-time
AI-powered analysis, technical indicators and real-time price data.
Join Our Telegram Channel
Breaking market news, AI analysis and trading signals instantly.
Join Channel