

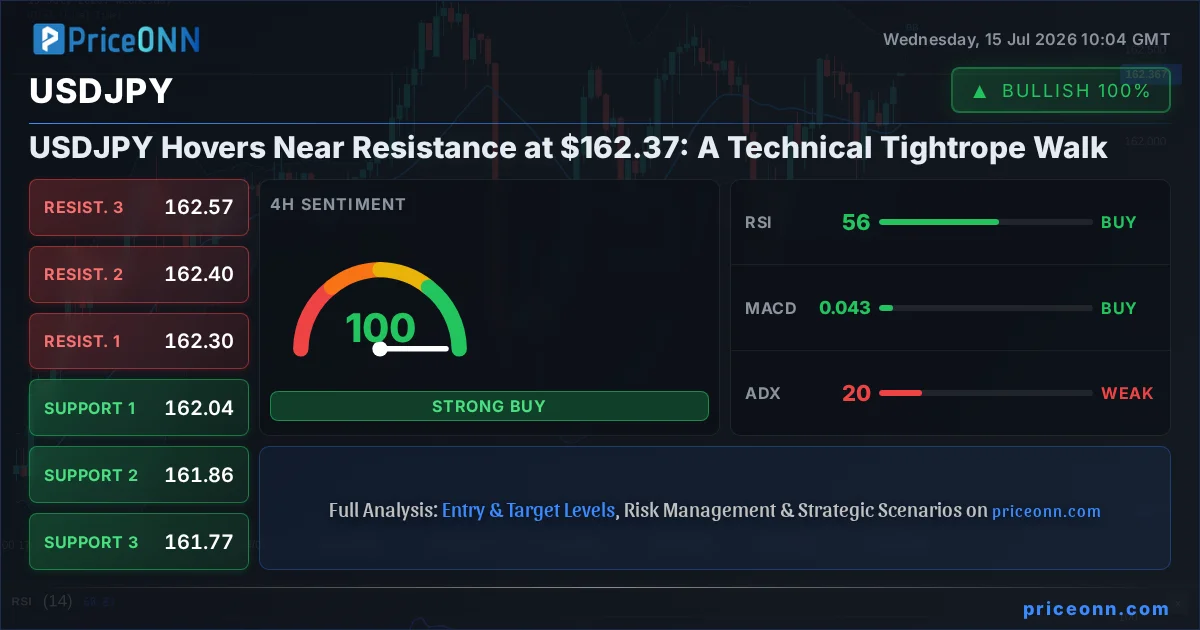
The relentless ascent of USDJPY has brought the pair to a critical juncture, hovering precariously near the $162.37 mark, a level that has historically acted as a significant psychological and technical barrier. This isn't just another trading day for USDJPY; it's a pivotal moment where the interplay of macro drivers and granular technical signals demands close attention. As traders digest recent economic data and anticipate the next move, the question on everyone's mind is whether this pair has the momentum to breach higher resistance levels or if it's poised for a sharp reversal. The current technical setup, characterized by a confluence of indicators pointing towards a potential consolidation or even a short-term pullback, suggests that the path of least resistance might be shifting. Understanding the nuances of the current price action, the influence of the strengthening Dollar Index (DXY), and the broader market sentiment is crucial for navigating the volatility that often accompanies such key junctures.
- USDJPY is trading at $162.37, approaching significant resistance at $162.593.
- The 1-Day ADX at 38.49 indicates a strong downtrend in gold (XAUUSD), while USDJPY shows a weaker trend (ADX 19.74 on 4H).
- RSI for USDJPY is hovering around 60.04 on the daily chart, suggesting a neutral-to-bullish leaning but not yet overbought.
- The Dollar Index (DXY) is showing strength around 100.99, typically pressuring pairs like USDJPY, yet the pair is holding firm.
The Macro Backdrop: A Stronger Dollar, A Cautious Yen
The narrative surrounding USDJPY cannot be fully understood without acknowledging the broader macroeconomic forces at play. The Dollar Index (DXY), a key barometer of the US dollar's strength against a basket of major currencies, currently sits at 100.99. This level, while not at its absolute peak, signifies a dollar that is generally finding its footing, supported by a relatively resilient US economy and the Federal Reserve's hawkish undertones. A stronger dollar typically exerts downward pressure on currency pairs like USDJPY, as it becomes more expensive for holders of other currencies to acquire dollars, and consequently, yen. However, the USDJPY pair has shown remarkable resilience, even exhibiting upward momentum in certain timeframes. This divergence warrants a closer look at the specific dynamics influencing the yen itself. Factors such as the Bank of Japan's (BoJ) ultra-accommodative monetary policy, which keeps Japanese interest rates significantly lower than those in the US, continue to fuel the carry trade, where investors borrow in low-interest-rate currencies (like JPY) to invest in higher-yield assets. This structural advantage for the dollar against the yen remains a powerful, albeit often underestimated, driver.
Furthermore, recent economic data releases have painted a mixed but generally positive picture for the US economy. While inflation data, such as the upcoming CPI report, is being closely watched for signs of cooling, the labor market has remained robust. This economic strength provides a solid foundation for the Federal Reserve to maintain its stance on monetary policy, potentially delaying or limiting the scope of interest rate cuts. In contrast, the Bank of Japan has given little indication of a significant shift away from its current easing cycle, creating a persistent interest rate differential that benefits the dollar. This backdrop sets the stage for USDJPY's current price action, where the pair is testing resistance levels despite the dollar's general strength, suggesting that other factors, perhaps technical in nature or related to market positioning, are playing a significant role.
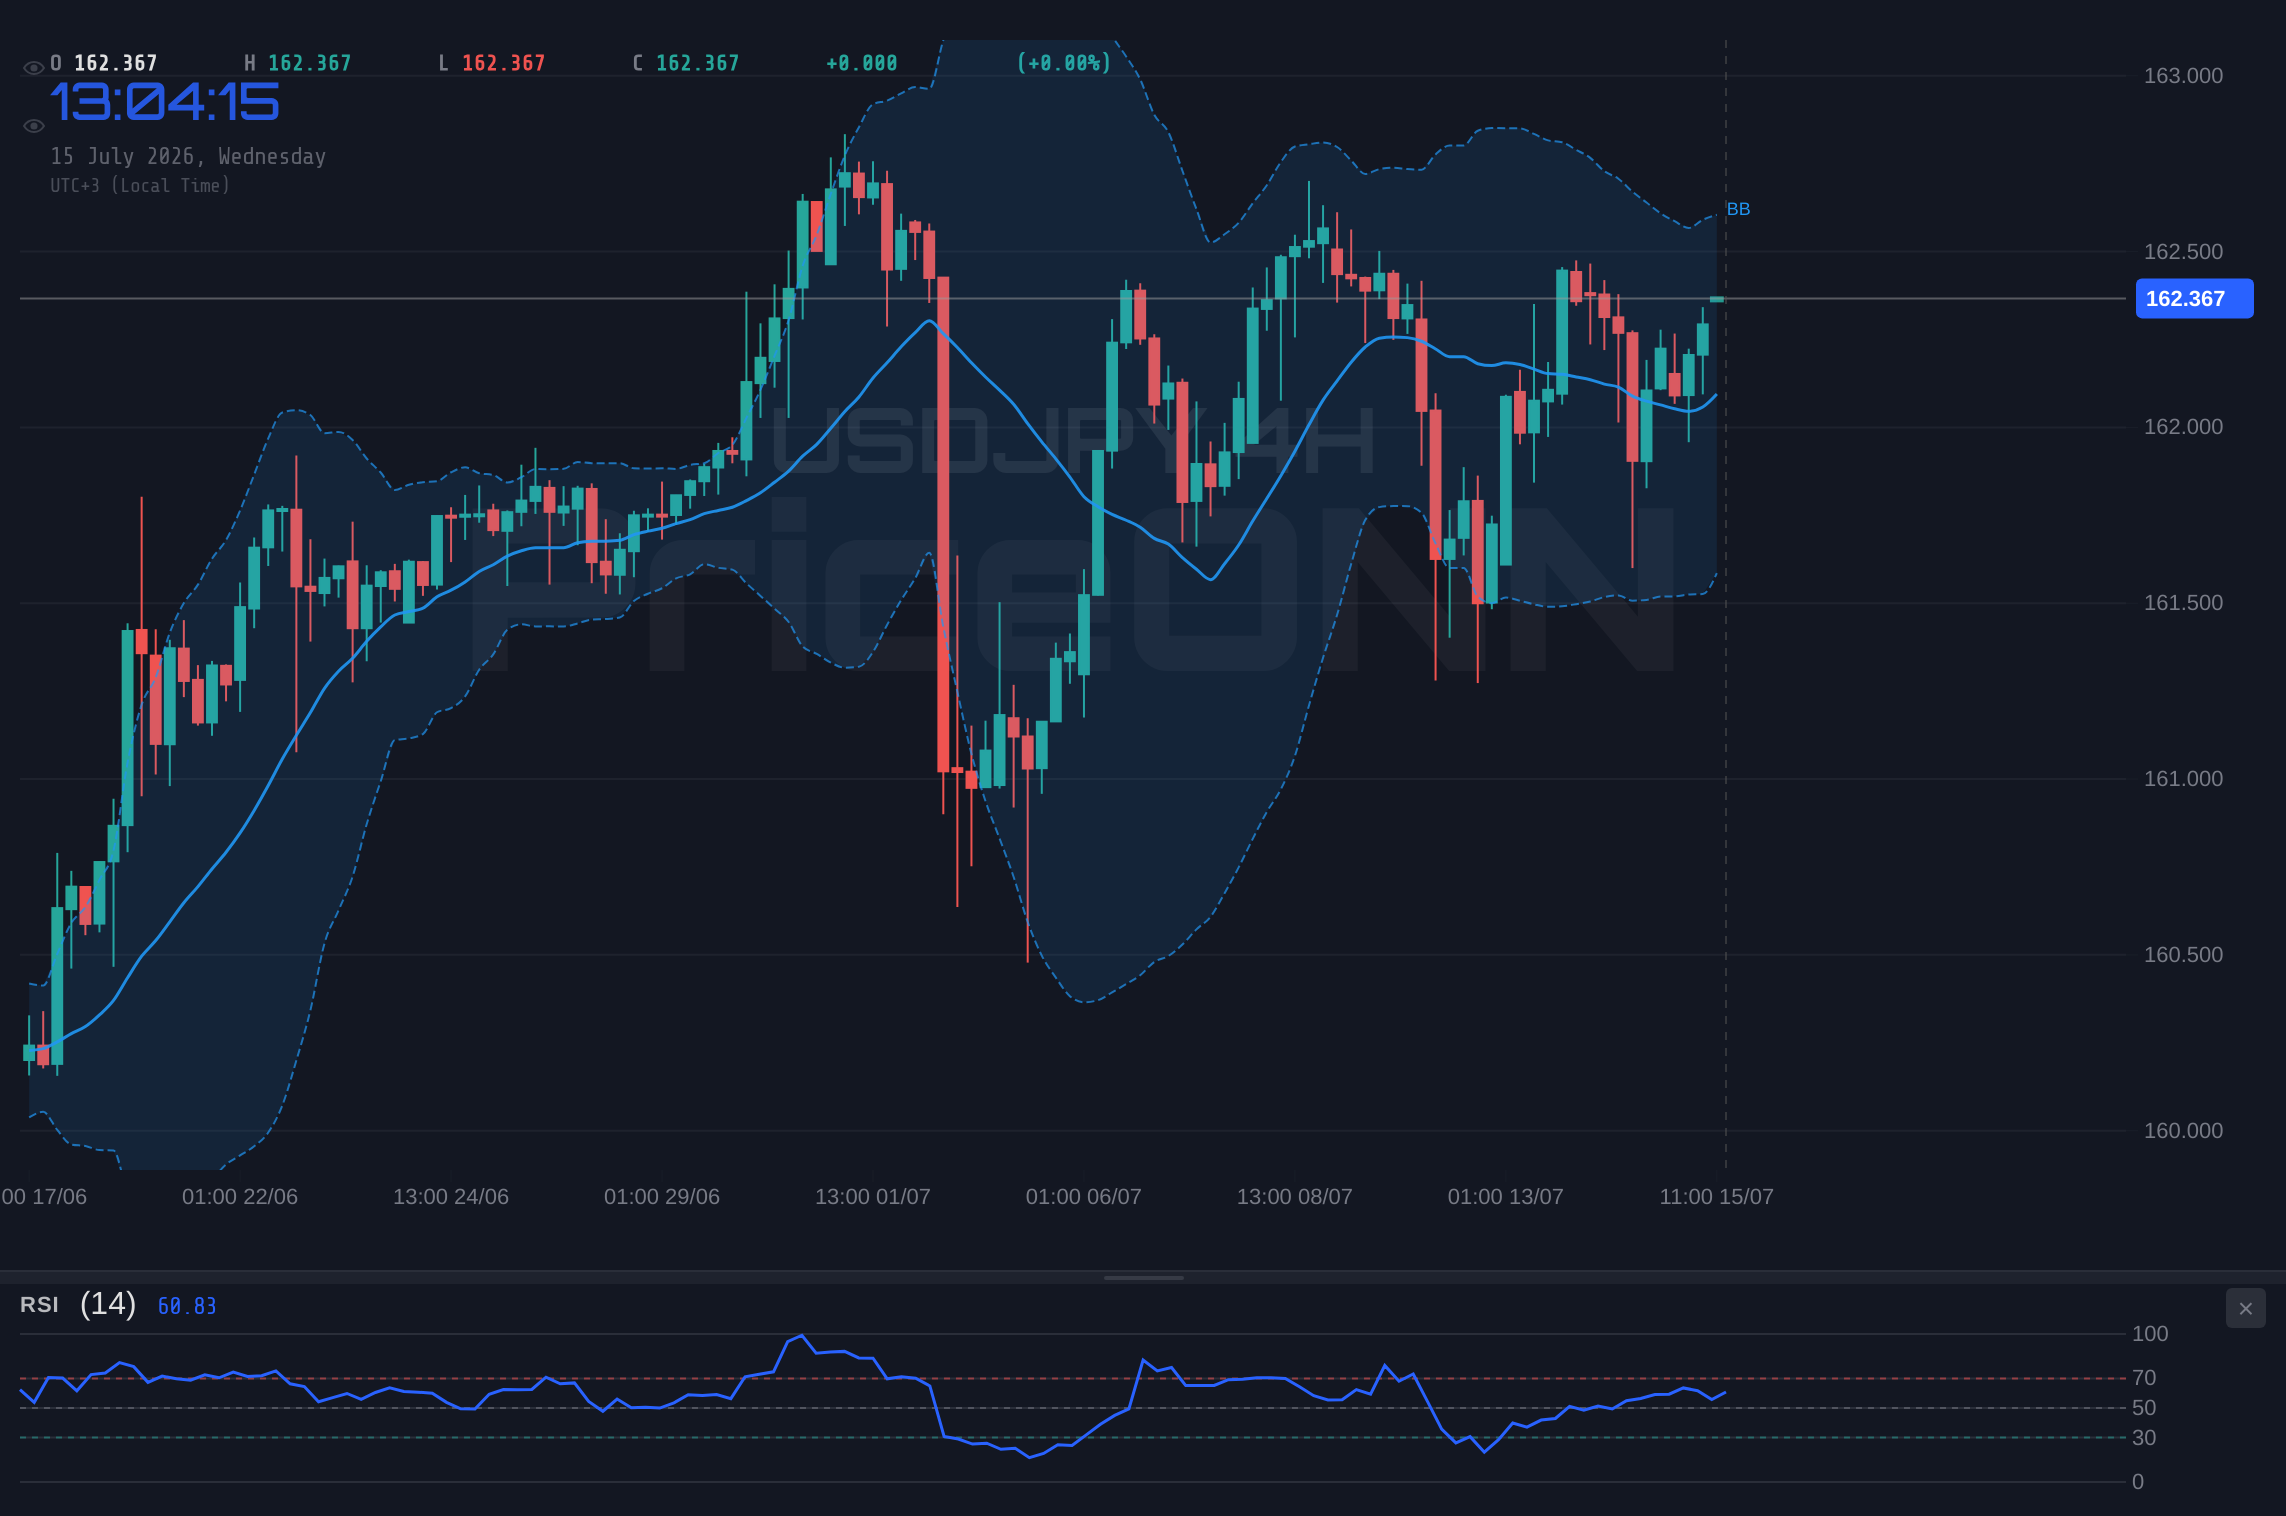
Navigating the Technical Landscape: A Multi-Timeframe Perspective
On the 1-hour chart, USDJPY is exhibiting a neutral trend with a power of 50%, currently trading near immediate resistance at $162.344. The Relative Strength Index (RSI) at 62.7 is in the neutral zone, leaning towards bullish, while the Stochastic oscillator signals a potential buy with %K above %D at 91.73 and 78.34 respectively. The MACD is showing positive momentum, with the histogram above the signal line. However, the Bollinger Bands are trading above the upper band, indicating a potential for overbought conditions or a breakout. The Average Directional Index (ADX) at 25.91 suggests a moderately strong trend. This short-term view presents a complex picture, with some indicators hinting at further upside while others suggest caution.
Shifting to the 4-hour timeframe, the trend remains neutral with 50% power. The price is finding immediate resistance at $162.301. Here, the RSI is at 55.89, still in neutral territory but showing a slight upward bias. The Stochastic oscillator also suggests a buy signal, with %K (71.37) above %D (62.41). The MACD is positive, and the Bollinger Bands are above the middle band, indicating an upward trend. The ADX at 19.88 points to a weaker trend, suggesting that the upward move might lack strong conviction. This timeframe offers a slightly more bullish leaning than the 1-hour, but the weak ADX reading is a significant caveat, implying that any upward move might be prone to quick reversals.
The daily timeframe provides a more definitive picture, with the trend currently assessed as neutral but with a strong 50% power. The immediate resistance level to watch is $162.593. The RSI at 60.04 remains in the neutral zone, indicating room for further appreciation before hitting overbought territory. The Stochastic oscillator (K=81.03, D=74.86) is in overbought territory and signals a potential buy, but this can persist in strong uptrends. The MACD is showing negative momentum, with the histogram below the signal line, which contradicts the Stochastic. The Bollinger Bands are above the middle band, supporting an upward inclination. Crucially, the ADX at 19.74 suggests a weak trend, which means that despite the price action, the market lacks a clear directional commitment. This overall technical picture across multiple timeframes suggests a market at a crossroads, with immediate resistance levels holding significant sway.
Correlation Analysis: DXY, Equities, and the USDJPY Puzzle
The relationship between USDJPY and the Dollar Index (DXY) is a cornerstone of forex analysis. Typically, a strengthening DXY, which measures the dollar against a basket of six major currencies, often correlates with a rising USDJPY. Currently, the DXY is trading around 100.99, indicating a dollar that is generally firm. This should, in theory, support USDJPY. However, the pair's current struggle near resistance suggests that other factors are at play, or that the correlation is momentarily breaking down. The strength of the yen itself, perhaps driven by safe-haven flows or specific Bank of Japan policy considerations, could be counteracting the dollar's broader strength. For instance, if global risk sentiment were to sour, the yen often acts as a safe-haven asset, appreciating against the dollar even as the dollar strengthens against other riskier currencies. So far, there's no clear indication of widespread risk aversion, but the tension is palpable.
The performance of major equity indices like the S&P 500 (SP500) and Nasdaq (Nasdaq100) also offers clues. The S&P 500 is currently trading at 6572.87, showing a daily gain of 0.74%, and the Nasdaq 100 is at 29721.45, up 0.44%. This indicates a generally positive risk appetite in the market. Typically, a risk-on environment, where equities are rising, might see investors move away from safe-haven assets like the yen, thus supporting USDJPY. However, the technical picture for USDJPY near resistance suggests that this risk-on sentiment might not be enough to propel the pair significantly higher without a clear technical breakout. The ADX readings across timeframes, particularly the weaker trend strength on the daily and 4-hour charts, imply that the market is not strongly committed to a direction, making it susceptible to shifts in sentiment or macroeconomic news. The interplay between these correlated assets - DXY, equities, and USDJPY - is complex and requires constant monitoring.
The Yen's Vulnerability: Interest Rate Differentials and BoJ Policy
At the heart of USDJPY's persistent strength lies the stark contrast in monetary policy between the US Federal Reserve and the Bank of Japan (BoJ). While the Fed has maintained a relatively hawkish stance, signaling a potential for higher-for-longer interest rates or a slower pace of cuts, the BoJ continues to pursue an exceptionally accommodative monetary policy. This significant interest rate differential is a primary driver for the carry trade, a strategy where investors borrow in a low-yielding currency (like the Japanese Yen) to fund investments in higher-yielding assets, often denominated in US dollars. The current interest rate environment means that holding long USDJPY positions, effectively shorting the yen against the dollar, can be highly profitable due to the interest earned on the dollar-denominated assets compared to the minimal borrowing cost of the yen.
This structural advantage for the dollar against the yen is unlikely to disappear in the short term. The BoJ has been cautious about tightening its policy too rapidly, fearing that premature moves could stifle economic recovery and destabilize markets. Recent statements from BoJ officials have reiterated their commitment to supporting the economy, providing little indication of an imminent shift towards higher interest rates. This policy divergence creates a fundamental tailwind for USDJPY, suggesting that even if the pair faces temporary headwinds or consolidations near resistance levels, the underlying pressure for it to move higher remains significant as long as the interest rate differential persists. Any substantial shift in BoJ policy would be a major catalyst, but for now, the status quo favors dollar strength against the yen.
Economic Calendar Watch: Inflation Data and Fed Speak
The upcoming economic calendar holds crucial data points that could significantly influence USDJPY's trajectory. The US Consumer Price Index (CPI) data, scheduled for release soon, is a key event. Analysts expect inflation to have cooled in June, partly due to tumbling fuel prices, as reported by the US Bureau of Labor Statistics (BLS). A softer-than-expected inflation reading could increase the likelihood of the Federal Reserve considering earlier or more aggressive interest rate cuts. Conversely, stubborn inflation would reinforce the Fed's higher-for-longer stance, potentially boosting the dollar and USDJPY. The market reaction to this data will be intense, with traders scrutinizing not just the headline numbers but also core inflation figures and underlying trends.
Beyond inflation, forward-looking statements from Federal Reserve officials will be closely monitored. Any hints regarding the future path of monetary policy, particularly concerning the timing and magnitude of potential interest rate adjustments, will be critical. If Fed officials maintain a hawkish tone, emphasizing the need to keep rates elevated to combat lingering inflation, this would likely support the dollar and USDJPY. The market's interpretation of Fed speak, often more impactful than actual data releases, will be a key determinant of short-term price movements. Traders will be looking for confirmation of the Fed's commitment to its current policy path, or any signs of a pivot, which could trigger significant volatility across all dollar pairs, including USDJPY.
Technical Scenarios: Charting the Path Forward
The current technical setup for USDJPY presents a fascinating interplay of signals, suggesting that the pair is at a critical decision point near the $162.593 resistance level. While the daily chart shows a neutral trend with a strong ADX (38.49) indicating a trend is present, its overall signal leans towards selling (1 Sell, 7 Buy, 0 Neutral). However, multiple timeframes show conflicting signals. The 1-hour chart offers a mixed bag, with a neutral trend, a bullish Stochastic, but a bearish MACD. The 4-hour chart leans slightly bullish with positive MACD and Stochastic buy signals, but a weak ADX (19.74) suggests a lack of conviction. The daily chart, despite its strong ADX, has a neutral Stochastic and a bearish MACD, creating a complex technical puzzle.
Bearish Scenario: Resistance Holds Firm
60% ProbabilityConsolidation Scenario: Range-Bound Action
25% ProbabilityBullish Scenario: Breakout Momentum
15% ProbabilityThe probabilities assigned reflect the current technical ambiguity. The bearish scenario holds the highest probability due to the proximity of strong resistance and conflicting signals on longer timeframes. However, a consolidation phase is also highly plausible given the weak ADX readings across charts, suggesting indecision. A bullish breakout would require significant conviction and volume, which is not currently evident in the shorter-term indicators, making it the least probable scenario at this exact moment.
The Path Ahead: What to Watch for in USDJPY
As USDJPY navigates this critical resistance zone around $162.37, traders must remain vigilant. The immediate focus will be on the price action around the $162.593 resistance level. A decisive break above this level, supported by strong volume and positive follow-through, could signal a continuation of the bullish trend, potentially targeting higher resistance levels like $163.459. However, failure to overcome this hurdle could lead to a pullback, with $162.187 and subsequently $161.727 acting as key support levels to watch.
The upcoming economic data releases, particularly US CPI and any Fed commentary, will be crucial catalysts. A hotter-than-expected inflation print or hawkish Fed remarks could provide the impetus for a dollar rally, potentially pushing USDJPY higher. Conversely, signs of cooling inflation or dovish Fed signals might trigger a dollar correction, leading to a USDJPY decline. The interplay between these macroeconomic drivers and the pair's technical posture will ultimately dictate its next significant move. Given the current mixed signals and the proximity to resistance, a period of consolidation or increased volatility is highly likely. Patience and a disciplined approach to risk management will be paramount for traders looking to capitalize on the potential opportunities that arise from this pivotal market juncture.
Frequently Asked Questions: USDJPY Analysis
What happens if USDJPY fails to break above the $162.593 resistance level?
If USDJPY fails to break above $162.593, we could see a pullback towards immediate support at $162.187. A sustained move below this could target the daily support at $161.727, especially if negative macroeconomic news emerges.
Should I consider a short position on USDJPY at current levels near $162.37 given the resistance?
While resistance is near, the bullish signals on shorter timeframes and the overall carry trade dynamic suggest caution. A short position might be considered if price decisively breaks below $162.136, with clear confirmation of selling momentum, targeting $161.727.
Is the RSI at 60.04 on the daily chart a buy signal for USDJPY?
An RSI of 60.04 on the daily chart is in the neutral zone, leaning bullish but not yet in overbought territory. While it suggests upward momentum, it's not a standalone buy signal and should be considered alongside other indicators and price action near resistance.
How might upcoming US CPI data impact USDJPY if it comes in hotter than expected?
If US CPI data comes in hotter than expected, it could reinforce the Fed's hawkish stance, strengthening the dollar and likely pushing USDJPY higher above the $162.593 resistance. This would validate the bullish scenario, targeting higher levels.
Track markets in real-time
AI-powered analysis, technical indicators and real-time price data.
Join Our Telegram Channel
Breaking market news, AI analysis and trading signals instantly.
Join Channel