

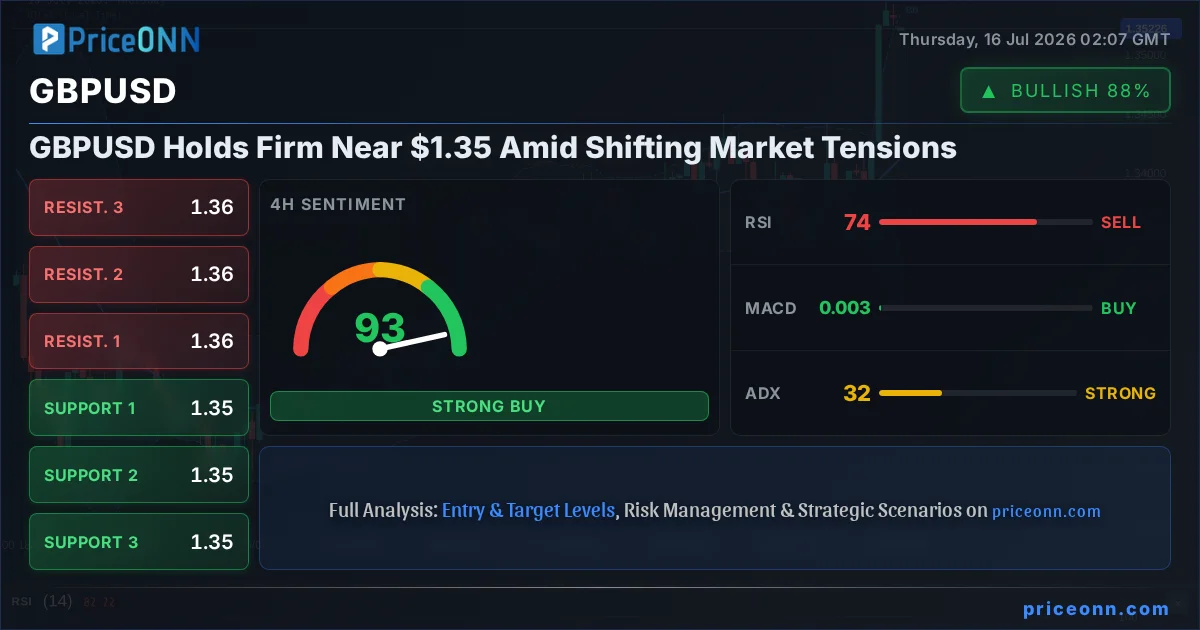
The GBPUSD pair is currently locked in a tight battleground, trading precisely at $1.35. This psychological level is more than just a number; it’s a focal point where opposing market forces are clashing. Bulls are trying to push higher, fueled by a recent uptick in the Pound's momentum and some encouraging, albeit mixed, economic data. Bears, however, are digging in, citing lingering geopolitical uncertainties, the strength of the US Dollar Index (DXY), and cautionary signals from key technical indicators. Understanding this tug-of-war is crucial for anyone navigating the choppy waters of the forex market right now. This analysis dives deep into the fundamental drivers, technical underpinnings, and potential scenarios shaping the GBPUSD's immediate future.
- RSI at 62.44 on the 1H chart signals overbought pressure, suggesting caution for further upside.
- Critical resistance sits at $1.35582, a level that needs to be convincingly cleared for sustained bullish momentum.
- The DXY at 100.54 is currently under pressure, offering some support to GBPUSD, but its trend remains a key factor.
- Upcoming US CPI and UK GDP data releases are key catalysts that could break the current equilibrium.
The current market sentiment surrounding GBPUSD is best described as a tense equilibrium. While the pair has managed to reclaim the $1.35 mark, the underlying forces are far from settled. The Dollar Index (DXY), a critical counterpart for major currency pairs, has seen a slight retreat, currently trading at 100.54. This dip in the dollar provides some breathing room for riskier assets and currencies like the British Pound. However, the DXY's overall trend and its ability to find a floor will be a significant determinant of the GBPUSD’s trajectory. Traders are keenly watching for any signs of capitulation in the dollar or a renewed push higher, as this will directly influence the strength of the Pound.
On the technical front, the 1-hour chart for GBPUSD presents a picture of cautious optimism for the bulls. With the RSI standing at 62.44, we are in overbought territory, but not yet at extreme levels that would typically signal an imminent reversal. This suggests that while momentum is to the upside, the pace might be unsustainable without further fundamental catalysts. The MACD is showing positive momentum, with the MACD line above the signal line, reinforcing the current bullish leanings on this shorter timeframe. The Stochastic oscillator, with %K at 72.83 and %D at 72.27, also leans bullish, indicating that upward movement is favored in the immediate term. The ADX at 34.3 points to a strong uptrend on this 1-hour chart, underscoring the current bullish conviction among short-term traders. However, this strength needs to be viewed in the context of the broader market structure and longer-term indicators.
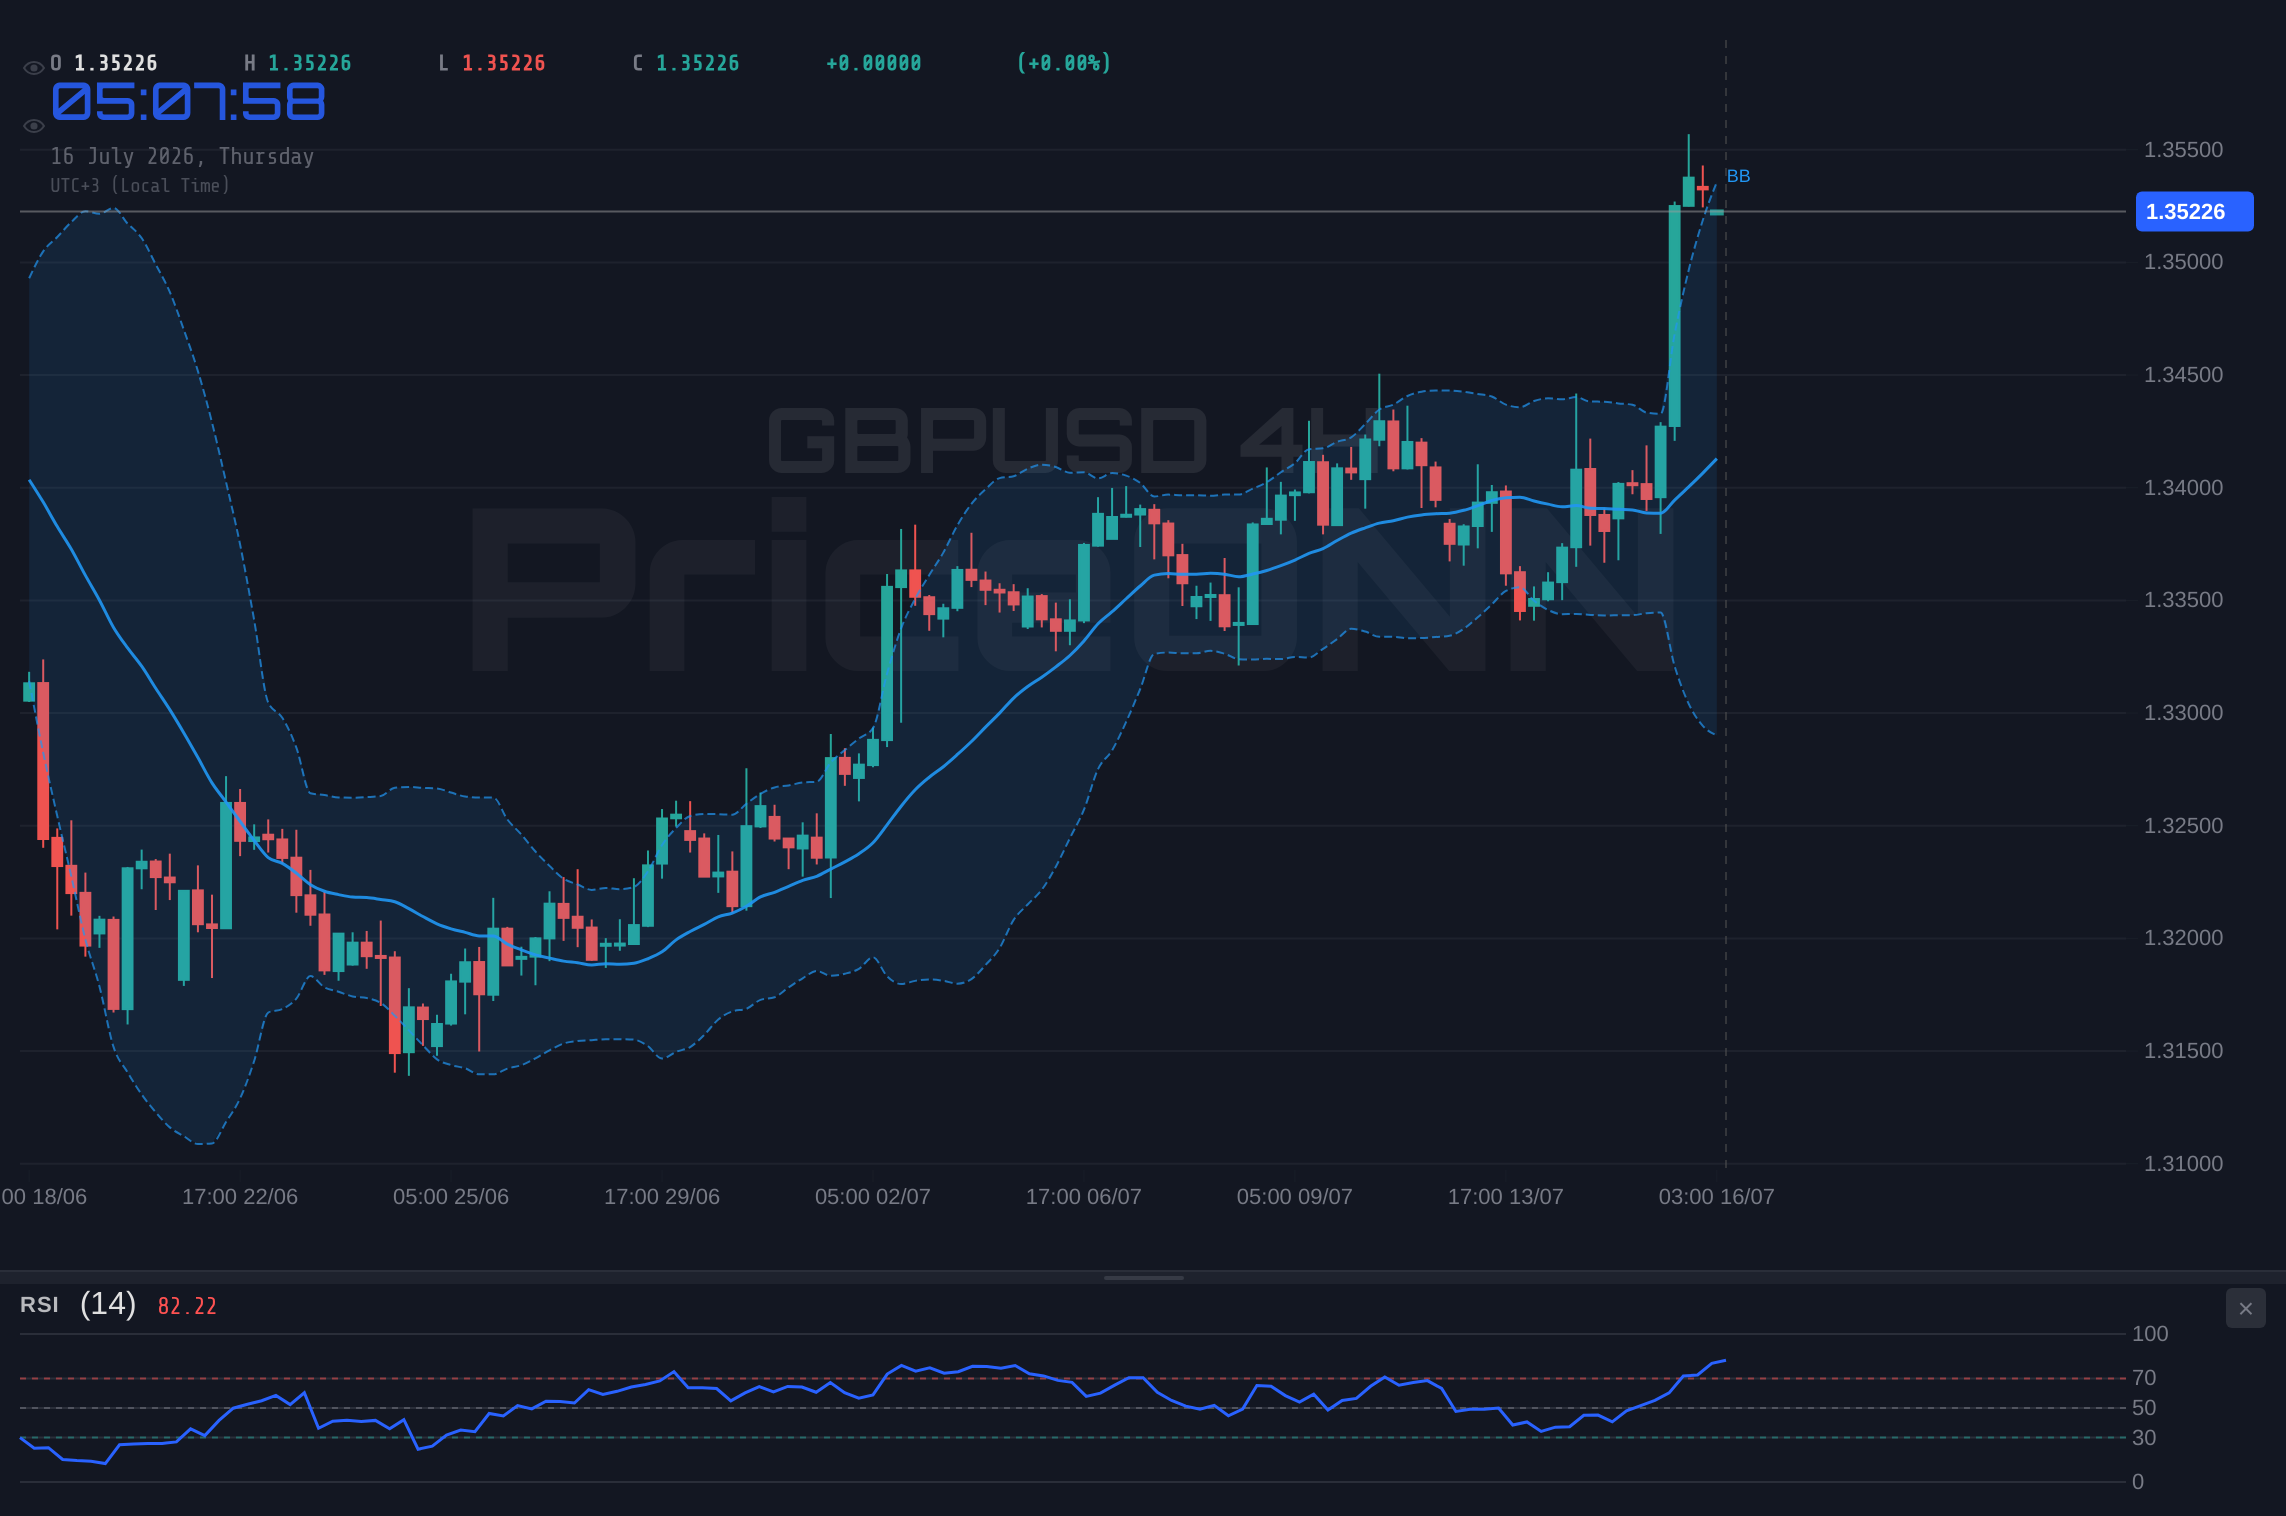
Moving to the 4-hour timeframe, the picture for GBPUSD becomes more nuanced. The trend is officially classified as neutral, with a strength of 50%, indicating a lack of clear directional conviction over this intermediate period. The RSI at 63.89 remains in the upper neutral zone, still suggesting room for upside but approaching levels where caution is advised. MACD continues to show positive momentum, and the Stochastic oscillator (%K at 79.34, %D at 65.94) is firmly in bullish territory, indicating strong upward pressure on this timeframe. Yet, the ADX reading of 19.73 suggests a weaker trend compared to the 1-hour chart, implying that the current upward move might be losing some of its conviction or entering a consolidation phase. This divergence between the shorter-term bullish signals and the weaker trend on the 4-hour chart highlights the delicate balance at play around the $1.35 level.
The daily chart for GBPUSD paints an even more complex scenario, officially showing a neutral trend with 50% strength. Here, the RSI sits at 49.98, almost perfectly balanced between overbought and oversold territory, offering no clear directional bias. The MACD, while showing positive momentum, is closely watched for any potential crossovers that could signal a shift. The Stochastic oscillator (%K at 46.27, %D at 49.36) is leaning bearish, with %K below %D, suggesting a potential pullback or consolidation. Crucially, the ADX on the daily chart is 27.77, indicating a strong downtrend, which contradicts the shorter-term bullish signals. This conflict between timeframes is a classic sign of market indecision and suggests that the pair is at a critical juncture. The immediate price action around $1.35 is likely to be influenced heavily by upcoming economic data that could break this technical stalemate.
From a fundamental perspective, the British Pound's recent performance has been a mixed bag. While the UK economy has shown resilience in some areas, persistent inflation and ongoing concerns about the global economic outlook continue to weigh on sentiment. The Bank of England (BoE) remains in a delicate balancing act, needing to curb inflation without stifling economic growth. Any hints from BoE officials regarding future monetary policy – whether hawkish or dovish – will be keenly observed. The market is pricing in a certain probability of interest rate hikes, but the pace and magnitude are subject to incoming inflation and growth data. The GBPUSD's ability to sustain levels above $1.35 will partly depend on whether the UK’s economic narrative can convincingly outperform that of the United States in the coming weeks.
On the US side of the equation, the narrative is equally complex. The US Dollar Index (DXY) is currently trading at 100.54, showing a slight decline. This has provided some relief for currency pairs like GBPUSD. However, the underlying strength of the US economy, particularly its labor market, continues to be a pillar of support for the dollar. Upcoming US Consumer Price Index (CPI) data is a critical event on the economic calendar. If inflation proves to be stickier than expected, it could reignite expectations of further Federal Reserve rate hikes, bolstering the dollar and putting pressure on GBPUSD. Conversely, a significant cooling in inflation could lead to a reassessment of Fed policy, potentially weakening the dollar and giving GBPUSD a clearer path higher.
The correlation between GBPUSD and the DXY cannot be overstated. Historically, a strengthening dollar tends to put downward pressure on GBPUSD, and vice versa. With the DXY currently showing signs of weakness around the 100.50 mark, GBPUSD has found some support. However, this relationship is not always linear. Market sentiment, risk appetite, and specific economic news from the UK can override the typical dollar-driven movements. For instance, strong UK employment figures or positive GDP growth could allow GBPUSD to climb even if the DXY remains firm. Conversely, negative surprises from the UK economy could see GBPUSD fall despite a weaker dollar.
Considering the broader market context, equity markets are also playing a role. The S&P 500 is trading at 6572.87, showing a modest gain, while the Nasdaq 100 is down slightly at 29433.02. This mixed performance in US equities suggests a degree of caution among investors. In times of uncertainty or mixed risk sentiment, safe-haven assets can sometimes benefit. While the US Dollar is often considered a safe haven, gold and silver are also in play. Gold, currently at $4036.82, is experiencing a slight dip, indicating that immediate safe-haven demand might be subdued. However, any escalation in geopolitical tensions or a significant downturn in equities could quickly shift this dynamic, potentially boosting demand for safe-haven currencies and assets, which could indirectly impact GBPUSD.
The energy markets, particularly oil prices, serve as a barometer for global inflation expectations and geopolitical risks. Brent crude is trading around $84.14, and WTI is at $80.30, both showing slight declines. A sustained rise in oil prices could fuel inflation concerns, potentially leading central banks to maintain or increase interest rates. This would generally support their respective currencies. However, the current slight pullback in oil suggests that immediate inflationary pressures from energy might be easing, or at least stabilizing. Any significant geopolitical event affecting oil supply, such as tensions in the Middle East, could quickly alter this picture and introduce volatility across global markets, including GBPUSD.
Looking ahead, the economic calendar is packed with events that could provide the catalyst needed to break the current stalemate around $1.35 for GBPUSD. Key upcoming releases include the US CPI data, which will offer crucial insights into the inflation trajectory and potential Federal Reserve policy. On the UK side, Gross Domestic Product (GDP) figures and manufacturing data will be closely watched for signs of economic strength or weakness. These data points will significantly influence central bank expectations and, consequently, the direction of GBPUSD. Traders will be dissecting these releases for any surprises that deviate from market consensus, as these are often the triggers for significant price movements.
The tension between the bullish signals on shorter timeframes and the neutral-to-bearish undertones on longer timeframes creates a complex trading environment. For short-term traders, the immediate action around $1.35 is key. A confirmed break above resistance levels like $1.35582 could open the door for further upside, targeting $1.36. However, the RSI at 62.44 on the 1H chart suggests that such a move might face immediate profit-taking. Conversely, a decisive break below the support at $1.34684 could signal a reversal, with bears eyeing lower levels towards $1.34. The ADX readings across different timeframes are also telling: a strong uptrend on the 1H (ADX: 34.3) contrasts with a strong downtrend on the daily (ADX: 27.77) and a weaker trend on the 4H (ADX: 19.73). This confluence of conflicting signals underscores the need for patience and strict risk management.
The debate between bulls and bears at the $1.35 mark for GBPUSD is a classic example of market indecision driven by conflicting data and upcoming catalysts. Bulls are drawing strength from the current positive momentum on shorter timeframes and a slight reprieve in the US Dollar. They see the potential for a sustained move higher if key resistance levels are breached and UK economic data continues to surprise to the upside. Bears, on the other hand, are pointing to the overbought conditions on the 1H RSI, the weaker trend signals on the 4-hour chart, and the strong downtrend indicated by the daily ADX. They are also wary of potential dollar strength returning if US inflation data comes in hot, or if geopolitical risks escalate.
Given the current technical setup and the anticipation of key economic data, the market appears to be in a consolidation phase, waiting for a clear directional cue. The $1.35 level is serving as a pivot point. A sustained move above the immediate resistance cluster around $1.35582, $1.35785, and $1.35832 could embolden the bulls. However, this would likely require a significant positive catalyst, such as surprisingly strong UK economic data or a dovish shift in Fed expectations. On the downside, a break below the support levels starting at $1.34684, $1.34637, and $1.34610 could initiate a sell-off, especially if US inflation data comes in higher than expected, boosting the dollar and triggering risk-off sentiment.
Bearish Scenario: Dollar Strength Returns
40% ProbabilityBullish Scenario: Pound Resilience
35% ProbabilityNeutral Scenario: Range-Bound Volatility
25% ProbabilityThe immediate future for GBPUSD hinges on key economic data releases. The US CPI report is particularly crucial; a higher-than-expected reading could strengthen the dollar, pushing GBPUSD towards its support levels, potentially breaking below $1.34610. Conversely, softer inflation could weaken the dollar, allowing GBPUSD to test resistance around $1.35582 and beyond. Similarly, UK GDP figures will provide vital clues about the health of the British economy. A strong showing could bolster the Pound, while a disappointing report might lead to a sell-off. Until these data points are released, expect volatility around the $1.35 psychological level.
The RSI at 62.44 on the 1-hour chart suggests that while momentum is bullish, the pair is approaching overbought territory, indicating that further significant upside might require strong fundamental backing. The ADX on the daily chart at 27.77, however, points to a strong downtrend, which contradicts the shorter-term bullish signals. This conflict highlights the indecision in the market and the importance of waiting for confirmation from price action and upcoming economic news. The $1.35 level remains a critical pivot; a decisive move above or below it will likely dictate the next significant price action.
Frequently Asked Questions: GBPUSD Analysis
What happens if GBPUSD breaks above $1.35582 resistance?
A sustained break above $1.35582, especially on strong volume, would invalidate the bearish scenario and could target higher resistance levels like $1.35868. This would likely be driven by positive UK economic news or a dovish shift in Fed expectations.
Should I buy GBPUSD at current levels of $1.35 given the RSI at 62.44?
Buying at current levels carries risk due to the RSI being in overbought territory on the 1H chart. A more prudent approach might be to wait for a pullback to a support level like $1.34684 or confirmation of a clear breakout above resistance, especially after key economic data is released.
Is the MACD negative momentum on the 1H chart a sell signal for GBPUSD?
The MACD showing negative momentum on the 1H chart is a cautionary signal, despite other indicators leaning bullish. It suggests that the upward momentum might be weakening. However, it's not a standalone sell signal without confirmation from price action breaking key support levels or other bearish indicators aligning.
How will upcoming US CPI data affect GBPUSD this week?
Higher-than-expected US CPI data could strengthen the US Dollar, potentially pushing GBPUSD down towards support levels like $1.34610. Conversely, softer inflation might weaken the dollar, allowing GBPUSD to climb towards resistance around $1.35582, especially if UK data also supports the Pound.
Track markets in real-time
AI-powered analysis, technical indicators and real-time price data.
Join Our Telegram Channel
Breaking market news, AI analysis and trading signals instantly.
Join Channel