

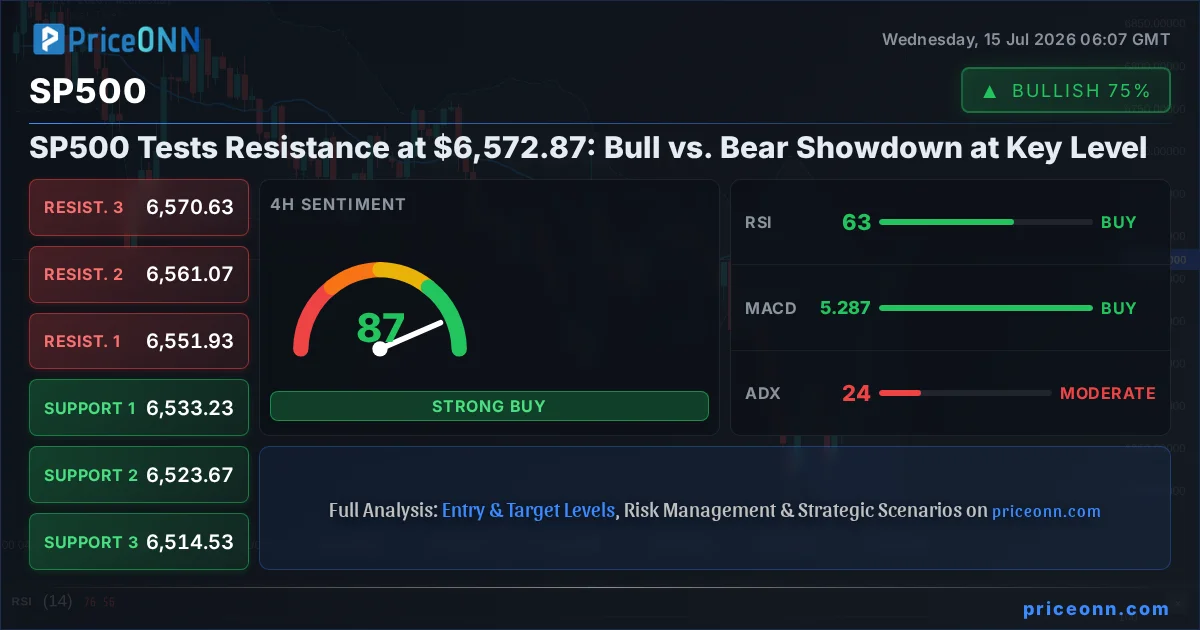
The S&P 500 is currently locked in a tense battleground, trading precisely at $6,572.87, a level that is now acting as a crucial point of contention between bullish aspirations and bearish caution. This isn't just another trading session; it's a critical juncture where the market's sentiment is being tested, and the tug-of-war at this significant resistance level demands close examination. As traders and investors navigate this pivotal moment, understanding the underlying drivers – from macroeconomic data releases to central bank policy whispers – becomes paramount in deciphering the next potential move for this major US equity index. The current price action suggests indecision, but the underlying technical and fundamental forces at play paint a complex picture, offering distinct narratives for both the bulls and the bears.
- The SP500 is testing a critical resistance level at $6,572.87, with RSI at 70.95 suggesting overbought conditions on the 1-hour chart, signaling potential for a pullback.
- Key support for the SP500 is identified at $6,526.53, while resistance looms at $6,568.73 and the more significant $6,577.27, based on 1-hour data.
- The MACD histogram shows negative momentum on the 1-hour chart, indicating that bullish momentum may be fading, despite the overall upward trend on longer timeframes.
- Correlation analysis reveals that a strengthening DXY (currently at 100.8) often puts pressure on the SP500, suggesting that dollar strength could be a headwind for further equity gains.
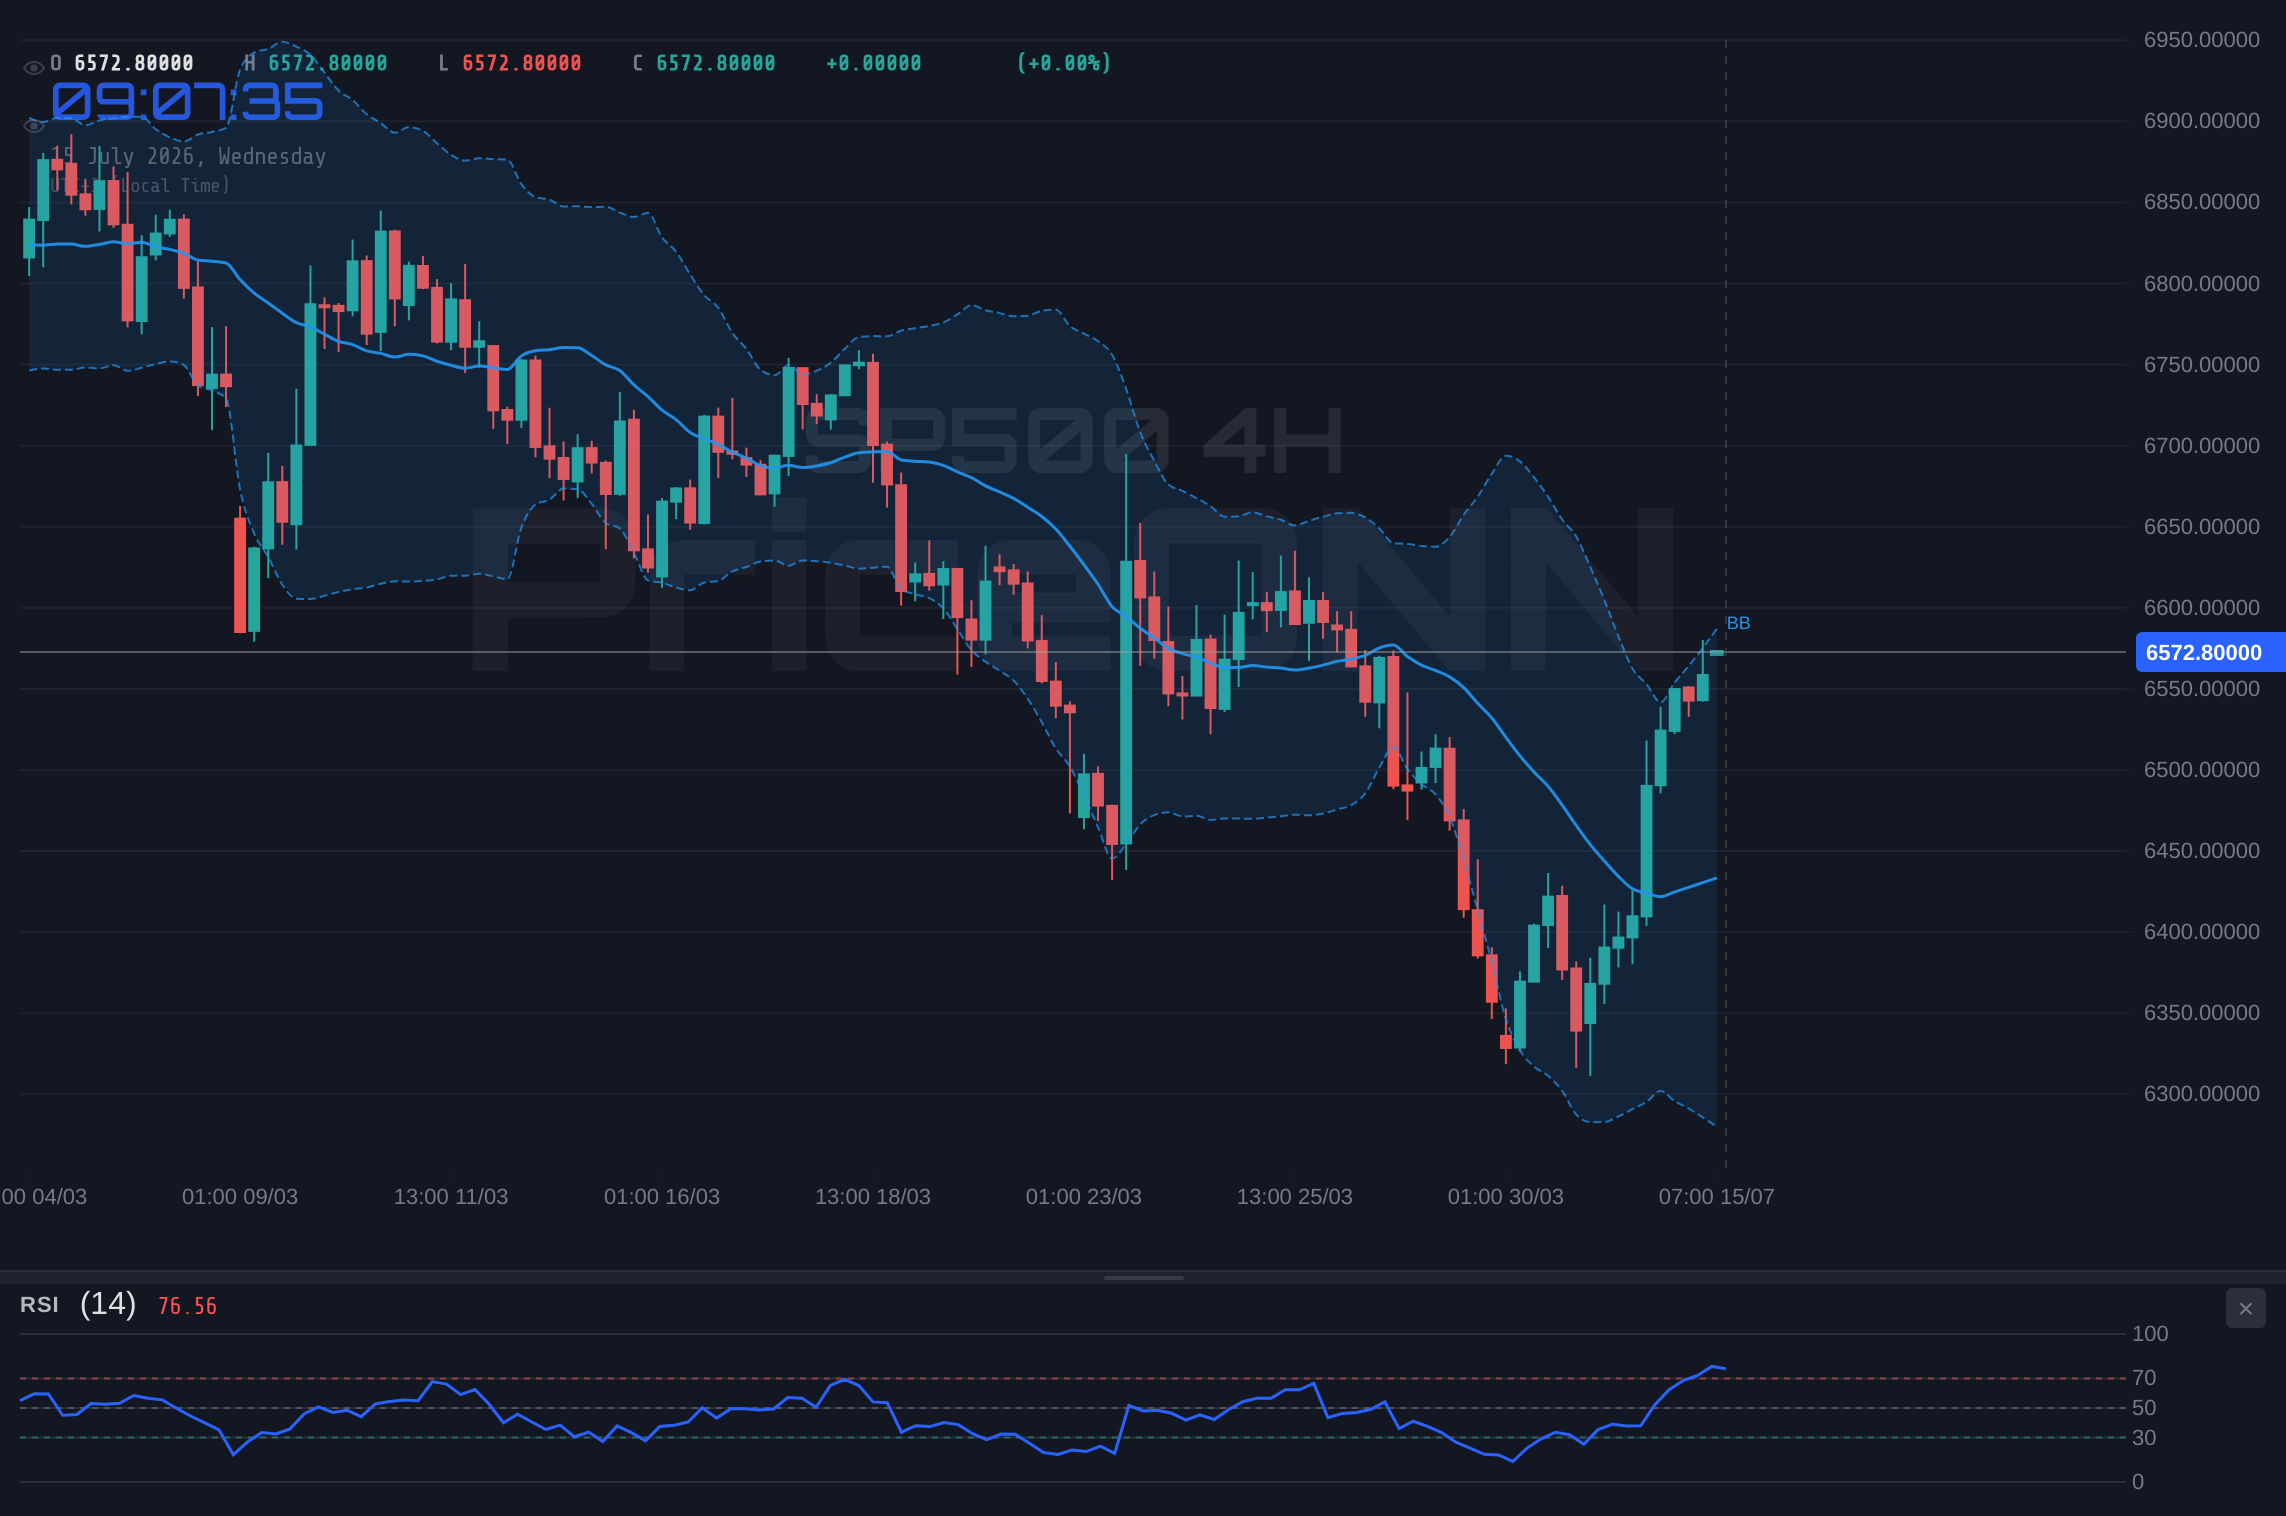
The bulls are certainly making a case for continued upside, pointing to the index's recent surge and the broader upward trend observed on longer timeframes. On the 4-hour chart, the SP500 shows a neutral trend with a power of 50%, but the MACD is positive, and the Stochastic oscillator is in overbought territory at 97.85. This suggests underlying strength, or at least the potential for it, as buyers have managed to push the price above the mid-Bollinger band, indicating a bullish inclination. The daily chart, while showing a bearish trend with 100% power, also displays positive MACD momentum and a Stochastic K value (42.97) that has crossed above its D value (29.88), hinting at a potential reversal or at least a pause in the downtrend. The sheer force of the upward move, pushing the index towards new highs, is a testament to the persistent buying pressure. This rally has been fueled by a combination of factors, including strong corporate earnings reports from key sectors and a generally accommodative, albeit cautious, stance from central banks globally. Investors are looking beyond immediate inflation concerns, betting on continued economic resilience and innovation, particularly in the tech sector which heavily influences indices like the SP500 and Nasdaq 100.
The Bullish Thesis: Breaking Through and Pushing Higher
The argument for the bulls centers on the prevailing momentum and the potential for a breakout above the current resistance. The 1-hour chart, despite showing an RSI of 70.95 which often signals overbought conditions, also boasts a strong ADX of 49.72, indicating a powerful trend is in play. While RSI might suggest a short-term pause or minor pullback is possible, the high ADX implies that any dip could be shallow, with the trend likely to resume. The Nasdaq 100, currently at 29846.2, is also showing bullish signs on its 1-hour and 4-hour charts, often moving in tandem with the SP500. This tech-heavy index's upward trajectory, with its RSI at 75.46 and Stochastic in extreme overbought territory, suggests a broader market appetite for risk assets. Furthermore, the Dow Jones 30, trading at 52577.5, is also showing a predominantly bullish signal across its timeframes, reinforcing the idea of a generally positive sentiment across major US indices. The bulls are betting that this upward momentum will carry the SP500 decisively above the $6,572.87 mark, potentially targeting the next resistance level at $6,568.73 on the 1-hour chart, or even higher if the breakout is strong. The sustained buying pressure, evidenced by positive MACD readings on the 4-hour and daily charts, suggests that dips are being bought, a classic sign of a healthy uptrend. The ability of the SP500 to hold above its mid-Bollinger Band on the 4-hour chart also adds to the bullish narrative, indicating that the price is being supported by the short-to-medium term moving average.
Looking at the fundamental landscape, the bulls find support in the recent economic data. While inflation remains a concern, the latest reports suggest a cooling trend, particularly in energy prices, as noted in the news regarding tumbling fuel prices impacting US CPI data. This cooling inflation, if sustained, could provide a buffer for central banks, potentially delaying or moderating aggressive interest rate hikes. The market seems to be pricing in a scenario where inflation is managed without a severe economic downturn. Furthermore, corporate earnings have generally been robust, particularly in the technology sector, which continues to drive the Nasdaq 100 and, by extension, the SP500. The news that Rio Tinto ranks as a top metals pick, while not directly tied to the SP500, hints at underlying strength in commodity-linked sectors, which can sometimes correlate with broader economic optimism. The bulls are therefore positioning for a scenario where the Fed, while vigilant on inflation, prioritizes economic growth and avoids a hard landing, allowing equities to continue their upward climb.
The correlation with the US Dollar Index (DXY) also plays a role in the bullish narrative, albeit with nuances. The DXY is currently trading at 100.8 and showing a bearish trend on the 1-hour chart. A weakening dollar can often be a tailwind for US equities, as it makes dollar-denominated assets more attractive to foreign investors and can signal easing global financial conditions. While the 4-hour and daily DXY charts show neutral trends, the short-term weakness aligns with the bullish sentiment for the SP500. The news that the British Pound gained traction above 1.3400 as softer US CPI data dampened Fed rate hike expectations also supports the idea of a potentially less hawkish Fed, which is generally positive for equities. The bulls interpret these signs as confirmation that the market is looking past immediate inflation data and focusing on the potential for continued economic expansion, supported by a less aggressive monetary policy stance.
The Bearish Counter-Argument: Cracks in the Foundation
However, the bears have a compelling case, highlighting several warning signs that suggest the current rally might be unsustainable. The most immediate concern is the overbought condition indicated by the RSI on the 1-hour chart, sitting at 70.95. While not an immediate sell signal, it suggests that the market is getting stretched and susceptible to profit-taking. The MACD histogram on the same 1-hour chart is negative, indicating fading bullish momentum. This divergence between price action and momentum indicators is a classic warning sign of a potential reversal. On the daily chart, the SP500's trend is decidedly bearish with 100% power, despite the short-term fluctuations. The ADX at 38.49 on the daily timeframe confirms a strong trend, and if that trend is downwards, the current rally could simply be a retracement before further declines. The support level at $3,990.67 on the daily chart, while distant, represents a significant area where a breakdown could accelerate.
Furthermore, the macroeconomic environment presents significant headwinds. While the news suggests cooling inflation, the underlying inflationary pressures might still be more persistent than the market is currently pricing in. The Federal Reserve remains data-dependent, and any indication that inflation is not receding fast enough could lead to renewed hawkishness, higher interest rates, and a subsequent sell-off in equities. The correlation with the DXY is also a double-edged sword. While the 1-hour DXY is weak, the daily chart shows a neutral trend with a strong ADX of 29.35, indicating that the dollar could regain strength if market conditions shift. A resurgent dollar would undoubtedly put pressure on US equities, especially if it coincides with risk-off sentiment. The news regarding Bitcoin's vulnerability and mounting downside risks, despite its general correlation with risk assets, also hints at a broader nervousness in speculative markets.
The divergence in signals across different timeframes also fuels the bears' argument. While the 1-hour and 4-hour charts might show signs of bullish momentum, the daily chart's strong bearish trend cannot be ignored. The fact that the SP500 is testing resistance at $6,572.87, a level that has proven difficult to break decisively, suggests that sellers are active in this zone. The news about Gold sliding as oil surges and Fed hike bets build highlights the conflicting forces at play; rising oil prices can reignite inflation fears, potentially forcing the Fed's hand. This complex interplay of factors suggests that the current rally might be more of a bear market rally than the start of a new sustained uptrend. The bears are looking for a decisive break below the 1-hour support at $6,526.53 as a confirmation of their thesis, which could then lead to a test of the more significant 4-hour support at $6,533.23.
Weighing the Evidence: Where Do We Stand?
The battle between bulls and bears is clearly defined at the $6,572.87 resistance level. The bulls point to the overall uptrend on longer timeframes, positive momentum on 4-hour charts, and a potentially dovish Fed. They see the current price action as a healthy consolidation before a new leg higher. The RSI and Stochastic on the 1-hour chart are indeed showing overbought conditions, which could lead to a temporary pullback, but the strong ADX suggests that any dip would likely be bought, reinforcing the primary uptrend. The bulls' strategy would involve a decisive break and hold above $6,572.87, using $6,568.73 as an immediate confirmation point, with targets extending towards $6,577.27 and beyond. They are banking on continued positive economic data and a Fed that remains on hold or pivots sooner rather than later.
Conversely, the bears highlight the overbought conditions on shorter timeframes, negative MACD momentum on the 1-hour chart, and the strong bearish trend on the daily timeframe. They view the current rally as a bear market bounce, susceptible to failure at this key resistance. The DXY's potential to strengthen and the conflicting signals from oil prices and inflation data provide them with ammunition. The bears' ideal scenario involves the SP500 failing to break above $6,572.87 and instead reversing lower, breaking through the 1-hour support at $6,526.53 and potentially testing the 4-hour support at $6,533.23. They are waiting for confirmation of a trend reversal, perhaps signaled by a daily close below a significant moving average or a clear shift in Fed rhetoric.
The technical indicators present a mixed but predominantly cautionary picture for the short term. The 1-hour chart shows conflicting signals: strong ADX and price action, but RSI and MACD suggest waning momentum. The 4-hour chart offers a more balanced view, with positive MACD and Stochastic, but a weak ADX suggesting a lack of conviction in the trend. The daily chart, however, remains a significant concern for the bulls, showing a strong bearish trend despite short-term positive MACD momentum. This divergence between short-term optimism and long-term bearish structure is the crux of the current market tension. A sustained move above $6,572.87, confirmed by increasing volume and positive momentum across multiple timeframes, would be needed to alleviate the bears' concerns. Until then, the market remains at a critical crossroads, with the potential for either a breakout to new highs or a sharp reversal.
Navigating the Crossroads: What's Next for the SP500?
The immediate future of the SP500 hinges on its ability to decisively clear the $6,572.87 resistance. If the bulls can achieve this, fueled by positive economic news or a dovish shift from the Fed, we could see a continuation of the rally towards the next resistance levels. The Nasdaq 100 and Dow Jones 30 showing strength would support this scenario. However, the bearish signals on the daily chart and the overbought conditions on the 1-hour timeframe cannot be ignored. A failure to break through resistance could trigger a significant sell-off, especially if key support levels like $6,526.53 on the 1-hour chart give way. The market sentiment is currently balanced precariously, and any significant economic data release or geopolitical event could tip the scales.
The interplay between inflation, interest rates, and corporate earnings will be crucial. If inflation continues to moderate and the Fed signals a pause or pivot, the bullish case gains significant traction. Conversely, any resurgence in inflation or hawkish rhetoric from the Fed could quickly turn the tide against the bulls. The DXY's movement will also be a key indicator to watch; a strengthening dollar could signal increasing risk aversion, benefiting the bears. For traders, the $6,572.87 level serves as a critical pivot. A clear break above it could signal further upside, while a failure to do so and a subsequent drop below $6,526.53 might indicate a short-term top and a move lower. Patience and risk management are key as the market digests these conflicting signals and awaits clearer direction.
Looking ahead, the upcoming economic calendar will be pivotal. The US CPI data, though already released and showing some cooling, will be closely scrutinized for any signs of persistent inflation. Any upcoming Fed speeches or minutes from policy meetings will be analyzed for clues about future interest rate paths. The market's reaction to these events will likely determine whether the SP500 consolidates, breaks higher, or succumbs to bearish pressures. The current price action around $6,572.87 represents a critical decision point, and the path forward will depend on which narrative – bullish expansion or bearish slowdown – ultimately prevails.
The Path Forward: Scenarios for SP500
Bearish Scenario: Resistance Holds Firm
65% ProbabilityNeutral Scenario: Consolidation Around Resistance
25% ProbabilityBullish Scenario: Breakout Confirmed
10% ProbabilityFrequently Asked Questions: SP500 Analysis
What happens if SP500 fails to break above $6,572.87 resistance?
A failure to break above $6,572.87 could lead to a pullback, with the 1-hour support at $6,526.53 being the immediate level to watch. Bears would likely target the 4-hour support at $6,533.23 if this level breaks, potentially signaling a deeper correction.
Should I buy SP500 at current levels of $6,572.87 given the RSI at 70.95?
Buying at $6,572.87 with RSI at 70.95 on the 1-hour chart carries significant risk due to overbought conditions. A more prudent approach would be to wait for a confirmed breakout above resistance or a pullback to a key support level like $6,526.53, with confirmation from other indicators like MACD.
Is the RSI at 70.95 a sell signal for SP500 right now?
An RSI reading of 70.95 on the 1-hour chart suggests overbought conditions, which can precede a short-term pullback or consolidation. It's not an outright sell signal on its own, but it indicates that the upward momentum may be slowing and that caution is warranted for new long positions.
How will the Fed's stance on interest rates affect SP500 around $6,572.87?
A hawkish Fed stance, suggesting further rate hikes, would likely pressure the SP500, especially near resistance at $6,572.87, as it increases borrowing costs and reduces risk appetite. Conversely, a dovish stance or signals of a pause could embolden buyers to break through resistance.
Track markets in real-time
AI-powered analysis, technical indicators and real-time price data.
Join Our Telegram Channel
Breaking market news, AI analysis and trading signals instantly.
Join Channel