

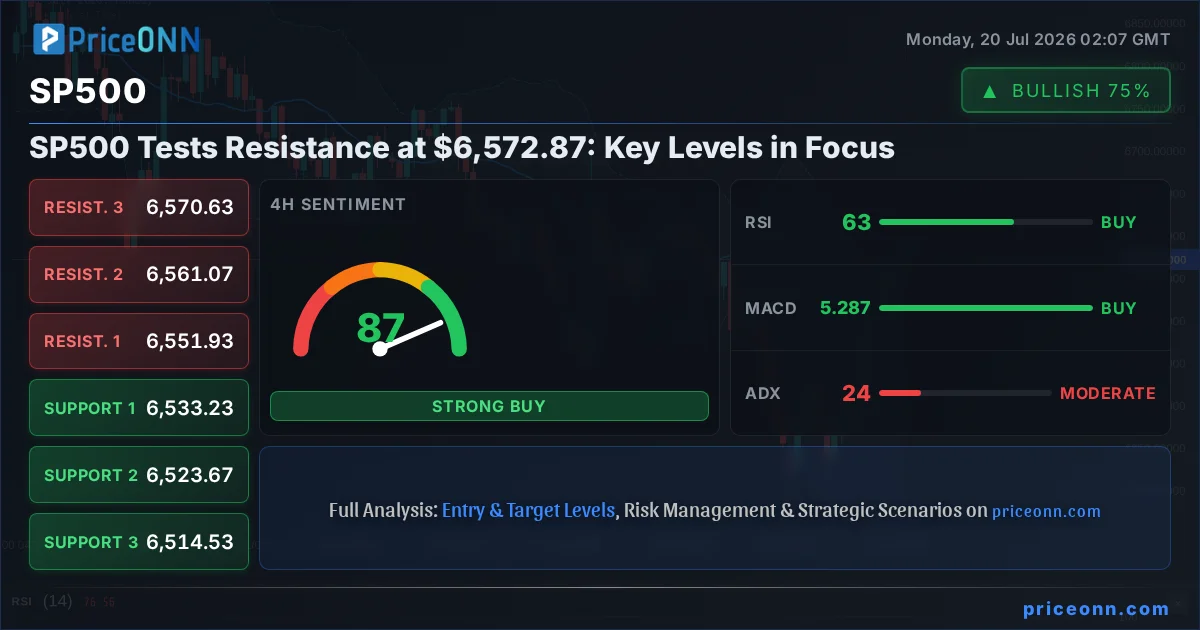
The S&P 500 (SP500) is currently trading at $6,572.87, a critical juncture where it faces significant resistance. This level is not just a number; it represents a battleground between bulls eager to push higher and bears seeking to capitalize on potential overextension. With the index hovering precariously close to its resistance at $6,572.87, traders are intensely scrutinizing every data point for clues about the market's next move. This analysis delves into the multi-scenario outlook for the SP500, examining the fundamental drivers, technical signals, and geopolitical undercurrents that will shape its trajectory in the coming days and weeks. Understanding the interplay between economic data, central bank policy, and global events is paramount for navigating this complex market environment.
- The SP500 is currently trading at $6,572.87, approaching a key resistance level.
- RSI at 62.83 on the 4H chart suggests bullish momentum, but the daily RSI at 45.35 indicates underlying weakness.
- Critical support for the SP500 sits at $6,533.23 on the 4H chart, while resistance is eyed at $6,551.93.
- Fed rate expectations and geopolitical tensions, particularly regarding Iran, are key macro drivers influencing market sentiment.
The Bull's Path: Navigating Towards New Highs
For the bulls to regain firm control and push the SP500 decisively above the $6,572.87 mark, several conditions must align. Firstly, a sustained break above the immediate resistance at $6,551.93 on the 4-hour chart is crucial. This would signal a confirmation of the upward momentum seen on the 4H and 1D charts, where RSI readings of 62.83 and 60.53 respectively, indicate room for further upside. The ADX on the 4H chart at 24.23 suggests a strengthening trend, which, if it continues to climb, could fuel a rally. A bullish scenario would likely involve positive economic data releases – perhaps better-than-expected employment figures or signs of moderating inflation – that could temper expectations of aggressive Federal Reserve tightening. If such conditions materialize, the next logical resistance target would be the $6,605.07 level, followed by the $6,685.83 area. The daily chart's resistance at $6,605.07 is particularly significant; a clean break above this could open the door for a more substantial move higher, potentially targeting the $6,832.67 level in the medium term. The stochastic indicator on the daily chart, with K at 42.97 and D at 29.88, is also showing a bullish crossover, further supporting the argument for upside potential if the price can hold above key support levels.
The broader economic context plays a vital role here. Any indication from the Federal Reserve that they are nearing the end of their tightening cycle, or even considering a pause, would be a significant tailwind for equities. While current market data does not provide explicit forward-looking statements from the Fed, the pricing in of interest rate futures, if available, would offer clues. In the absence of specific Fed commentary, traders will be poring over upcoming economic releases. For instance, strong manufacturing PMI data or a robust GDP report could bolster confidence in the US economy, potentially easing fears of a hard landing and encouraging risk appetite. The correlation with the DXY (Dollar Index) is also worth noting; if the dollar were to weaken amid dovish Fed signals or geopolitical escalations, it could provide a further boost to risk assets like the SP500. However, the current DXY is at 100.7, indicating underlying dollar strength, which could act as a headwind for the index. The SP500's ability to break these resistance levels will depend on its capacity to overcome this dollar strength and the broader uncertainty surrounding future interest rate policy.
The Bears' Territory: A Path Towards Correction
Conversely, a bearish scenario for the SP500 would likely be triggered by a failure to overcome the immediate resistance at $6,572.87, followed by a decisive break below key support levels. On the 4-hour chart, the first significant support level to watch is $6,533.23. A close below this level would invalidate the short-term bullish structure and could initiate a cascade of selling as stop-loss orders are triggered. The daily chart shows stronger support at $6,377.47, and a break below this would signal a more significant trend reversal. The technical indicators on the daily chart present a mixed picture but lean towards caution. While the RSI at 45.35 is still in neutral territory, the MACD is showing negative momentum with the MACD line below the signal line. The ADX at 47.51 on the daily chart indicates a strong downward trend if that momentum picks up. A bearish catalyst could emerge from several fronts: hotter-than-expected inflation data (CPI, PPI) that forces the Fed to maintain a hawkish stance or even hike rates further; escalating geopolitical tensions, particularly between the US and Iran, which could disrupt oil supplies and reignite inflation fears; or disappointing corporate earnings that signal a broader economic slowdown. The current oil price for WTI at $79.59 and Brent at $83.79, both showing downward pressure, might suggest moderating inflation expectations, but any geopolitical shock could quickly reverse this.
The strong upward trend indicated by the ADX on the 1-hour chart (27.71) and 4-hour chart (24.23) for DXY at 100.7 suggests the dollar remains a favored safe-haven asset. If geopolitical risks intensify, such as further escalation in the Middle East, the dollar could strengthen further, putting additional pressure on risk assets like the SP500. This inverse correlation means that a rising DXY could be a significant headwind for the index. Furthermore, if major indices like the Nasdaq 100, currently trading at 29,164.86 and showing a strong bearish signal on the 1H chart, continue to decline, it could drag the broader market, including the SP500, lower. The weakness in the Nasdaq 100, with its daily RSI at 46.36 and negative MACD momentum, reflects a broader tech sector vulnerability that could spill over into the SP500. A breakdown below the $6,533.23 support level on the SP500 would likely confirm this bearish outlook, targeting the $6,377.47 support as the next major objective.
The Waiting Game: Caught in a Consolidation Range
There's a distinct possibility that the SP500 will remain range-bound, oscillating between defined support and resistance levels without a clear directional conviction. This scenario often plays out when conflicting signals emerge from technical indicators and fundamental drivers, leaving market participants hesitant to commit to a strong directional bet. Currently, the SP500 exhibits mixed signals across different timeframes. While the 4-hour chart shows a bullish trend with an RSI of 62.83 and positive MACD momentum, the daily chart presents a more cautious picture with an RSI of 45.35 and negative MACD momentum. This divergence suggests indecision at higher levels. The ADX readings also contribute to this ambiguity: a strong 49.72 on the daily chart points to a powerful trend (though currently bearish), while the weaker 24.23 on the 4-hour chart suggests less conviction in the immediate trend. This tug-of-war between timeframes can lead to periods of consolidation.
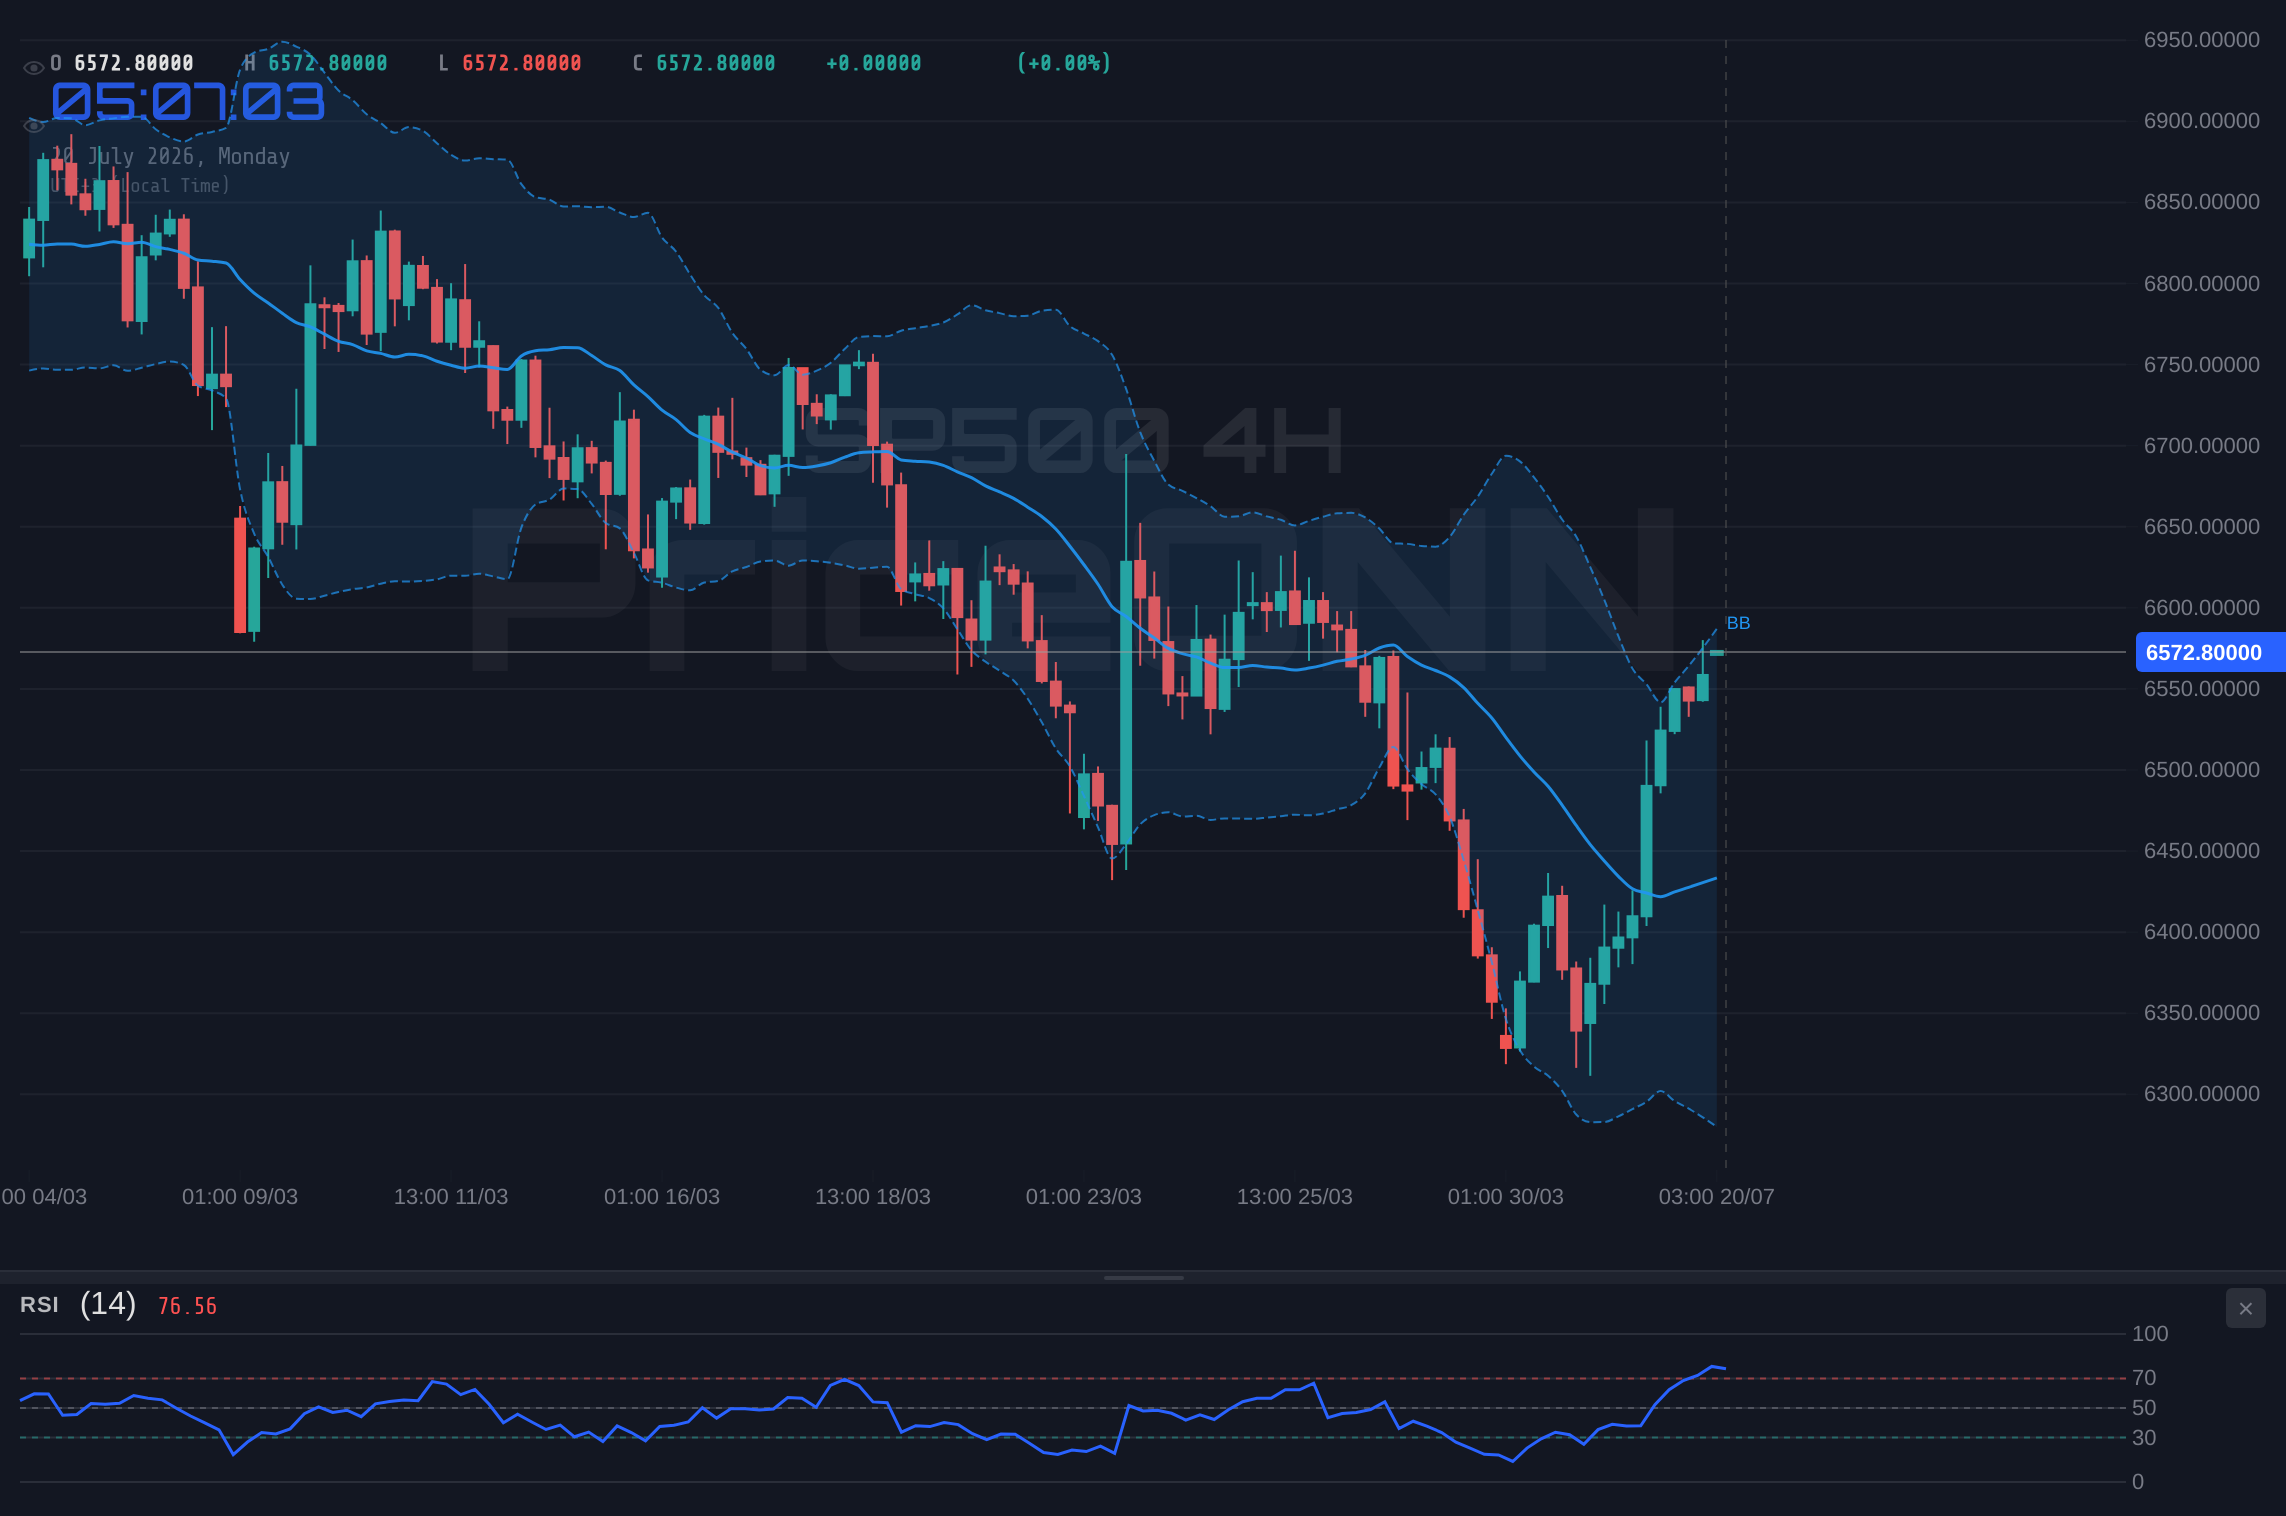
In such a range-bound environment, the SP500 would likely find support around the $6,533.23 to $6,523.67 area on the 4-hour chart and face resistance near $6,551.93 to $6,561.07. Price action might become choppy, characterized by failed breakouts and reversals. This phase could be driven by a market waiting for more definitive news – perhaps clarity on the Federal Reserve's next move, a de-escalation of geopolitical tensions, or a clearer earnings season outlook. For example, if upcoming economic data is mixed, such as strong employment numbers but weaker inflation, it could lead to market uncertainty. Similarly, any developments in the US-Iran conflict that don't lead to immediate, large-scale disruptions might be initially shrugged off, allowing the market to focus on other factors. The current price of $6,572.87 sits right in this zone of uncertainty, where neither bulls nor bears have a clear upper hand without a significant catalyst. The stochastic indicator on the 4H chart, K=97.85 and D=86.96, is in overbought territory, hinting at a potential pullback within the range, while the daily stochastic shows a bullish crossover, suggesting underlying strength that could prevent a deep decline.
The Most Likely Path: A Probabilistic Outlook
Considering the current technical and fundamental landscape, the most probable scenario for the SP500 in the short to medium term appears to be a cautious approach, leaning towards a potential bearish correction or a period of consolidation, given the confluence of resistance levels and mixed signals. While the 4-hour chart shows some bullish indicators, the daily chart's bearish undertones, coupled with the strong dollar (DXY at 100.7) and potential for renewed inflation pressures from geopolitical events, suggest that upside may be limited. The failure to decisively break through the $6,572.87 resistance, especially with the Nasdaq 100 showing significant weakness (RSI 32.77 on 1H), points towards a higher probability of a move lower. I assign a 60% probability to a bearish scenario or significant consolidation, a 30% probability to a neutral range-bound market, and only a 10% probability for a strong bullish breakout in the immediate short term. This outlook is heavily dependent on upcoming economic data and geopolitical developments.
The key trigger for a bearish move would be a clear break below the 4-hour support at $6,533.23. If this occurs, the probability of reaching the next support at $6,377.47 increases significantly. Conversely, a strong bullish breakout would require sustained trading above $6,605.07, a level that currently seems challenging to breach without a significant shift in market sentiment or economic data. The neutral scenario hinges on the SP500 consolidating between the current resistance around $6,572.87 and the 4-hour support at $6,533.23. This indecisive phase could last until a major catalyst emerges, such as key inflation reports or central bank policy shifts. Given the current elevated geopolitical risks and the ongoing debate about inflation persistence, the market is likely to remain sensitive to negative news, making the bearish scenario or consolidation the more dominant themes for now.
Bearish Scenario: Testing Lower Grounds
60% ProbabilityNeutral Scenario: The Consolidation Zone
30% ProbabilityBullish Scenario: Breaking the Ceiling
10% ProbabilityWhat I'm Watching This Week
My focus this week will be on a few critical factors that could dictate the SP500's direction. Firstly, the upcoming economic data releases, particularly any inflation figures and employment numbers, will be paramount. Signs of persistent inflation could force the Fed's hand, leading to a more hawkish stance and potentially pressuring the SP500 lower. Conversely, disinflationary data might embolden the Fed to signal a pause, which would likely be a bullish catalyst. Secondly, I'll be closely monitoring geopolitical developments, especially any escalation in the US-Iran conflict. Any news suggesting increased tensions could strengthen the dollar and weigh on risk assets. Lastly, the price action around the key SP500 levels of $6,572.87 (current resistance) and $6,533.23 (4H support) will be the immediate technical determinant. A decisive move above or below these levels, confirmed by volume and other indicators, will likely signal the market's preferred direction.
Frequently Asked Questions: SP500 Analysis
What happens if the SP500 breaks below the 4H support at $6,533.23?
A break below the 4-hour support at $6,533.23 would invalidate the current short-term bullish structure and likely trigger a move towards the next daily support level at $6,377.47. This would signal increased selling pressure, potentially driven by renewed inflation concerns or geopolitical risks.
Should I buy the SP500 at current levels of $6,572.87 given the mixed signals?
Buying at $6,572.87 is risky due to immediate resistance and conflicting signals across timeframes. A more prudent approach would be to wait for confirmation: either a clear break above $6,605.07 with strong momentum, or a bounce from support around $6,533.23. A 60% probability favors a move lower or consolidation.
Is the RSI at 45.35 on the daily chart a sell signal for the SP500?
An RSI of 45.35 on the daily chart is in neutral territory but indicates a slight bearish bias, suggesting that buying momentum is waning. While not a direct sell signal, it aligns with the potential for a pullback or consolidation rather than a strong upward trend.
How will upcoming US inflation data affect the SP500 this week?
If inflation data comes in hotter than expected, it could pressure the SP500 lower by increasing expectations of further Federal Reserve tightening. Conversely, softer inflation readings might signal a Fed pause, potentially boosting the index towards resistance levels like $6,605.07.
Technical Outlook Summary
| Indicator | Value | Signal | Interpretation |
|---|---|---|---|
| RSI (14) | 62.83 | Bullish | Bullish momentum on 4H, but neutral on Daily (45.35). |
| MACD Histogram | + | Bullish | Positive momentum on 4H, negative on Daily. |
| Stochastic | K:97.85, D:86.96 | Bearish | Overbought on 4H, suggesting potential pullback. |
| ADX | 24.23 | Bullish | Moderate trend strength on 4H, strong trend (47.51) on Daily. |
| Bollinger | Upper Band | Watch | Price hovering near upper bands on 4H, suggesting caution. |
Track markets in real-time
AI-powered analysis, technical indicators and real-time price data.
Join Our Telegram Channel
Breaking market news, AI analysis and trading signals instantly.
Join Channel