

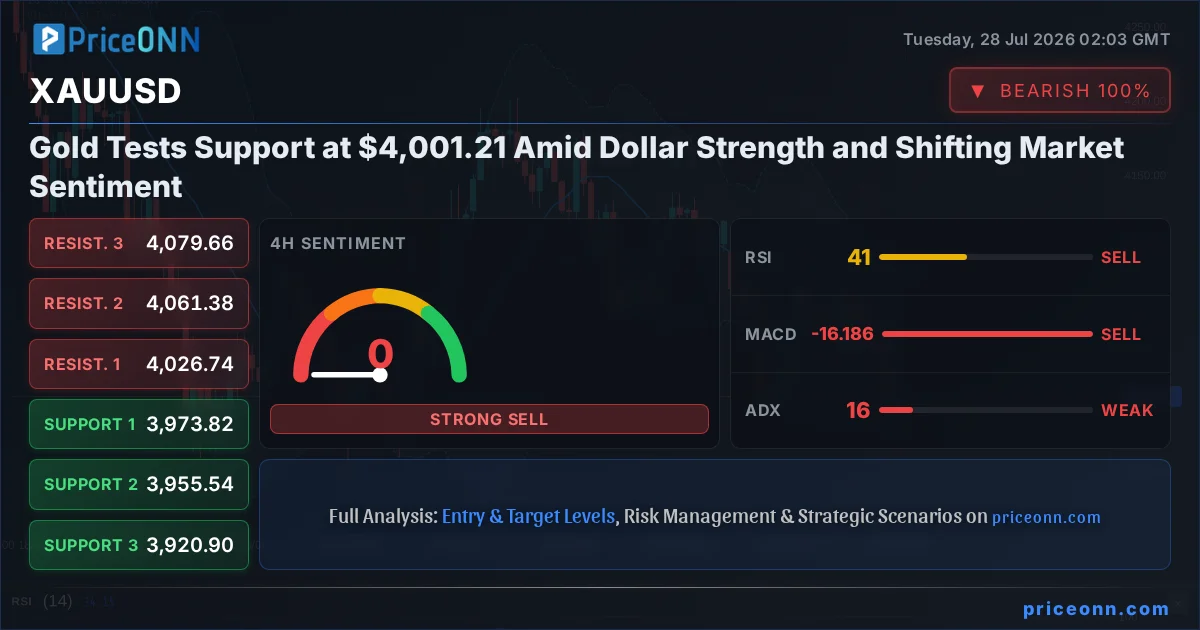
Is gold's recent dip to $4,001.21 a temporary pause or the start of a deeper correction? After a period of significant volatility, the precious metal is currently finding itself at a critical juncture. The daily chart paints a picture of caution, with the price action testing key support levels while broader market sentiment, influenced by a strengthening Dollar Index (DXY) and mixed signals from equity markets like the S&P 500, adds layers of complexity. Understanding the interplay between these factors is crucial for navigating the current gold market landscape. This analysis delves into the intricate technical and fundamental drivers shaping XAUUSD's immediate future, exploring potential scenarios and the critical price levels traders are watching.
- XAUUSD is trading around $4,001.21, with the 1-hour RSI at 37.81 indicating a neutral stance but with a slight downward lean.
- Critical support lies at $3,991.80, while resistance is being tested near $4,019.21; a break of either will signal the next directional move.
- The daily ADX at 39.16 signifies a strong downtrend, but conflicting signals from MACD and Stochastic on shorter timeframes suggest potential for ranging or reversal.
- The Dollar Index (DXY) is currently at 100.7, showing strength that typically pressures gold prices downward, though its 4-hour and daily signals are mixed.
The Tug-of-War: Gold vs. The Dollar at $4,001.21
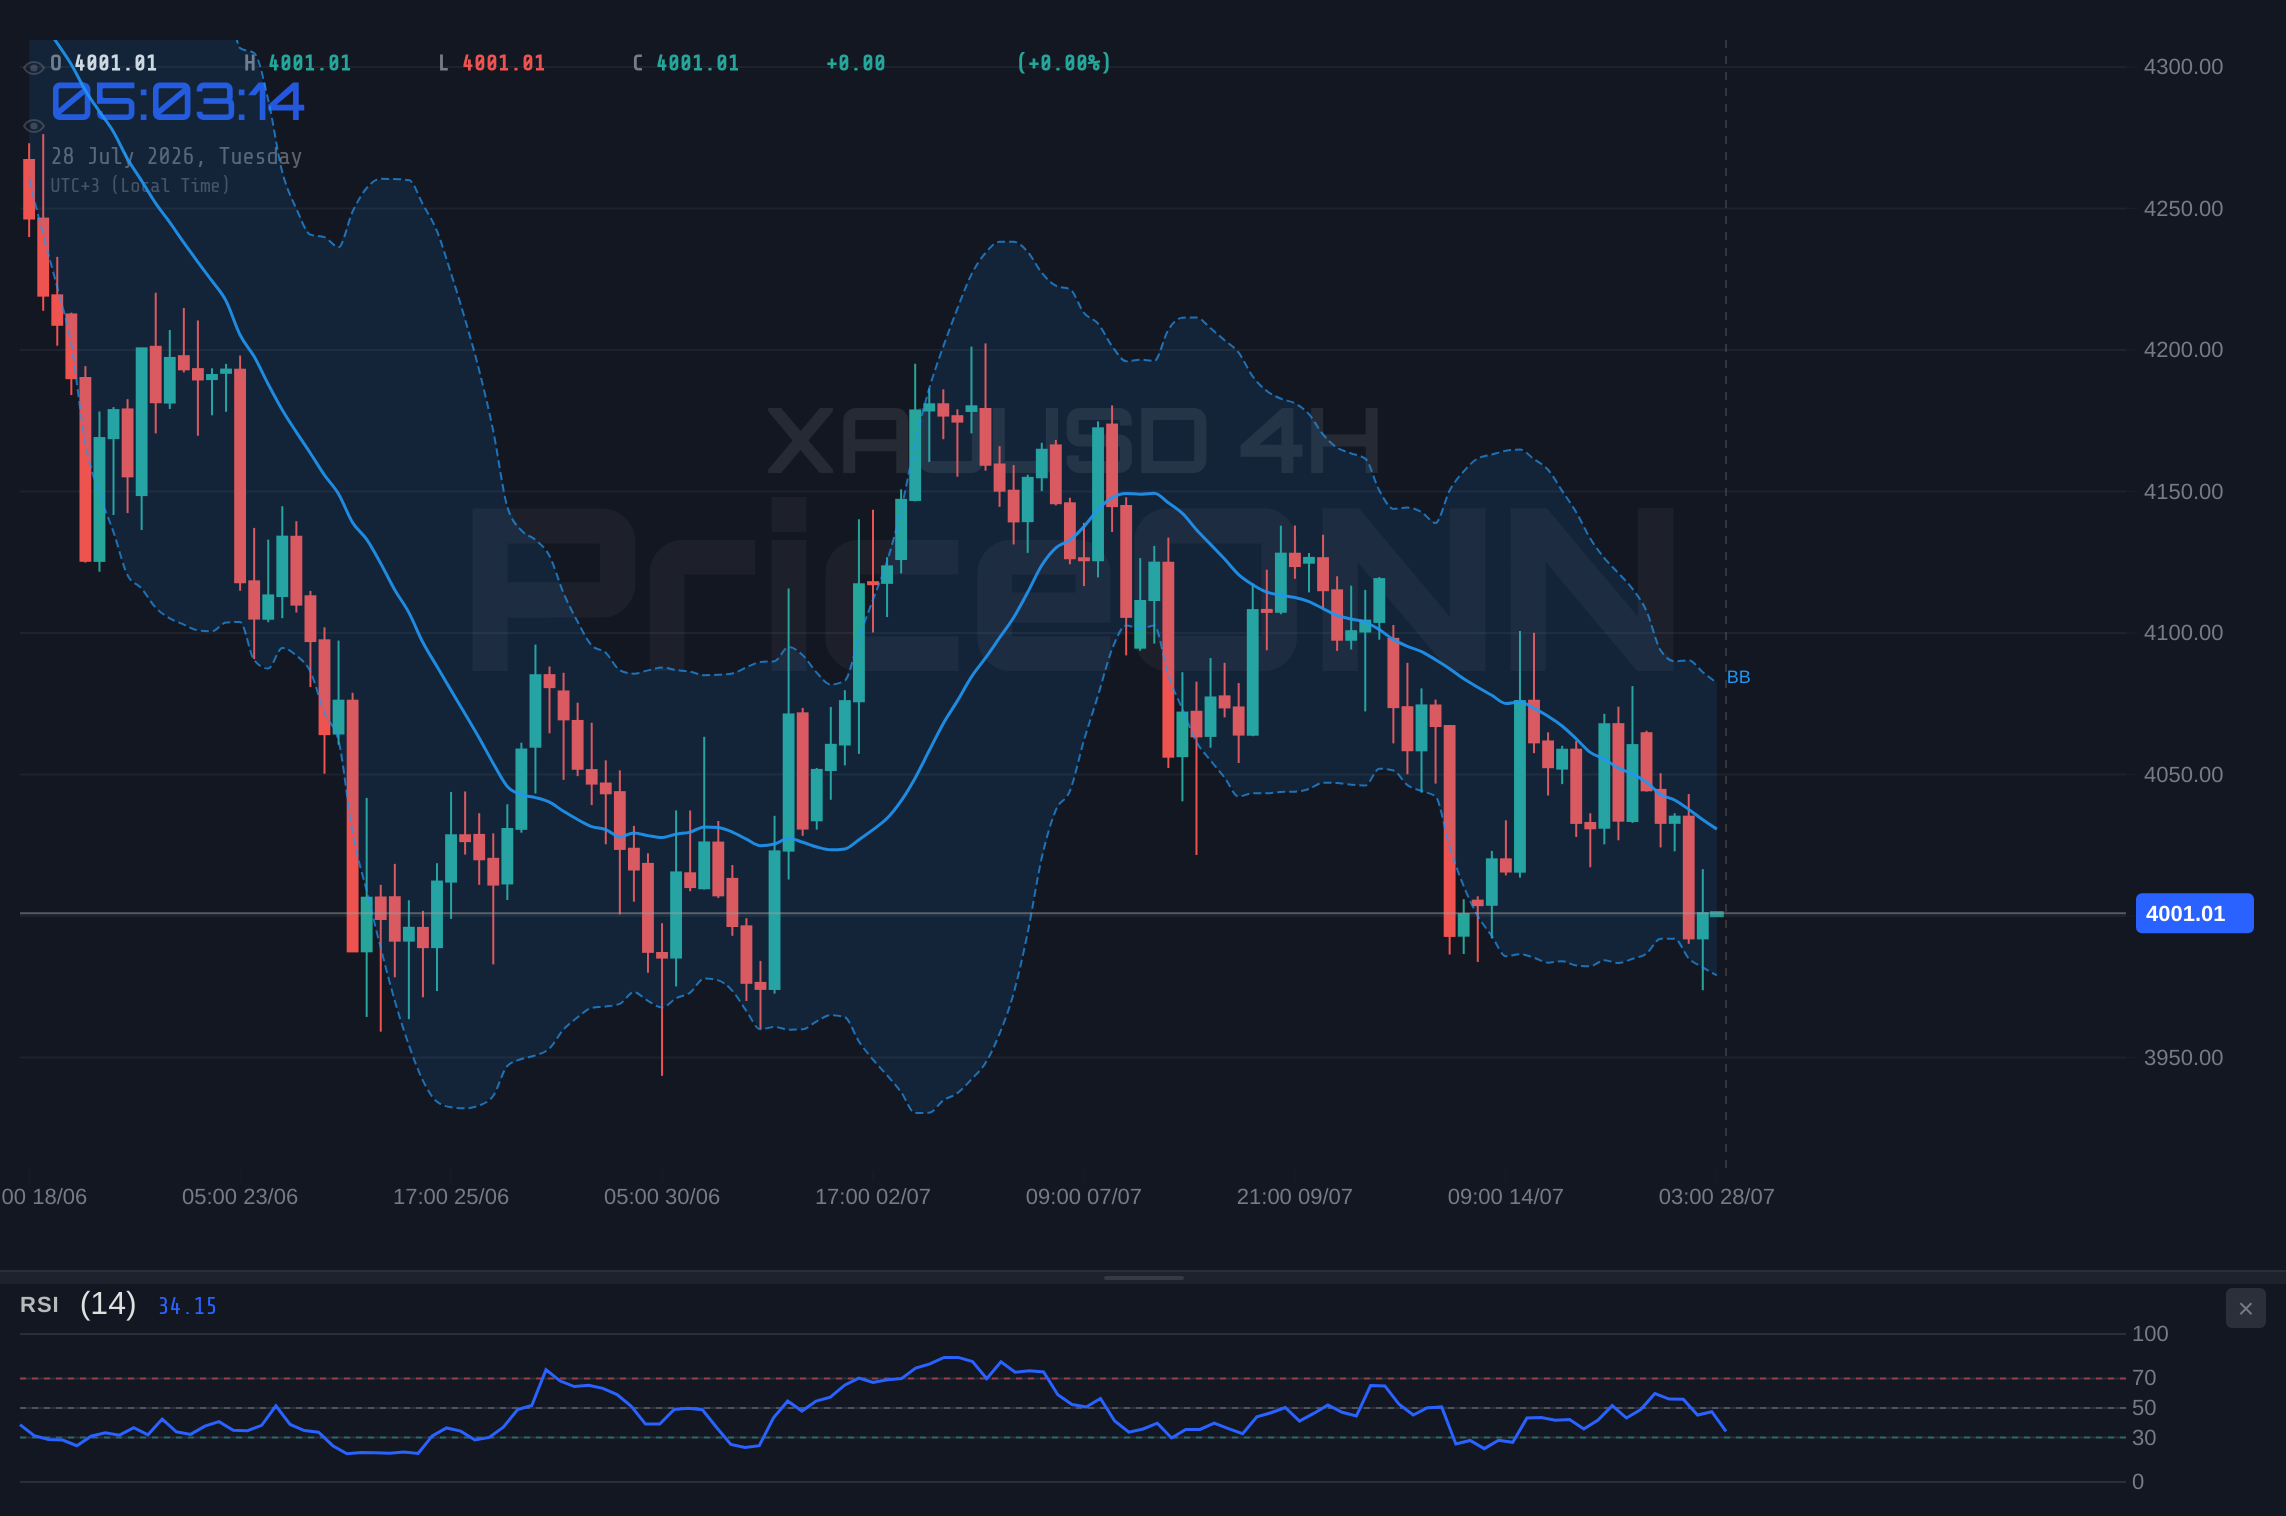
Gold's journey to $4,001.21 is a story of conflicting forces. On one hand, the daily technical indicators, particularly the ADX at 39.16, scream 'downtrend.' This suggests that the bearish momentum is firmly in control on the longer timeframe. The price is trading below the middle Bollinger Band on the daily chart, a classic sign of bearish pressure. However, the picture isn't entirely one-sided. Shorter timeframes, like the 1-hour chart, show a Stochastic oscillator giving a bullish signal (%K > %D at 40.52 vs 37.27), hinting at a potential short-term bounce. This divergence between longer-term trends and shorter-term signals creates a 'WATCH_ZONE' environment, where caution is paramount. The market is choppy, as indicated by the weak ADX readings on the 4-hour chart (15.79), meaning that any breakout move could be prone to false signals. The immediate focus is on the $3,991.80 support level; a decisive break below this could accelerate the downtrend, while holding it might invite short-covering rallies towards the $4,019.21 resistance.
The correlation with the Dollar Index (DXY) cannot be overstated. The DXY is currently trading at 100.7, showing upward momentum on the 1-hour chart, which typically exerts downward pressure on gold. However, the DXY's own signals are mixed across different timeframes, reflecting a similar indecisiveness in the broader currency market. This lack of clear direction from the DXY means gold's price action might be more influenced by its own internal technicals and sentiment rather than purely by dollar strength. Investors are closely watching if the recent dip below $4,024.67 on the daily chart is a mere retracement or the beginning of a larger bearish trend. The fact that the S&P 500 is showing a strong upward move (0.74% at 6572.87) on the 1-hour chart, while gold is declining, suggests a risk-on environment, which typically doesn't favor safe-haven assets like gold. However, the Nasdaq 100's significant 1.16% drop on the 1-hour chart (29164.86) introduces a conflicting risk-off element, creating a complex backdrop.
Bearish Scenario: The Downtrend Deepens
70% ProbabilityNeutral Scenario: Choppy Consolidation
20% ProbabilityBullish Scenario: A Bounce from Support
10% ProbabilityThe Bear's Roadmap: Why $3,991.80 is Critical
The prevailing technical signals, especially on the daily timeframe, lean bearish. The ADX reading of 39.16 on the daily chart confirms a strong existing trend, and it's currently pointing downwards. This isn't just a minor pullback; it suggests underlying selling pressure that could persist. The fact that XAUUSD is trading at $4,001.21, below the daily resistance level of $4,088.69 and probing support at $3,991.80, is a significant bearish development. If this support fails, the path of least resistance leads lower. The 1-hour Stochastic showing a potential reversal upwards is a short-term counter-trend signal, often seen in strong downtrends as temporary bounces before further decline. The 4-hour chart's ADX of 15.79, indicating a weak trend, further supports the idea that the market is currently indecisive in the short term, making a downside break more probable given the daily trend's strength. The MACD on the 1-hour and 4-hour charts is also below its signal line, reinforcing the bearish momentum. This confluence of factors suggests that the bears have the upper hand, and a sustained move below $3,991.80 could trigger a cascade of selling, targeting the subsequent support levels at $3,976.78 and potentially $3,964.39.
Furthermore, the broader economic context adds weight to the bearish argument. While the news about easing US-Iran tensions might have initially supported risk assets and pressured oil prices (Brent down 0.83% at $83.79, WTI down 1.03% at $79.59), this doesn't necessarily translate to immediate strength for gold. Instead, a strengthening Dollar Index (DXY) at 100.7, despite mixed signals across timeframes, continues to act as a headwind. If the DXY manages to hold its ground or break higher, it will likely continue to suppress gold prices. The recent inflation data from New Zealand, showing a 1.5% rise in Q2, highlights ongoing price pressures globally. While inflation can sometimes be a tailwind for gold, it's currently overshadowed by central bank policy tightening expectations and the dollar's strength. The ECB's hawkish stance, with Kazimir suggesting at least one more rate hike, adds to the pressure on riskier assets and strengthens the dollar, indirectly weighing on gold.
The Waiting Game: Consolidation Around $4,001.21
The 'WATCH_ZONE' designation is critical here. The market is exhibiting characteristics of a trading range on the shorter timeframes, particularly evident in the 4-hour chart's weak ADX of 15.79. This suggests that neither the bulls nor the bears have established firm control over the intraday price action. Gold is currently trading at $4,001.21, caught between the immediate support at $3,991.80 and resistance at $4,019.21. Within this range, indicators are sending conflicting signals. For instance, the 1-hour Stochastic shows a bullish divergence (%K > %D), while the 4-hour Stochastic presents a bearish signal (%K
The key to this neutral scenario playing out is the inability of either side to break through the established boundaries. If gold fails to decisively break below $3,991.80, despite the daily bearish trend, buyers might step in to defend the level, anticipating a short-covering rally. Conversely, if price struggles to overcome the $4,019.21 resistance, sellers will likely re-enter the market, reinforcing the range. This 'waiting game' is often characterized by lower volume and less conviction in price movements. It's a period where traders should focus on risk management, waiting for a clear breakout or breakdown confirmation rather than trying to pick tops and bottoms within the range. The absence of strong directional cues from major correlating assets like the DXY further solidifies the possibility of a consolidation phase. The market seems to be digesting recent price action and awaiting fresh catalysts, whether from economic data releases or geopolitical developments.
The Bull's Gambit: A Bounce from Key Support
While the daily trend is decidedly bearish, a short-term bullish scenario cannot be entirely dismissed, especially if key support levels hold firm. The current price of $4,001.21 is hovering just above the critical 1-hour support at $3,991.80. If this level acts as a floor, as the 1-hour Stochastic's bullish signal suggests, we could see a rebound. This bullish thesis hinges on a few conditions: the support at $3,991.80 must hold decisively, and price needs to break through the immediate 1-hour resistance at $4,019.21. A successful breach of this resistance, backed by increasing volume and a positive shift in short-term momentum indicators (like the MACD histogram turning positive on the 1-hour chart), could open the door for a move towards $4,031.60 and potentially $4,046.62. This scenario would likely be fueled by a weakening DXY or a sudden shift in risk sentiment, perhaps driven by unexpected dovish commentary from a major central bank or a significant geopolitical de-escalation that reduces safe-haven demand for the dollar.
However, this bullish outlook is fragile. The strong daily downtrend, evidenced by the ADX of 39.16 and the price trading below the daily middle Bollinger Band, presents a significant hurdle. For a sustained rally to occur, the bears would need to lose conviction, which isn't currently indicated by the dominant longer-term trend signals. The RSI on the daily chart at 38.86, while not extremely oversold, suggests there's room for a bounce, but the overall trend needs to reverse. A key confirmation for the bulls would be a daily close above $4,024.67, a level that has acted as a pivot point. Without such a decisive move, any rally is more likely to be a counter-trend move within the larger bearish structure, offering opportunities for short-term traders but posing risks for those expecting a significant trend reversal.
| Indicator | Value | Signal | Interpretation |
|---|---|---|---|
| RSI (14) | 37.81 (1H) | Neutral | Slight downward pressure, potential for bounce. |
| MACD | Negative (1H) | Bearish Momentum | Below signal line, reinforcing downtrend. |
| Stochastic | K=40.52, D=37.27 (1H) | Bullish Crossover | Potential short-term reversal signal. |
| ADX | 20.26 (1H) | Weak Trend | Choppy conditions, breakout pending. |
| Bollinger | Below Mid-Band (1H) | Bearish Bias | Suggests downward pressure. |
Navigating the Crosscurrents: What's Next for Gold?
The current technical picture for XAUUSD at $4,001.21 is one of significant divergence and indecision, particularly when comparing different timeframes. The daily chart presents a strong bearish trend (ADX 39.16), yet the 1-hour chart offers conflicting signals, including a bullish Stochastic crossover and a neutral RSI. This conflict suggests that the market is in a 'WATCH_ZONE' – a period where a clear directional move is not yet established, and trading carries higher risk. The prevailing DXY strength at 100.7 adds another layer of complexity, typically acting as a headwind for gold, but its own mixed signals create uncertainty. The recent geopolitical news, such as the easing of US-Iran tensions, has initially pressured oil prices but hasn't provided a clear catalyst for gold's direction. Instead, the market seems to be weighing the ongoing threat of inflation, highlighted by New Zealand's CPI data, against the tightening monetary policies of central banks like the ECB.
For traders, the immediate path forward involves watching key price levels. The support at $3,991.80 is paramount. A failure to hold this level could accelerate selling towards $3,976.78 and $3,964.39, aligning with the dominant daily downtrend. Conversely, a decisive break above the 1-hour resistance at $4,019.21, coupled with a shift in daily indicators, could signal a short-covering rally, potentially targeting $4,031.60. However, given the current indecision and the strength of the daily bearish trend, the probability of a sustained bullish move appears lower. The most likely scenario in the short term seems to be continued consolidation or a test of the lower support levels.
What I'm Watching This Week
This week, my focus for XAUUSD at $4,001.21 remains squarely on the interplay between technical levels and macroeconomic drivers. Firstly, I'll be watching the price action around the $3,991.80 support. A decisive break below this level, particularly on a daily closing basis, would strongly validate the bearish scenario, opening the door for further downside. Secondly, I'm monitoring the DXY's reaction to upcoming economic data. If the dollar shows renewed strength, it will likely add pressure to gold. Lastly, I'm keeping an eye on the equity markets. A significant risk-off move in the S&P 500 or Nasdaq, despite current mixed signals, could still trigger safe-haven flows into gold, potentially invalidating the immediate bearish outlook. Patience is key; waiting for confirmation of a directional move is far more prudent than trying to anticipate it in this choppy environment.
Frequently Asked Questions: XAUUSD Analysis
What happens if XAUUSD breaks below the $3,991.80 support level?
A break below $3,991.80, especially with a daily close, would confirm the bearish trend indicated by the ADX at 39.16. This would likely trigger further selling, with the next key targets at $3,976.78 and potentially $3,964.39 as momentum accelerates.
Is the Stochastic crossover at 40.52 a buy signal for XAUUSD at $4,001.21?
The 1-hour Stochastic crossover (%K above %D) at 40.52 suggests a potential short-term bounce. However, this is a counter-trend signal against the stronger daily bearish trend (ADX 39.16). Confirmation would require a break above $4,019.21 resistance and ideally a shift in longer-term indicators.
How is the Dollar Index (DXY) at 100.7 impacting XAUUSD analysis?
The DXY at 100.7 generally exerts downward pressure on gold. While its own multi-timeframe signals are mixed, sustained dollar strength often correlates with gold weakness. This dynamic adds to the bearish bias around the $4,001.21 price level.
How will upcoming economic data influence XAUUSD around the $4,000 mark?
Upcoming data releases, especially those influencing Fed policy expectations or inflation outlooks, will be critical. Stronger-than-expected inflation data could eventually support gold, but near-term tightening fears and dollar strength might dominate. Traders should watch for surprises that could break the current indecisive pattern.
| Indicator | Value | Signal | Interpretation |
|---|---|---|---|
| RSI (14) | 37.81 (1H) | Neutral | Slight downward pressure, potential for bounce. |
| MACD Histogram | Negative (1H) | Bearish Momentum | Below signal line, reinforcing downtrend. |
| Stochastic | K=40.52, D=37.27 (1H) | Bullish Crossover | Potential short-term reversal signal. |
| ADX | 20.26 (1H) | Weak Trend | Choppy conditions, breakout pending. |
| Bollinger | Below Mid-Band (1H) | Bearish Bias | Suggests downward pressure. |
Track markets in real-time
AI-powered analysis, technical indicators and real-time price data.
Join Our Telegram Channel
Breaking market news, AI analysis and trading signals instantly.
Join Channel