

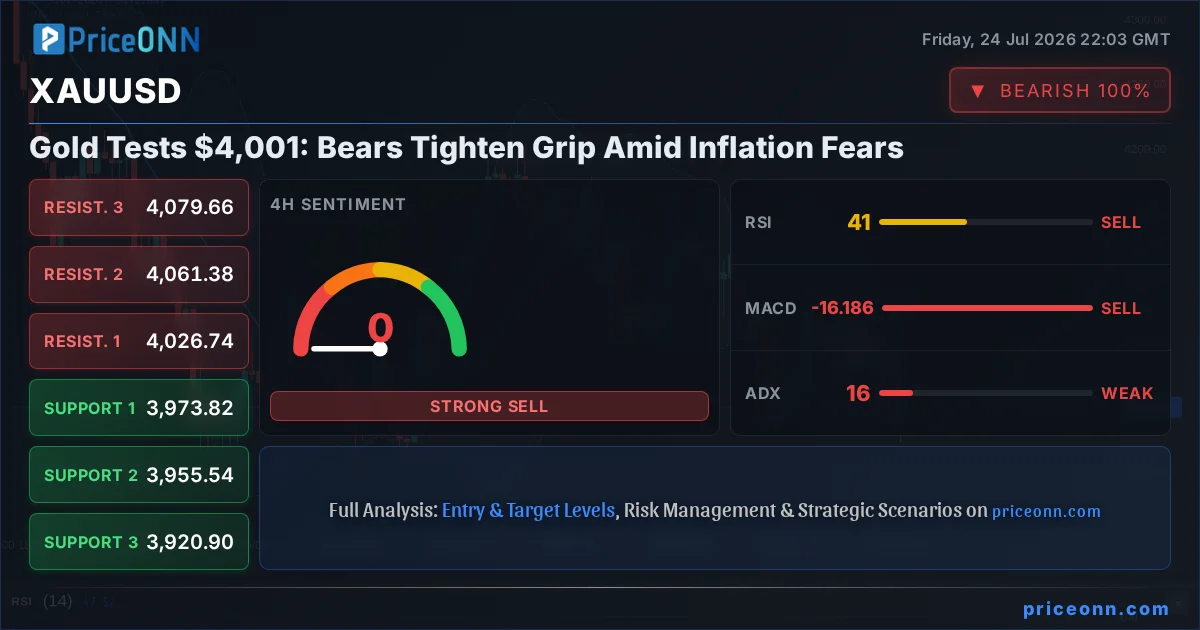
Is the golden touch fading, or is this just a pause before the next ascent? Gold has dipped below the critical $4,001.21 mark, a level that’s been under intense scrutiny. The precious metal is currently navigating a challenging landscape, caught between persistent inflation concerns that typically favor gold and a strengthening dollar that acts as a significant headwind. This delicate balance is creating a tug-of-war, and understanding which side will ultimately prevail requires a deep dive into the current market dynamics, technical signals, and the overarching macroeconomic narrative. The $4,001.21 price point isn't just a number; it's a battleground where bulls and bears are fiercely contesting control, and the outcome will shape the near-term trajectory for gold investors worldwide.
- RSI at 37.81 on the 1H chart signals waning bullish momentum, suggesting bears have the upper hand.
- Critical support for XAUUSD sits at $3,991.8, a level tested multiple times this week, acting as a crucial floor.
- The ADX at 20.26 indicates a mid-strength downtrend on the 1H chart, reinforcing the bearish sentiment.
- With DXY at 100.7, the strengthening dollar is exerting downward pressure on gold, a key correlation to monitor.
The current price action for XAUUSD paints a picture of cautious bearishness. Trading at $4,001.21, gold has seen a notable daily decline of -1.46%, shedding $59.19. This downward pressure is evident across multiple timeframes, with the 4-hour and daily charts both showing a clear downtrend. The intraday range, from $3,973.8 to $4,065.47, highlights the volatility traders are contending with. While the 1-hour chart shows a neutral trend with a strength of 50%, the overwhelming signals from the 4-hour (83% trend strength) and daily (95% trend strength) suggest that the bears are firmly in the driver's seat. This means that any upward movements are likely to be met with selling pressure, especially as we approach key resistance levels.
The Bull's Roadmap: A Path Fraught with Resistance
For the bulls to regain control, a decisive break above immediate resistance is paramount. The first significant hurdle lies at $4,019.21. A sustained move above this level, ideally accompanied by increasing volume and positive momentum on the hourly chart, could signal a short-term reprieve. However, the path doesn't get easier. The subsequent resistance at $4,031.6 and then $4,046.62 represent more substantial challenges. On the 1-hour chart, the RSI is hovering around 37.81, indicating room for upward movement before hitting overbought territory. The Stochastic oscillator on the same timeframe is showing a bullish signal (%K > %D), which could provide a temporary lift. Yet, the MACD remains in negative momentum, and the ADX at 20.26 points to a mid-strength downtrend, suggesting that any bullish conviction might be short-lived and prone to reversal. The overall 'Sell' signal on the 1-hour timeframe, despite a few contradictory indicators, underscores the prevailing bearish sentiment.
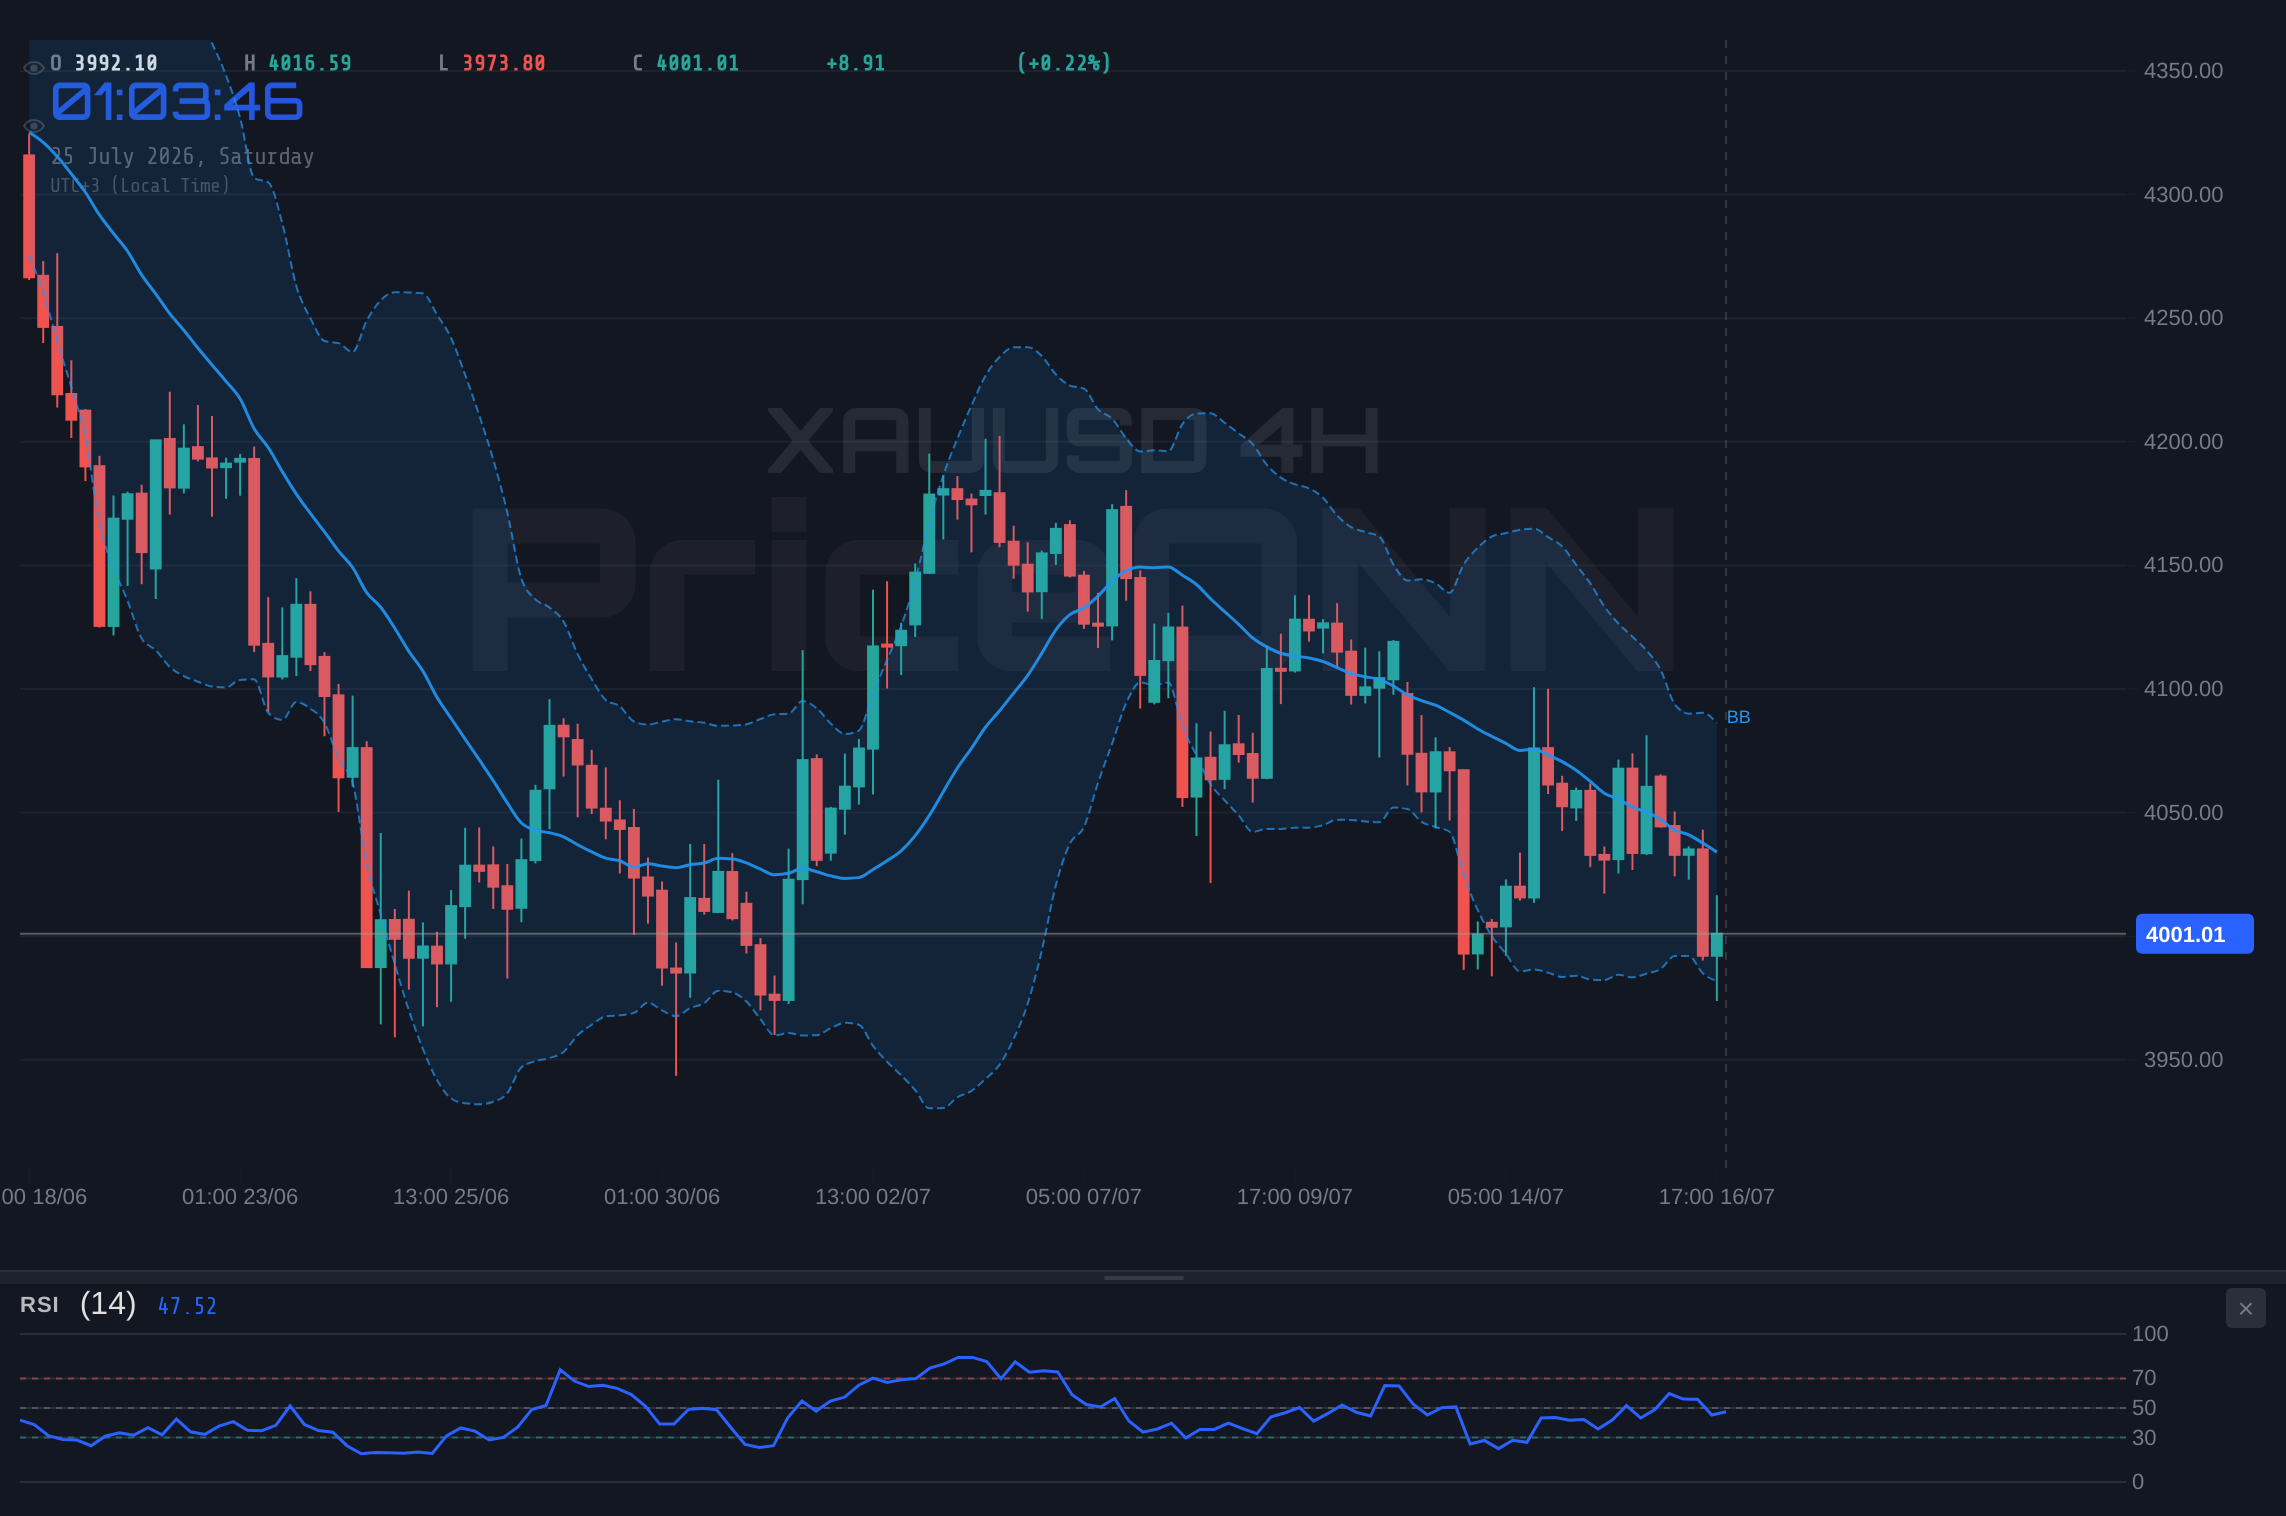
The longer-term outlook, however, presents a more daunting challenge for the bulls. The 4-hour chart shows a strong downtrend (83% strength) with resistance capping advances at $4,026.74, $4,061.38, and $4,079.66. Here, the RSI at 40.59 and Stochastic showing a bearish cross (%K
Where Bears Take Control: The Downside Scenario
The bearish scenario for XAUUSD appears to be the most probable, given the current technical and fundamental backdrop. The immediate price level of $4,001.21 is crucial. A decisive close below the 1-hour support at $3,991.8 would be the first confirmation of further downside. This could trigger a cascade towards the next support at $3,976.78, and potentially the more significant 4-hour support level at $3,973.82. The prevailing negative momentum across most indicators, particularly the MACD and Stochastic on the 4-hour and daily charts, strongly supports this view. The 4-hour chart's 'Sell' signal (0 Buy, 8 Sell, 0 Neutral) is particularly telling, indicating a broad consensus among technical indicators for further declines. The daily trend strength of 95% further solidifies the bearish outlook. If gold breaks below $3,973.82, the psychological level of $3,950 would likely come into focus, followed by the 4-hour support at $3,955.54.
From a fundamental perspective, several factors are contributing to the bearish pressure on gold. The strengthening US Dollar Index (DXY), currently at 100.7, is a major impediment. As the DXY rises, gold typically faces selling pressure due to increased import costs for non-dollar-denominated buyers and a general shift towards dollar-denominated assets. Recent news indicates that oil prices are also a significant factor, with Brent crude rallying near $100 and WTI at $79.59. This surge in oil prices, while often seen as an inflation hedge that benefits gold, is also fueling broader market repricing and concerns about central banks needing to maintain higher interest rates for longer. The recent breaking news highlights this tension: "Dollar and Yield Surge as Brent Near $100 Sparks Broader Market Repricing." This suggests that the market is prioritizing the inflation-driving aspect of oil and the Fed's potential response over gold's traditional safe-haven appeal. If this narrative continues, gold could see further downside pressure, with the daily support at $3,960.65 becoming a key target.
The Waiting Game: A Consolidation Phase?
While the dominant trend appears bearish, a period of consolidation or range-bound trading cannot be entirely ruled out, especially if market participants adopt a wait-and-see approach ahead of key economic data or central bank pronouncements. This neutral scenario would typically involve gold oscillating between the immediate support and resistance levels identified. On the 1-hour chart, this range is roughly between $3,976.78 and $4,019.21. Within this range, traders might look for short-term opportunities, but the lack of clear directional conviction would make it a choppy environment. The 1-hour chart's ADX at 20.26, while indicating a downtrend, is not exceptionally high, suggesting that the trend might lack sustained momentum. Similarly, the 4-hour ADX at 15.79 points to a weak trend, often characteristic of consolidation periods. For this scenario to play out, we would need to see a failure of bears to push decisively below $3,973.82 and a consistent rejection of prices above $4,026.74 on the 4-hour chart.
This consolidation phase could be triggered by anticipation of major economic events. For instance, upcoming central bank decisions, such as those from the Fed, BoE, and BoJ, are highlighted in recent news: "Week Ahead – Fed, BoE and BoJ Face Inflation Test as Markets Reprice Interest Rate Paths." If these events introduce significant uncertainty or conflicting signals, traders might reduce exposure, leading to a period of sideways movement. The daily RSI at 38.86 also suggests room for both upward and downward movement before hitting extreme levels, allowing for a broader trading range. However, given the strong daily trend strength (95%) and the bearish signals across most longer-term indicators, a prolonged consolidation phase seems less likely than a continuation of the current downtrend. If gold remains range-bound, traders will be closely watching for any signs of trend exhaustion or a decisive breakout catalyst.
Probability Assessment: Where the Smart Money Might Be Leaning
Assessing the probabilities, the current technical and fundamental landscape heavily favors the bearish scenario for XAUUSD in the short to medium term. The confluence of a strengthening dollar (DXY at 100.7), rising oil prices exacerbating inflation fears (Brent near $100), and the prevailing bearish technicals across multiple timeframes (strong downtrends on 4H and 1D charts, overall 'Sell' signals) points towards further downside. I would assign a probability of approximately 60-65% to the bearish scenario. The neutral or consolidation scenario likely holds a 25-30% probability, contingent on market participants waiting for major economic data releases or geopolitical shifts. The bullish scenario, while always possible, currently appears the least probable, perhaps around 10-15%, requiring a significant catalyst to overcome the strong technical resistance and negative momentum.
The primary driver underpinning the bearish outlook is the interplay between inflation, interest rates, and currency strength. As oil prices surge, central banks, particularly the Federal Reserve, are likely to maintain a hawkish stance or even consider further rate hikes to combat persistent inflation. This expectation supports the dollar, which in turn puts pressure on gold. The recent news that "Dollar and Yield Surge as Brent Near $100 Sparks Broader Market Repricing" perfectly encapsulates this dynamic. Investors might be rotating out of gold and into dollar-denominated assets or higher-yielding bonds as rate hike expectations firm up. Until these macroeconomic conditions shift significantly - perhaps through a sudden easing of geopolitical tensions, a surprise dovish turn from the Fed, or a clear signal that inflation is peaking - the path of least resistance for gold appears to be downwards. The key is to watch for confirmation signals and avoid trying to catch a falling knife.
What I'm Watching This Week: Key Triggers for XAUUSD
To navigate the current market chop and identify potential shifts in the XAUUSD's trajectory, several key triggers and levels are essential to monitor closely. Firstly, the immediate price action around the $4,001.21 level is critical. A decisive break and sustained close below the 1-hour support at $3,991.8 would solidify the bearish case, potentially opening the door for a move towards $3,976.78. Secondly, the strength and direction of the US Dollar Index (DXY) will be paramount. Any significant move in the DXY, especially in response to upcoming economic data or Fed commentary, will likely have an inverse impact on gold prices. Watching how gold reacts to DXY movements around the 100.7 level will be crucial. Thirdly, market sentiment towards inflation and interest rate expectations needs constant monitoring. Upcoming economic releases, such as PMI data or speeches from central bank officials, could provide the catalyst needed to break gold out of its current range or confirm the prevailing downtrend. Traders should remain vigilant and prepared to adjust their strategies based on these evolving factors.
The Bear's Path: Targeting Sub-$3,950 Levels
The bearish scenario hinges on gold decisively breaking key support levels. The first line of defense, the 1-hour support at $3,991.8, is already being tested. A failure to hold here would likely see prices rapidly descend towards the 4-hour support at $3,973.82. If this level also gives way, the psychological barrier of $3,950 would come into play, with the next significant support identified at $3,955.54 on the 4-hour timeframe. The daily support at $3,960.65 also aligns with this potential downside target zone. The invalidation for this bearish outlook would be a strong daily close back above the $4,046.62 resistance level, suggesting a significant shift in market sentiment or a successful bull trap.
The Bull's Counter-Attack: A Rally Above $4,046?
For the bulls to stage a comeback, a sustained push above immediate resistance is required. The trigger would be a clear break and hold above the 1-hour resistance at $4,019.21, followed by conquering the $4,031.6 level. The ultimate test would be breaching the $4,046.62 resistance. If this occurs with conviction, targets could extend towards the 4-hour resistance at $4,061.38 and potentially the daily resistance at $4,088.69. The invalidation for this bullish scenario would be a close back below the $3,991.8 support level, indicating that the attempted rally was merely a bear market correction.
Consolidation Zone: Stuck Between $3,973 and $4,026
A neutral scenario would see XAUUSD trading within a defined range, likely between the 4-hour support of $3,973.82 and the 4-hour resistance of $4,026.74. This would occur if neither the bulls nor the bears can gain decisive control, possibly due to market indecision ahead of key economic events or a lack of strong directional catalysts. The trigger for this phase would be the failure of price to decisively break either the immediate support or resistance. Invalidation would occur if price breaks decisively out of this range in either direction, signaling a resumption of the trend.
The Bear's Grip: Downside Targets Beckon
65% ProbabilityThe Waiting Game: Range-Bound Trading
25% ProbabilityBullish Reversal: A Push Towards $4,088
10% ProbabilityFrequently Asked Questions: XAUUSD Analysis
What happens if XAUUSD breaks below the $3,991.8 support level?
A break below $3,991.8 on the 1-hour chart would likely trigger further selling pressure, potentially targeting the $3,973.82 support level on the 4-hour chart. This would confirm the bearish scenario, especially if accompanied by negative momentum across indicators.
Should I buy gold at current levels around $4,001.21 given the RSI is at 37.81?
Buying at current levels is risky given the prevailing bearish sentiment and the RSI's position below 40, suggesting downward momentum. While a short-term bounce is possible, a confirmed bullish signal, such as a break above $4,019.21 resistance with positive MACD divergence, would be a more prudent entry condition.
Is the ADX at 20.26 a sell signal for XAUUSD on the 1-hour chart?
An ADX reading of 20.26 indicates a mid-strength downtrend, which aligns with the bearish outlook. While not an outright sell signal on its own, it confirms that the current downward move has some substance and isn't just noise, reinforcing caution for any bullish positions.
How will the rising DXY at 100.7 affect XAUUSD this week?
The strengthening US Dollar Index (DXY) at 100.7 typically exerts downward pressure on gold, as seen in the current price action. If the DXY continues to climb, driven by hawkish Fed expectations or risk aversion, gold is likely to face further headwinds, potentially pushing it towards lower support levels.
Track markets in real-time
AI-powered analysis, technical indicators and real-time price data.
Join Our Telegram Channel
Breaking market news, AI analysis and trading signals instantly.
Join Channel