

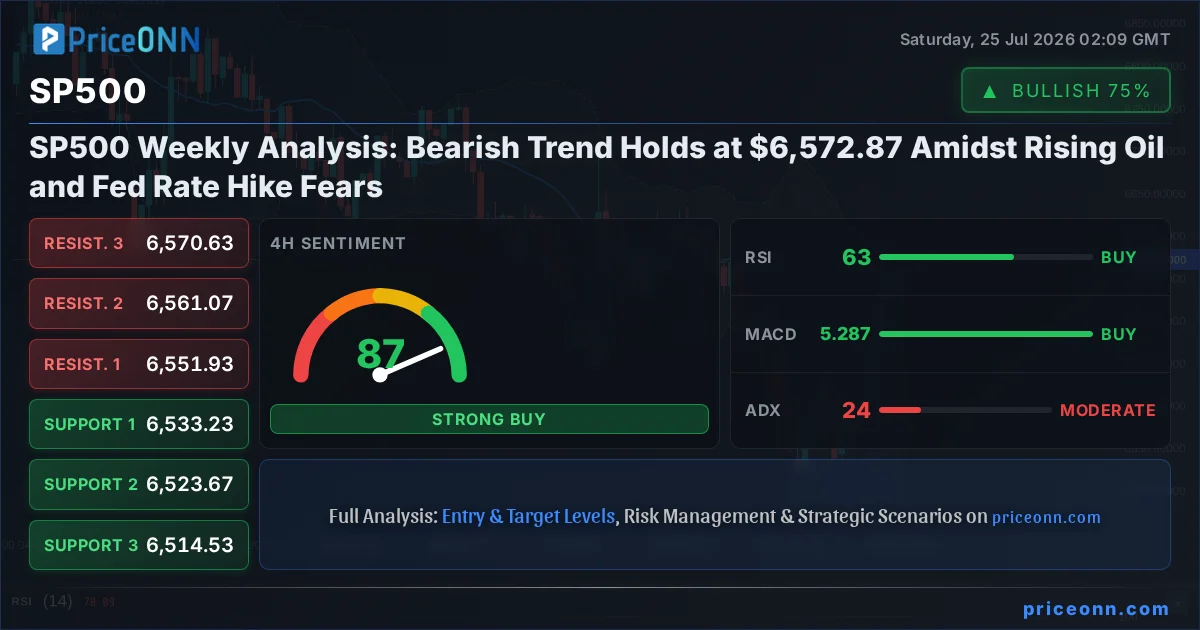
The S&P 500 index, a key barometer of US equity market health, ended last week trading around $6,572.87, firmly entrenched in a bearish trend. This downturn comes as a confluence of factors, including persistent inflation concerns driven by soaring oil prices and the looming specter of further interest rate hikes from the Federal Reserve, cast a long shadow over investor sentiment. The correlation between the Dollar Index (DXY), oil prices, and major equity indices like the SP500 and Nasdaq has become increasingly pronounced, creating a complex risk environment. As traders brace for another week of potential volatility, understanding these intermarket dynamics is crucial for navigating the choppy waters ahead.
- The SP500 closed the week at $6,572.87, signaling a continuation of the bearish trend.
- RSI at 45.35 on the daily chart indicates weakening momentum but remains above oversold territory.
- Critical support is observed at $6,377.47, a level that has held through previous market stresses.
- The correlation with a strengthening DXY (currently 100.7) suggests headwinds for risk assets.
- Rising Brent crude prices above $83.79 are fueling inflation fears, potentially forcing the Fed's hand.
Navigating the Headwinds: SP500's Downturn and Macroeconomic Pressures
The past week saw the S&P 500 grapple with significant downward pressure, ultimately closing near $6,572.87. This decline wasn't a singular event but rather a culmination of several macroeconomic and geopolitical forces. The most prominent among these has been the relentless surge in oil prices, with Brent crude climbing back above the $83.79 mark. This rise in energy costs has reignited inflation concerns, creating a challenging environment for central banks, particularly the US Federal Reserve. The specter of continued or even accelerated interest rate hikes looms large, threatening to dampen economic growth and corporate earnings, thereby weighing on equity valuations.
The correlation between the Dollar Index (DXY) and risk assets like the SP500 has been a critical theme. As the DXY strengthened to 100.7, it exerted downward pressure on global equities and commodities, including gold. This inverse relationship highlights a broader risk-off sentiment pervading the markets. Investors are increasingly seeking the perceived safety of the US dollar amidst geopolitical uncertainties and the potential for a global economic slowdown. This dynamic creates a challenging backdrop for the SP500, as a stronger dollar can make US exports more expensive and reduce the repatriated earnings of multinational corporations.
Furthermore, the Nasdaq index, often seen as a proxy for growth stocks, has also experienced a notable downturn, closing the week around 29,164.86. This weakness in tech-heavy indices reflects a broader rotation out of riskier assets. The market is currently repricing interest rate paths, with traders factoring in a higher probability of sustained higher rates for longer. This shift in expectations can have a significant impact on stock valuations, particularly for companies whose future earnings are discounted more heavily in a higher interest rate environment. The interplay between inflation, central bank policy, and market sentiment is creating a complex puzzle for investors trying to decipher the next move for the SP500.
Looking at the broader economic calendar, the upcoming week promises to be pivotal. With key inflation data and central bank commentary on the horizon, particularly from the Federal Reserve, the market is poised for potential fireworks. The Fed's stance on inflation and its commitment to its monetary policy path will be closely scrutinized. Any hints of a more hawkish tone could further pressure the SP500, while signs of a potential pivot or pause could offer some relief. The current price action around $6,572.87 suggests that the market is pricing in a degree of caution, awaiting clearer signals.
Technical Underpinnings: Decoding SP500's Chart Patterns
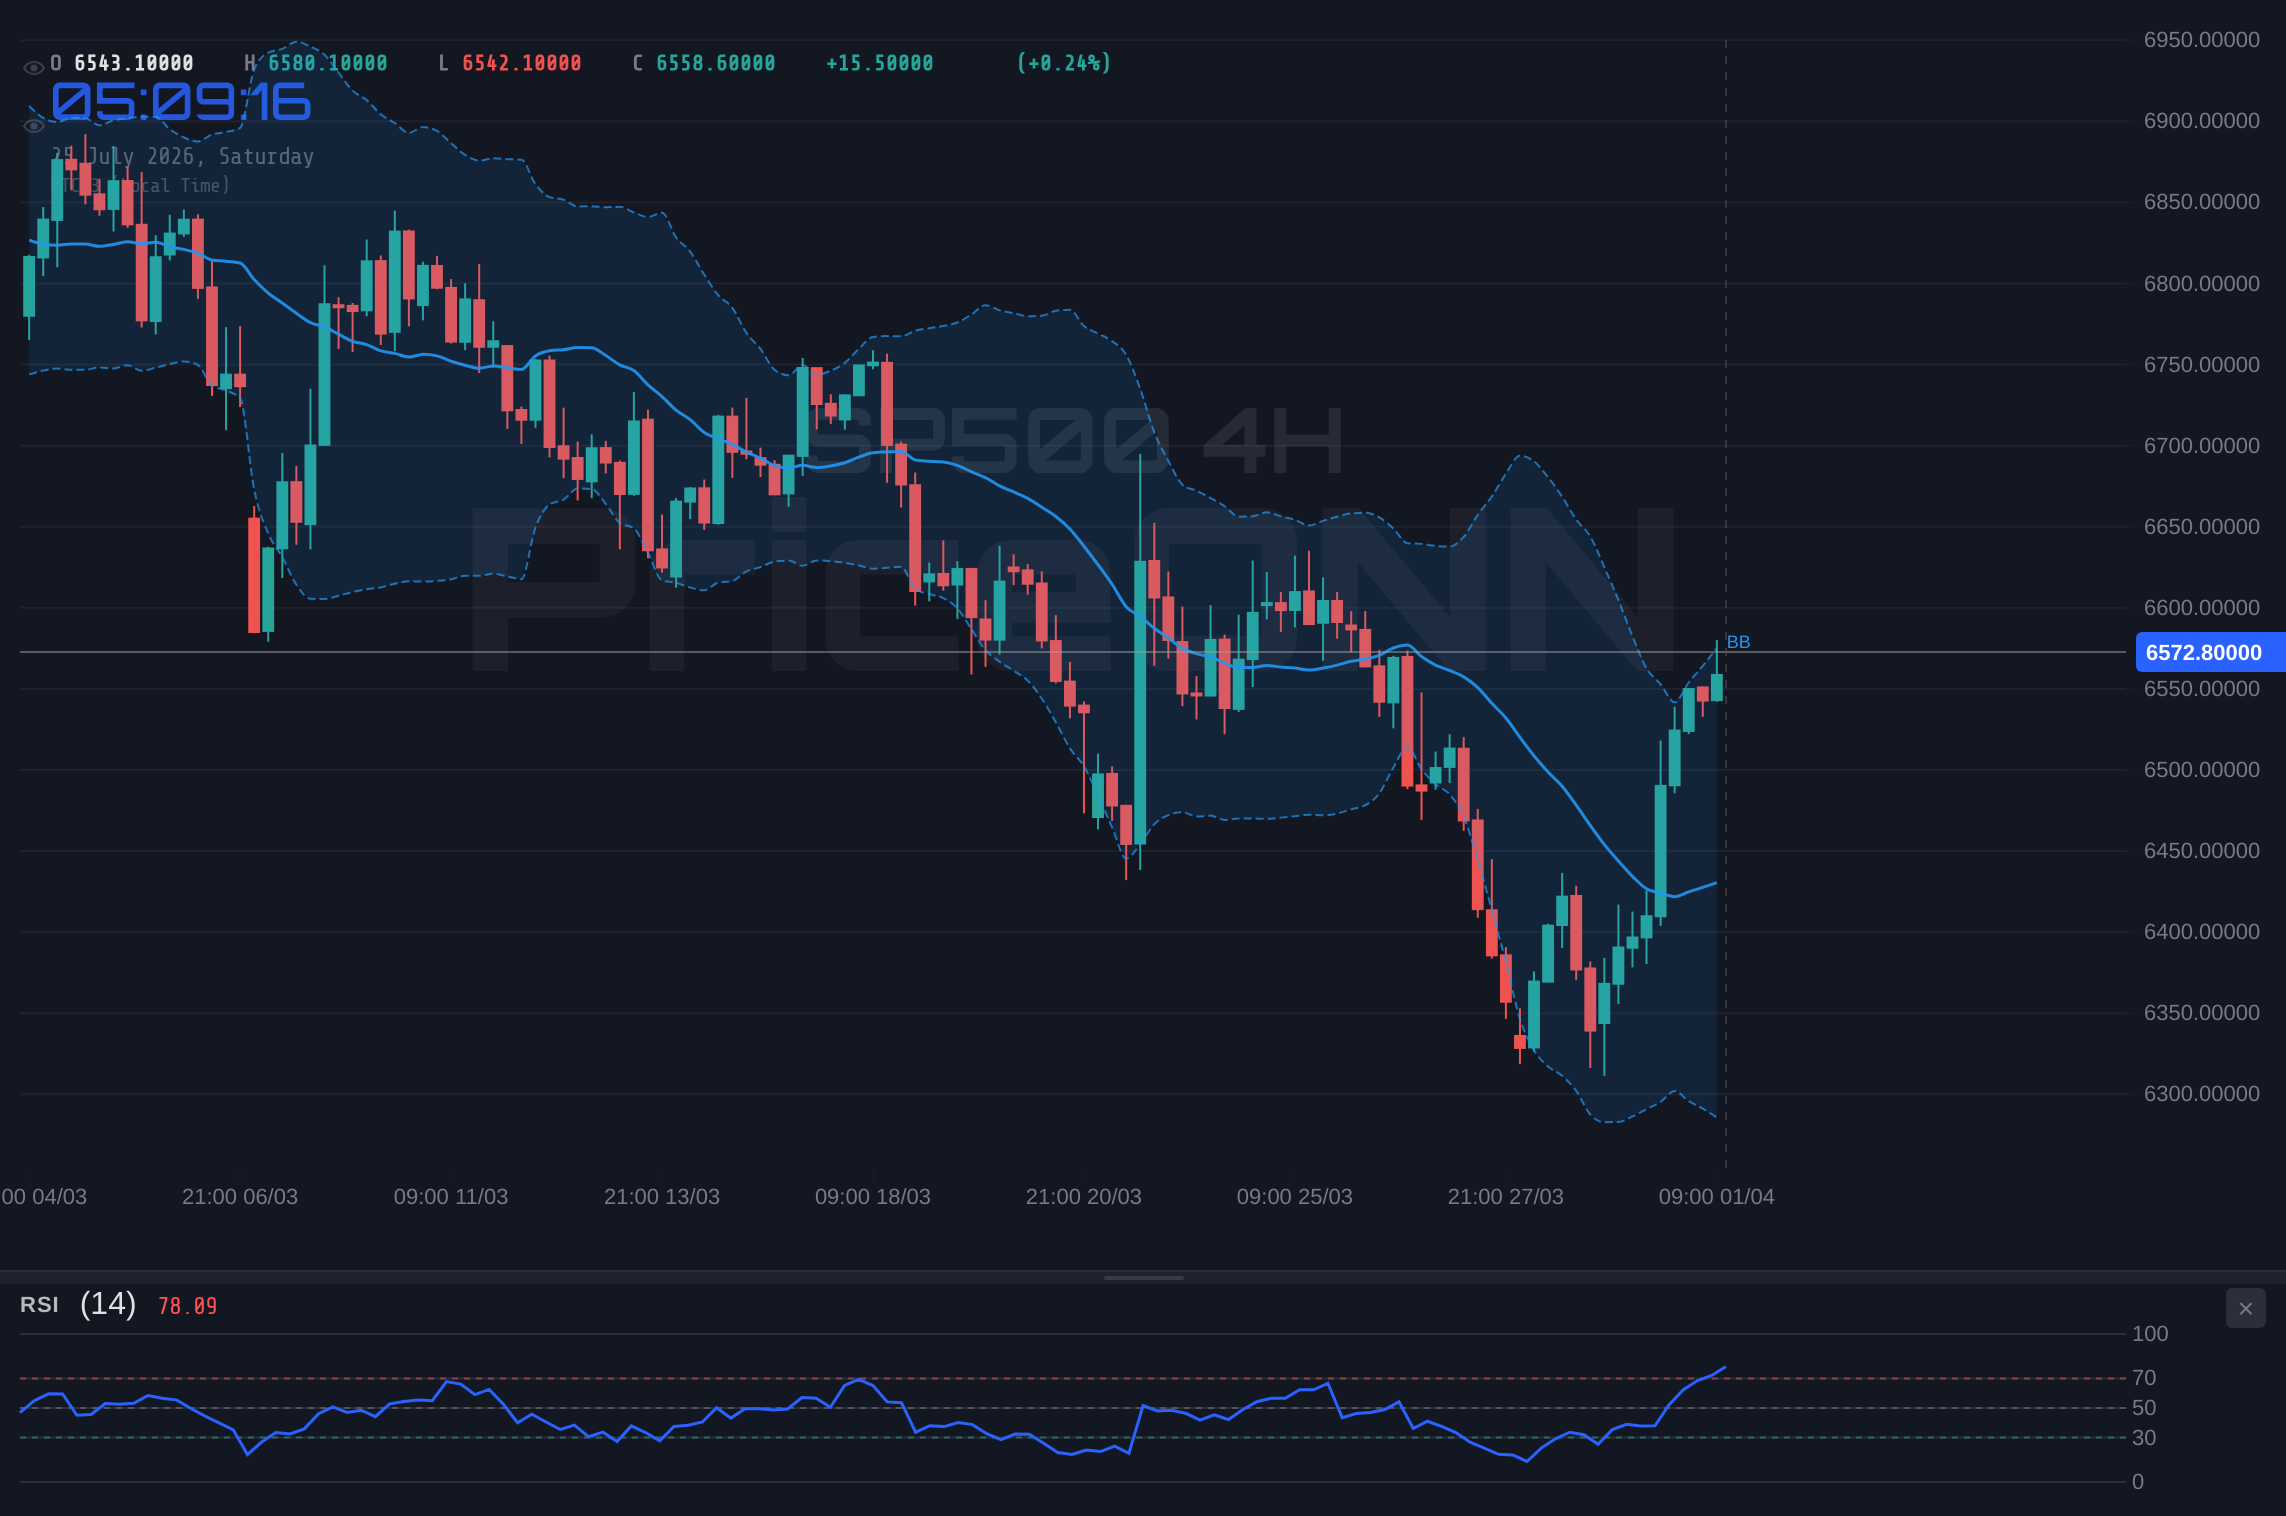
From a technical perspective, the SP500's daily chart paints a picture of a market under pressure. The index closed the week at $6,572.87, with its RSI(14) standing at 45.35. While this reading is firmly in the neutral territory, it leans towards the lower end, suggesting that while oversold conditions haven't been reached, the selling pressure has been significant. The downward trend in RSI indicates that bullish momentum is waning, and any rallies might face selling pressure as the index approaches key resistance levels.
The MACD indicator further supports the bearish narrative. On the daily timeframe, the MACD is showing negative momentum, with the MACD line positioned below its signal line. This configuration typically signals that the bears are gaining the upper hand and that downward price action is more likely in the short to medium term. The fact that this negative momentum persists even as the index hovers around $6,572.87 suggests that the underlying trend remains predominantly bearish. Traders often look for confirmation from other indicators before making significant moves, but the MACD's current reading is a clear warning sign.
Bollinger Bands also provide insight into the current market structure. The SP500 is trading below the middle band on the daily chart, indicating a bearish bias. This placement suggests that the price is currently in the lower half of its recent trading range, and a break below the lower band could signal further downside. The ADX, measuring trend strength, is at 47.51 on the daily chart, which signifies a strong downward trend. This high ADX value indicates that the current market move is not just a minor fluctuation but a well-established bearish trend, demanding caution from those looking to enter long positions.
The Stochastic Oscillator, however, presents a slightly different picture on the daily chart, with K at 42.97 and D at 29.88, showing a potential for a bullish crossover as %K is above %D. This divergence between the Stochastic and other indicators like RSI and MACD warrants attention. While the overall trend remains bearish, this Stochastic reading might suggest a potential for a short-term bounce or a period of consolidation before the next major move. However, given the strong bearish signals from ADX and MACD, any such bounce might be an opportunity for sellers to re-enter the market rather than the start of a sustained recovery.
On the 1-hour and 4-hour charts, the technical signals continue to lean bearish, albeit with some nuances. The 1H chart shows RSI at 32.77 and MACD with negative momentum, reinforcing the short-term selling pressure. The ADX at 33.23 on the 1H timeframe also points to a strong downtrend. The 4H chart echoes this sentiment with RSI at 39.92 and negative MACD momentum. The ADX on the 4H is 21.06, indicating a moderate downtrend. The confluence of these indicators across multiple timeframes suggests that the path of least resistance for the SP500 remains to the downside in the immediate future, with key support levels being closely watched.
Intermarket Analysis: The Dollar, Oil, and the SP500's Dance
The intricate relationship between the US Dollar Index (DXY), oil prices, and the SP500 is a defining characteristic of the current market environment. Last week, the DXY climbed to 100.7, reflecting a strengthening US dollar. This move typically correlates inversely with the SP500, as a stronger dollar can pose challenges for US corporate earnings and increase the cost of commodities priced in dollars. The current reading of the DXY suggests continued pressure on risk assets.
Simultaneously, oil prices have been on an upward trajectory, with Brent crude trading around $83.79. This surge is largely driven by geopolitical tensions in the Middle East and supply concerns. Higher oil prices translate directly into higher energy costs for consumers and businesses, fueling inflation expectations. This inflationary pressure is a significant concern for the Federal Reserve, which has been striving to bring inflation back to its target. The current oil price levels suggest that inflationary forces remain potent, potentially forcing the Fed to maintain a hawkish stance or even consider further rate hikes. This, in turn, weighs heavily on the SP500.
The Nasdaq 100 index, highly sensitive to interest rate expectations and growth prospects, has also shown weakness, closing around 29,164.86. Its correlation with the SP500 is usually high, and its recent decline reinforces the bearish sentiment across the broader equity market. The tech-heavy nature of the Nasdaq makes it particularly vulnerable to rising interest rates, as the present value of future earnings is discounted more steeply. The interconnectedness of these markets means that a negative development in one can quickly spill over into others, creating a domino effect.
The correlation analysis underscores the importance of monitoring these key markets. When the DXY strengthens and oil prices rise, it often signals a risk-off environment where investors prioritize capital preservation over growth. This environment is generally unfavorable for equities like the SP500. The 47.51 ADX on the SP500's daily chart confirms the strength of the current downtrend, suggesting that these macro pressures are translating into sustained price action. Understanding these intermarket linkages is paramount for any trader attempting to forecast the SP500's direction.
The implications of these correlations are profound. A sustained rise in the DXY could continue to cap any potential rallies in the SP500, while persistent high oil prices could force the Fed into more aggressive tightening, further dampening economic activity. The market is in a delicate balancing act, trying to digest these competing forces. The $6,572.87 level for the SP500 is therefore not just a technical point but a reflection of these complex underlying macroeconomic conditions.
Fundamental Drivers: Inflation, Fed Policy, and Geopolitical Undercurrents
The fundamental landscape remains a significant headwind for the SP500. The primary driver of concern is inflation, largely exacerbated by the recent surge in oil prices. Brent crude trading near $83.79 is a stark reminder of the inflationary pressures that continue to plague the global economy. This persistent inflation complicates the Federal Reserve's policy decisions. While the Fed has been working to curb inflation, the current energy price environment makes its task increasingly difficult.
Market participants are closely watching the Federal Reserve for any signals regarding future monetary policy. The latest Fed minutes and commentary from Fed officials have suggested a cautious approach, emphasizing the need to bring inflation back to the 2% target. While the market has largely priced in a pause in rate hikes for the upcoming meeting, the possibility of further hikes later in the year remains on the table, especially if inflation data continues to surprise to the upside. The CME FedWatch tool, if available, would provide precise probabilities for future rate moves, but the general sentiment suggests a higher-for-longer interest rate scenario.
Geopolitical risks also continue to play a significant role in market sentiment. Tensions in the Middle East, coupled with ongoing trade disputes and the reverberations of the conflict in Eastern Europe, contribute to global uncertainty. These factors often lead to a flight to safety, benefiting assets like the US dollar and potentially Treasuries, while pressuring riskier assets like equities. The 100.7 level for the DXY reflects this demand for safe-haven assets. This geopolitical backdrop adds another layer of complexity to the SP500's outlook, making it susceptible to sudden shocks.
The interplay between these fundamental factors - inflation, Fed policy, and geopolitical risks - creates a challenging environment for the SP500. The index's current position at $6,572.87 reflects this uncertainty. Investors are weighing the potential for corporate earnings to withstand higher borrowing costs against the backdrop of slowing economic growth and persistent inflation. The resilience of the US economy and the Fed's ability to navigate this complex landscape without triggering a severe recession will be key determinants of the SP500's future direction.
The impact of these factors extends beyond the SP500. The EURUSD pair, for instance, is sensitive to the interest rate differential between the US and Europe, as well as the impact of oil prices on the Eurozone economy. Similarly, USDJPY is influenced by the Fed's policy stance and broader risk sentiment. The current environment, characterized by rising oil prices and a strong dollar, creates a ripple effect across global markets, making a comprehensive understanding of these macro drivers essential for any serious market analysis.
Trading Scenarios and Outlook for the SP500
Given the current technical and fundamental backdrop, several trading scenarios are plausible for the SP500. The index is currently trading around $6,572.87, with key support levels identified at $6,377.47, $6,230.63, and $6,149.87. Resistance is faced at $6,605.07, $6,685.83, and $6,832.67. The prevailing bearish trend, supported by indicators like the daily ADX at 47.51, suggests that downside risks are more pronounced.
Bearish Scenario: Trend Continuation
65% ProbabilityNeutral Scenario: Consolidation and Range-Bound Trading
25% ProbabilityBullish Scenario: Short-Term Rebound
10% ProbabilityThe bearish scenario appears most probable given the current technical indicators and the prevailing macroeconomic climate. The strong ADX reading of 47.51 on the daily chart suggests that the downtrend has momentum. A break below the $6,523.67 level on the 4-hour chart would likely confirm the continuation of the bearish trend, potentially leading to tests of $6,377.47 and even $6,230.63. The RSI at 45.35 on the daily chart leaves room for further downside before reaching oversold territory.
A neutral scenario involving consolidation within a defined range between $6,523.67 and $6,605.07 is also possible, particularly if upcoming economic data provides mixed signals or if the market enters a period of consolidation ahead of key events. However, the strong trend strength indicated by the ADX suggests that ranging markets might be temporary.
The bullish scenario, with a 10% probability, would require a significant shift in market sentiment or a stronger-than-expected bullish technical setup, such as a clear bullish divergence on lower timeframes combined with a hold of critical support at $6,377.47. Even in this scenario, the immediate targets would be the resistance levels at $6,605.07 and $6,685.83, which represent the boundaries of the current bearish structure.
Risk management is paramount in this environment. Traders should be prepared for potential whipsaws and increased volatility. The $6,572.87 level serves as a crucial pivot point, with a break below it reinforcing the bearish outlook and a sustained move above $6,605.07 potentially signaling a short-term reprieve. Given the ongoing macroeconomic pressures and the strong bearish technical signals, a cautious approach is warranted.
Market Correlation Deep Dive: DXY, Oil, and SP500 Interplay
The current market narrative is heavily influenced by the interplay between the US Dollar Index (DXY), oil prices, and the SP500. As of the latest data, the DXY is trading at 100.7, indicating a robust dollar. Historically, a stronger dollar often correlates inversely with the SP500, as it can make US exports more expensive and reduce the value of foreign earnings when repatriated. This dynamic suggests that the current dollar strength is a headwind for US equities.
Simultaneously, Brent crude oil is hovering around $83.79, a level that signals persistent inflationary pressures. Rising oil prices directly impact inflation expectations, potentially forcing central banks, including the Federal Reserve, to maintain a hawkish monetary policy stance. This can lead to higher borrowing costs, which in turn can dampen economic growth and corporate profitability, thereby negatively affecting the SP500. The market is sensitive to any news that could impact oil supply or demand, making the geopolitical landscape a critical factor to monitor.
The Nasdaq 100 index, currently at 29,164.86, has also experienced significant selling pressure, reflecting a broader risk-off sentiment. Its high correlation with the SP500 means that weakness in the Nasdaq often foreshadows or accompanies weakness in the broader market. The divergence between the strong performance of some indices and the weakness in others highlights the selective nature of market movements, but the overall trend for major US equity benchmarks appears cautious.
The 47.51 ADX reading on the SP500's daily chart underscores the strength of the prevailing downtrend. This suggests that the macroeconomic factors, including the strong dollar and high oil prices, are translating into sustained price action. Traders are closely watching for confluence between these intermarket signals. For instance, a continued rise in the DXY coupled with elevated oil prices would likely reinforce the bearish outlook for the SP500, while any signs of dollar weakness or easing oil prices could provide a reprieve.
Understanding these correlations is not just an academic exercise; it provides actionable insights. If the DXY continues its ascent, traders might anticipate further pressure on the SP500, potentially looking for shorting opportunities on rallies towards resistance levels like $6,605.07. Conversely, any significant pullback in the DXY or a notable drop in oil prices could signal a shift in risk sentiment, prompting a re-evaluation of long positions. The current price of $6,572.87 for the SP500 is a snapshot in time, heavily influenced by these broader market forces.
Fed Policy and Inflation: The Crux of the SP500's Dilemma
The Federal Reserve's policy decisions remain at the forefront of market concerns, directly impacting the SP500's trajectory. With inflation showing signs of persistence, largely fueled by the surge in oil prices to around $83.79 for Brent crude, the Fed faces a delicate balancing act. The central bank's mandate is to achieve price stability and maximum employment, and the current inflationary environment presents a significant challenge to this objective.
Market expectations are crucial here. While the market may have priced in a pause in rate hikes for the upcoming Fed meeting, the commentary from Fed officials and the upcoming inflation data releases will be key. Any indication that the Fed might consider further rate increases to combat inflation could spook equity markets, including the SP500. The potential for a higher-for-longer interest rate environment increases the cost of capital for businesses, potentially leading to slower growth and reduced corporate earnings. This is a significant headwind for equity valuations.
Geopolitical tensions in regions like the Middle East also contribute to the uncertainty surrounding oil prices and, consequently, inflation. Supply disruptions or escalations in conflict could send oil prices even higher, further complicating the Fed's task. The strong performance of the DXY, currently at 100.7, reflects this global uncertainty and the demand for safe-haven assets. This robust dollar can also put pressure on emerging markets and global growth, indirectly affecting the US economy and the SP500.
The technical picture, with the SP500 trading near $6,572.87 and showing bearish signals like a daily ADX of 47.51 and RSI at 45.35, suggests that the market is already pricing in some of these risks. However, a significant shift in Fed policy expectations or a sudden escalation of geopolitical events could lead to sharp market movements. Investors are keenly awaiting upcoming economic data releases, such as CPI and employment figures, to gauge the true extent of inflationary pressures and the Fed's likely response.
The current price action around $6,572.87 is a reflection of this ongoing tug-of-war between economic growth concerns, inflationary pressures, and central bank policy responses. The path forward for the SP500 will largely depend on how these fundamental factors evolve and how effectively the Fed manages its monetary policy to achieve its inflation targets without triggering a significant economic downturn.
Navigating Volatility: Risk Management and Trader Strategies
In the current market climate, characterized by elevated volatility and uncertainty surrounding inflation, Fed policy, and geopolitical events, robust risk management is paramount for traders. The SP500's position near $6,572.87, coupled with strong bearish technical signals like the daily ADX at 47.51, suggests that caution is the prudent approach. Traders should be prepared for potential sharp moves in either direction, especially around key economic data releases and central bank announcements.
For short-term traders, the focus might be on identifying opportunities within the established bearish trend. The 1H chart shows RSI at 32.77 and negative MACD momentum, supporting the idea of playing the downside. Key levels to watch on the downside include $6,523.67, $6,377.47, and $6,230.63. A break below $6,523.67 could be a trigger for short positions, targeting the aforementioned support levels. However, traders must remain vigilant for potential bear traps or short-covering rallies, especially near significant support zones.
For swing traders or those with a longer time horizon, the current environment might present an opportunity for more strategic positioning. The bearish trend suggests that rallies might be opportunities to enter short positions or to accumulate defensive assets. The resistance levels at $6,605.07 and $6,685.83 could serve as potential targets for short-sellers looking to fade rallies. The 45.35 daily RSI reading indicates that there is still room for the index to decline before reaching oversold territory.
Long-term investors might view the current downturn as a potential opportunity to re-evaluate their portfolios and look for value. However, given the persistent inflation concerns, the hawkish Fed stance, and geopolitical uncertainties, a cautious approach is still advisable. Dollar-cost averaging into positions or focusing on fundamentally strong companies with robust balance sheets could be strategies to consider. The $6,377.47 support level is a critical area to watch for any signs of a potential bottoming formation.
Ultimately, success in this market hinges on disciplined execution and risk management. Sticking to predefined stop-loss levels, managing position sizes appropriately, and avoiding emotional trading are crucial. The market always presents opportunities, but patience and discipline are key. The $6,572.87 level is a critical juncture, and the actions taken by traders and investors in response to price movements around this level will shape the near-term outlook for the SP500.
| Indicator | Value | Signal | Interpretation |
|---|---|---|---|
| RSI (14) | 45.35 | Neutral | Leaning towards bearish momentum, room for further decline. |
| MACD Histogram | -15.20 | Bearish | Negative momentum persists, indicating seller control. |
| Stochastic | 42.97 / 29.88 | Bullish Crossover | Potential for short-term bounce or consolidation, but against overall trend. |
| ADX | 47.51 | Strong Downtrend | Confirms a robust bearish trend is in place. |
| Bollinger Bands | Middle Band | Below Band | Price below average, indicating bearish pressure. |
Frequently Asked Questions: SP500 Analysis
What happens if SP500 breaks below the critical support at $6,377.47?
A break below $6,377.47 would invalidate the current consolidation pattern and likely accelerate the bearish trend, potentially targeting the $6,230.63 level. This would signal a deeper market correction driven by persistent inflation fears and hawkish Fed expectations.
Should I consider buying SP500 at current levels of $6,572.87 given the mixed Stochastic signal?
Buying at $6,572.87 carries significant risk due to the dominant bearish trend confirmed by ADX 47.51. While the Stochastic shows a potential for a short-term bounce, it's against the larger trend. A more prudent approach might be to wait for confirmation of a bullish reversal or for price to retest a stronger support level like $6,377.47.
Is the RSI at 45.35 a sell signal for SP500 right now?
An RSI of 45.35 is not an outright sell signal but indicates bearish momentum is present and there is room for further downside. It suggests that sellers are in control, and any rallies might face resistance. Confirmation from other indicators like MACD and ADX supports a cautious outlook for the SP500.
How will rising oil prices above $83.79 affect the SP500 this week?
Rising oil prices above $83.79 intensify inflation concerns, potentially forcing the Fed to maintain or increase interest rates. This macroeconomic pressure typically weighs on equity markets like the SP500, increasing the probability of further declines as risk aversion grows and the DXY strengthens.
Track markets in real-time
AI-powered analysis, technical indicators and real-time price data.
Join Our Telegram Channel
Breaking market news, AI analysis and trading signals instantly.
Join Channel