

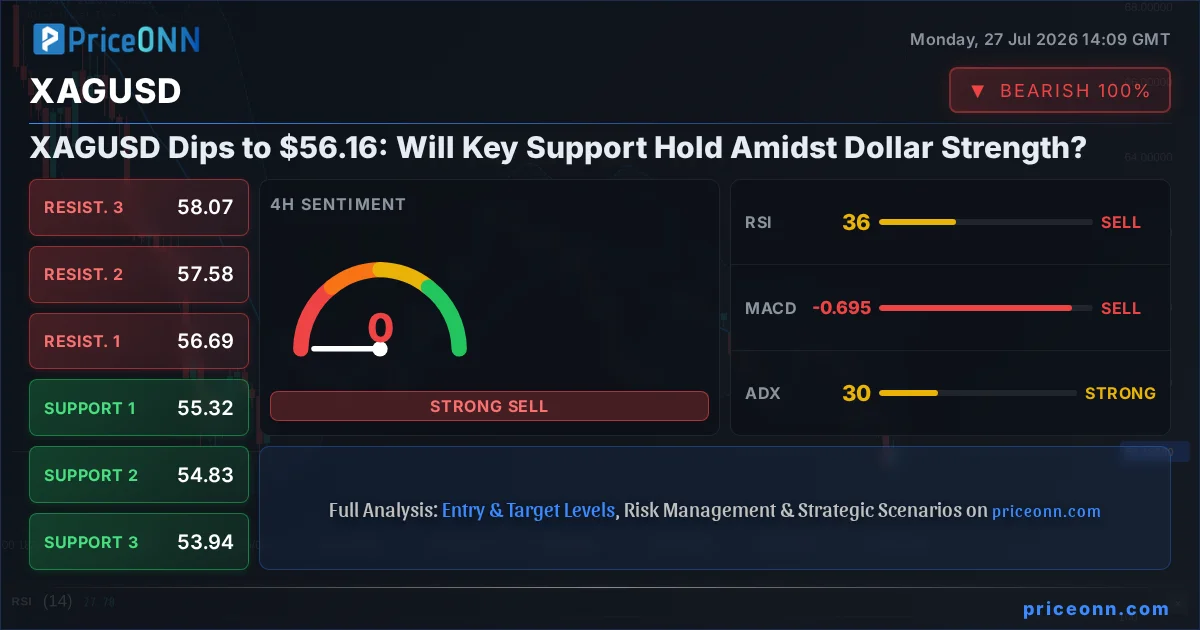
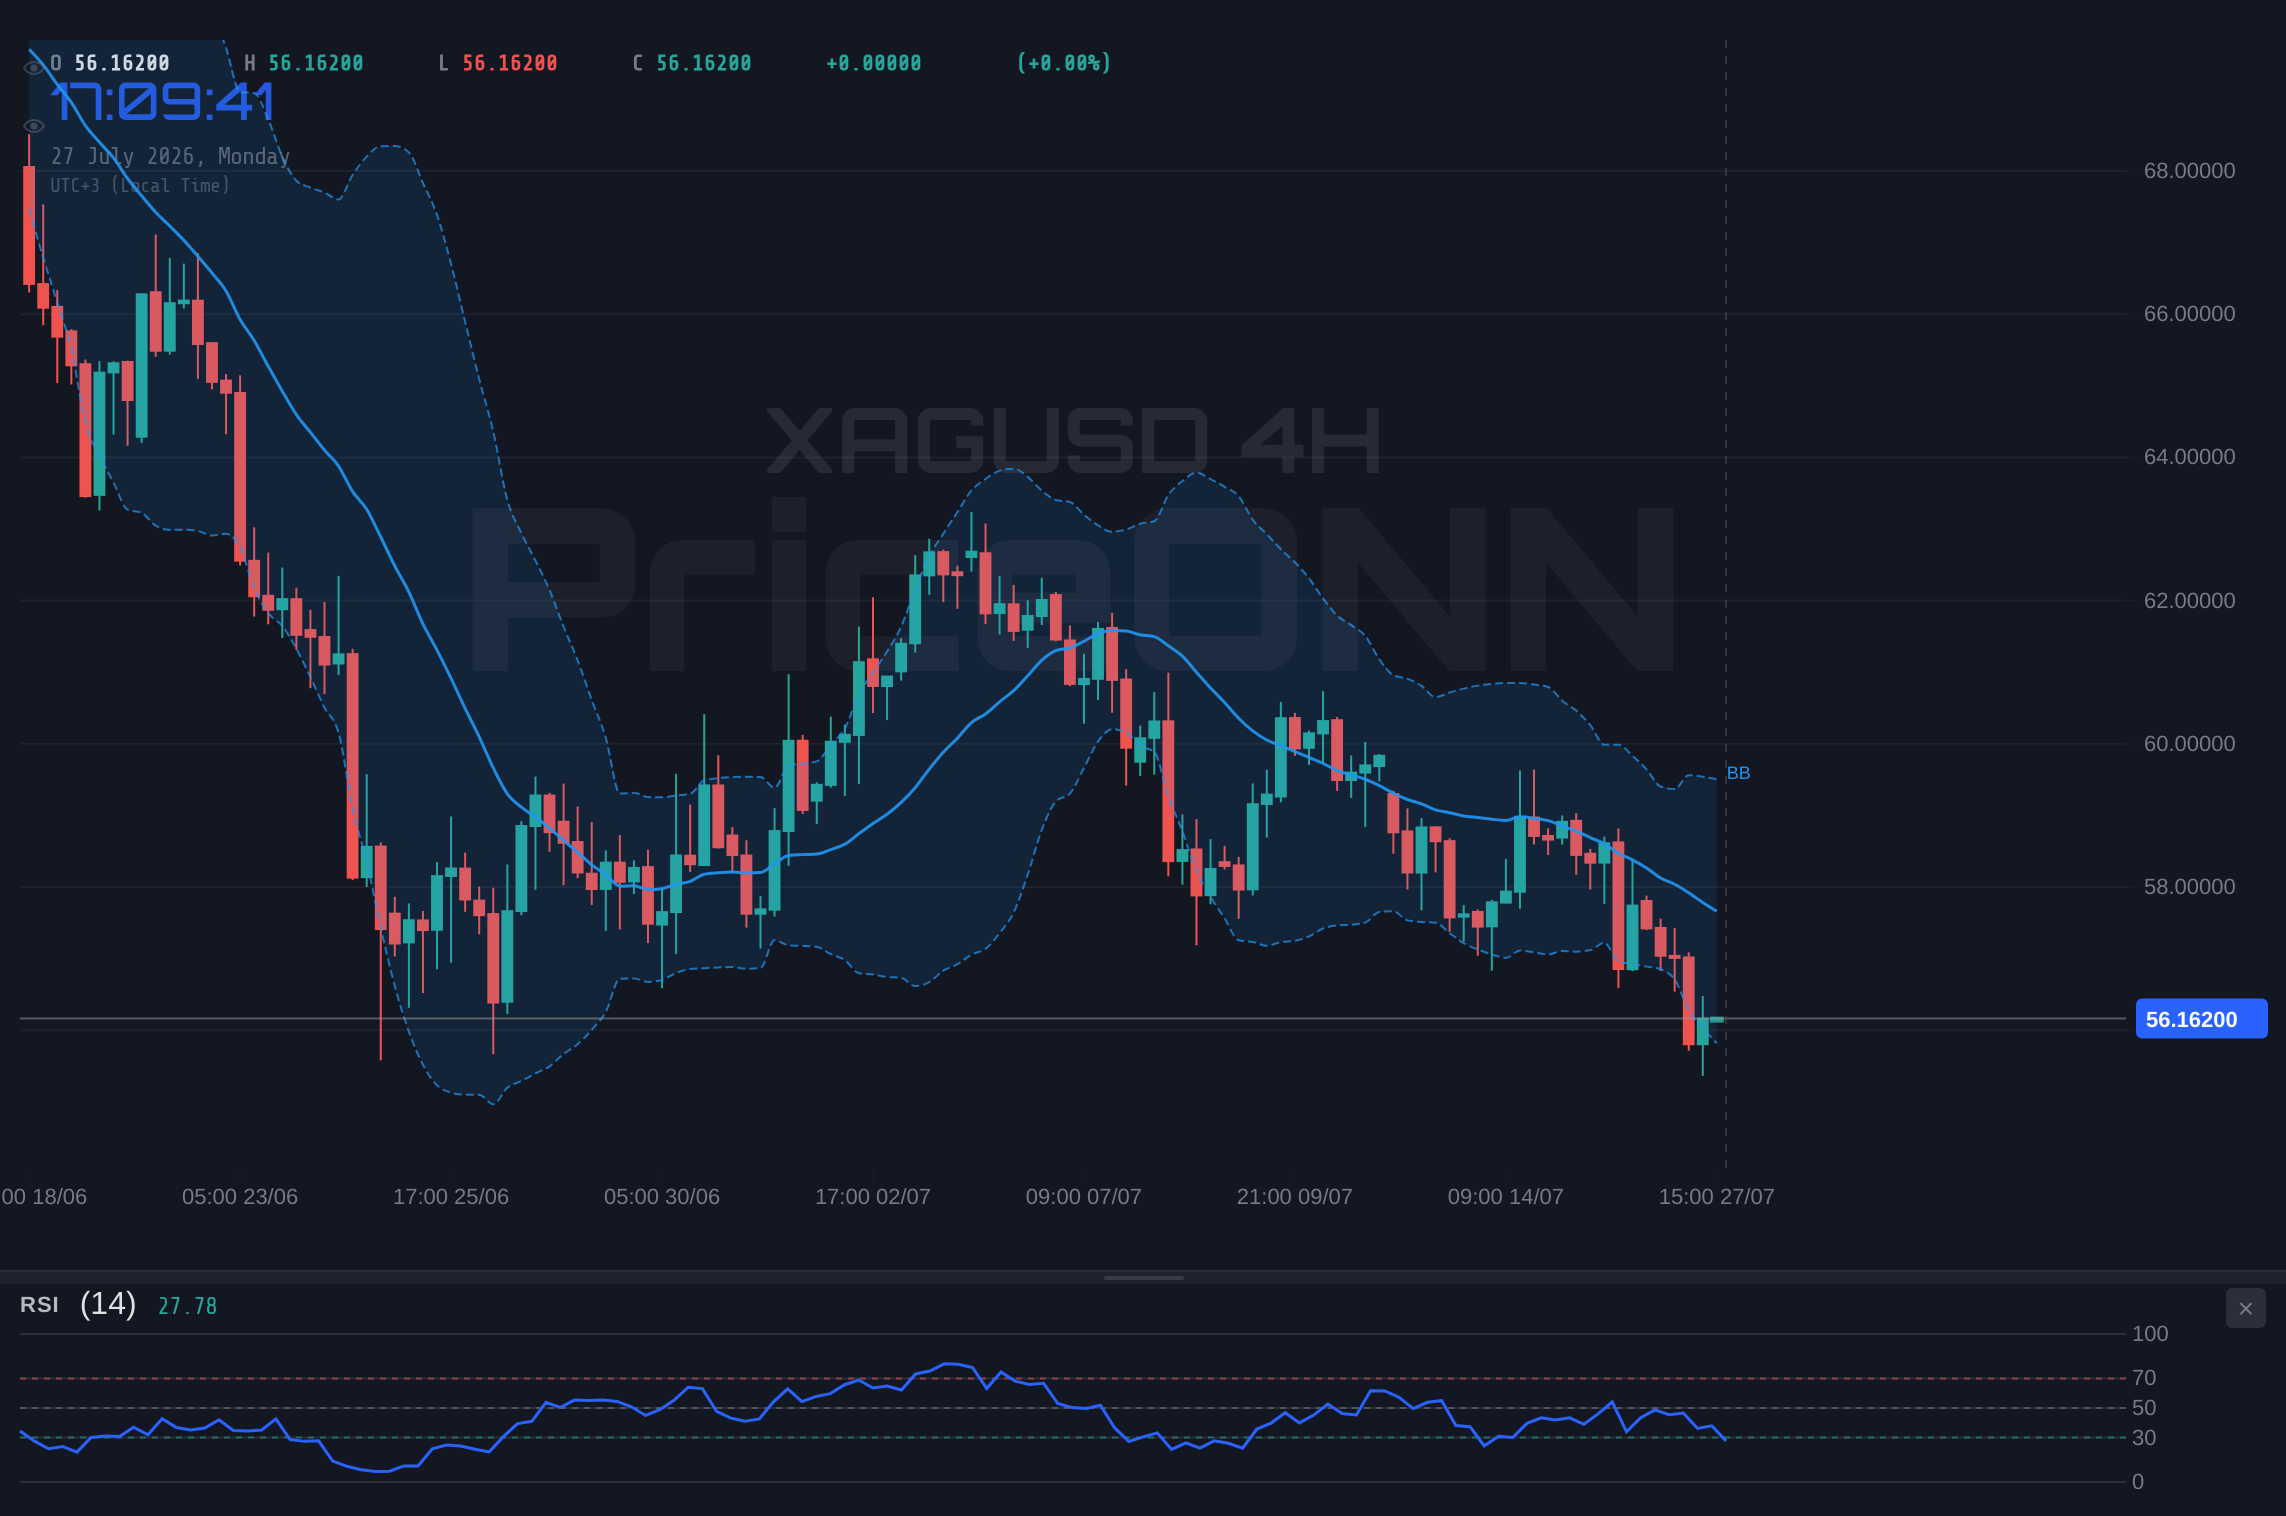
Silver, or XAGUSD, is currently finding itself at a critical juncture, trading near the $56.16 mark. This price point is significant not just as a current level, but because it hovers just above the crucial support level at $55.36. The broader market narrative is currently dominated by a strengthening US Dollar Index (DXY), which has climbed to 100.70, acting as a headwind for precious metals. With the DXY showing upward momentum, especially on the 1-hour chart, the pressure on silver is palpable. This dynamic sets the stage for a pivotal period where market participants will be closely watching to see if the $56.16 price can hold, or if the downward trend, evidenced by the 4-hour and daily charts, will push XAGUSD towards its next support levels.
- XAGUSD is trading at $56.16, testing near-term support.
- The US Dollar Index (DXY) is at 100.70 and rising on the 1H chart, increasing pressure on silver.
- Key support for XAGUSD is identified at $55.36, with resistance at $56.52.
- Technical indicators show mixed signals across timeframes, but the overall trend leans bearish on longer timeframes.
- Geopolitical tensions remain a background factor, but the immediate focus is on dollar strength and key price levels.
The precious metals market, particularly silver, has been sensitive to shifts in macroeconomic sentiment and currency movements. Currently, the strengthening US dollar is a dominant theme. The Dollar Index (DXY) has shown resilience, pushing higher and currently trading at 100.70. This strength in the dollar typically exerts downward pressure on dollar-denominated commodities like silver, as it becomes more expensive for holders of other currencies. Looking at the technical indicators for DXY, the 1-hour chart shows positive momentum with RSI at 56.6 and Stochastic in overbought territory. While the 4-hour chart presents a slightly more neutral picture, the overall trend indicated by the daily chart suggests continued dollar strength, which directly impacts XAGUSD's price action.
This correlation is not just theoretical; it's a consistent pattern observed in the markets. When the dollar strengthens, as it is doing now, investors often find dollar-denominated assets more attractive, leading to outflows from commodities like silver. This is particularly relevant for silver, which, while a precious metal, also has significant industrial applications, making its demand somewhat sensitive to global economic growth prospects often tied to dollar strength. The recent price action for XAGUSD, showing a daily drop of -2.73% and trading within the 3973.8 - 4065.47 range on the 1-hour chart, clearly illustrates this pressure. The current price of $56.16 is being closely watched as it approaches the first significant support level.
The Bull's Potential Roadmap: Navigating Above $56.52
For silver bulls to regain control, a decisive move above the immediate resistance at $56.52 is paramount. This level, currently acting as a ceiling on the 1-hour chart, represents the first hurdle. Should XAGUSD manage to break decisively above $56.52, the next target would be the resistance at $57.06. This upward trajectory would likely require a shift in market sentiment, perhaps a weakening of the US dollar or a resurgence in risk appetite that would benefit commodities. Looking at the technical indicators, the Stochastic oscillator on the 1-hour chart is showing a bullish signal (%K crossing above %D), which, while currently overshadowed by broader bearish trends, could be an early indication of a potential reversal if confirmed by other factors. A sustained move above $57.06 could then pave the way for testing the $58.07 resistance on the 4-hour chart. This scenario hinges on a confluence of factors, including a potential dip in the DXY and a positive turn in broader market sentiment, which seems less likely given current trends.
Furthermore, for a robust bullish case to emerge, we would need to see a significant improvement in momentum indicators across multiple timeframes. The RSI on the 1-hour chart, currently at 37.11, needs to break above the 50 level and sustain momentum. The MACD, which is showing negative momentum and is below its signal line on the 1-hour and 4-hour charts, would need to flip positive and cross above its signal line. On the daily chart, while the MACD shows positive momentum, the RSI at 38.86 still indicates room for improvement. The ADX, currently at 35.29 on the 1-hour chart, suggests a strong trend, but its direction will be key. For bulls, a weakening ADX from this level, coupled with a rising RSI and MACD, would be the ideal confirmation. The probability of this scenario playing out in the short term appears low, given the prevailing bearish technicals and the strength of the US dollar.
The current technical setup for XAGUSD presents a challenging environment for bulls. While a Stochastic crossover on the 1H chart hints at potential upside, it's currently a lone voice against a chorus of bearish signals across multiple timeframes. A sustained break above $56.52 is the minimum requirement, but traders should look for confirmation from RSI moving above 50 and MACD turning positive on the 1H and 4H charts before considering bullish positions. Until then, this remains a low-probability scenario.
Where Bears Take Control: The $55.36 Line in the Sand
The bearish outlook for XAGUSD appears more compelling, especially considering the current market conditions. The immediate price action is already indicating weakness, with the pair trading down 2.73% on the day. The primary target for the bears would be the support level at $55.36, identified on the 1-hour chart. A decisive break below this level would signal further downside, with the next logical support at $54.83 on the 4-hour chart. The daily chart also presents a bearish picture, with support levels at $56.54 and $55.34. A close below $55.36 would put the $54.10 support on the daily chart into play. The confluence of bearish signals across various timeframes supports this view. The RSI is below 50 on all observed timeframes (1H: 37.11, 4H: 35.87, 1D: 38.86), indicating bearish momentum. The MACD is negative and below its signal line on the 1H and 4H charts, reinforcing the selling pressure. The ADX, at 35.29 on the 1-hour chart, suggests a strong downward trend is in place, which is further confirmed by the daily ADX at 39.16.
The overwhelming 'Sell' signals from the 1-hour and 4-hour timeframes, and a predominantly 'Sell' signal on the daily timeframe, paint a clear picture. The Stochastic oscillator on the 4-hour chart is also showing a bearish signal (%K below %D), aligning with the broader trend. The Bollinger Bands, which are positioned below the middle band on the 1-hour and 4-hour charts, indicate a downward bias. For bears, the confirmation would be a clear break and hold below $55.36, followed by a similar move below $54.83. This scenario is strengthened by the continued strength of the US dollar and potential headwinds from global economic slowdown fears, which can reduce demand for industrial metals like silver.
Geopolitical factors, while less prominent in the immediate price action compared to dollar strength, still play a background role. News regarding US-Iran tensions, as reported by forex news outlets, can influence oil prices and, by extension, inflation expectations, which in turn affect precious metals. However, the current market focus seems firmly fixed on the Federal Reserve's policy path and the resulting dollar strength. If upcoming economic data, such as employment figures or inflation reports, continue to support a hawkish stance from the Fed, the bearish case for silver could be reinforced. The fact that oil prices have seen some pullback, as reported by Standard Chartered, might slightly ease inflation fears but doesn't negate the dollar's impact.
The confluence of technical indicators and macroeconomic factors strongly favors a bearish outlook for XAGUSD in the short to medium term. A break below the $55.36 support level appears to be the most probable near-term event, targeting $54.83 and potentially lower. Traders should monitor the $55.36 level closely as a key inflection point. The prevailing dollar strength and bearish technical signals provide a solid foundation for this scenario.
The Waiting Game: Consolidation Around $56.16
While both bullish and bearish scenarios have their merits, there's also a possibility that XAGUSD could enter a period of consolidation, particularly if key economic data releases remain mixed or if geopolitical tensions flare up unexpectedly, creating a flight to safety that temporarily boosts metals despite dollar strength. In such a scenario, the price could oscillate between the current support and resistance levels, roughly between $55.36 and $56.52 on the 1-hour chart. This range-bound movement could be driven by conflicting signals from different indicators or by traders adopting a wait-and-see approach ahead of major economic events, such as central bank meetings or key inflation reports.
For consolidation to take hold, we would likely see a stabilization in the DXY, perhaps after reaching a short-term peak, and a lack of strong directional catalysts. The ADX values, which are currently indicating strong trends on most timeframes (1H: 35.29, 4H: 29.63, 1D: 39.16), would need to decline significantly, suggesting a loss of trend strength and an increase in sideways price action. The RSI would likely hover around the 50 level, indicating a balance between buyers and sellers. The Stochastic on the 1-hour chart, which is currently showing a bullish crossover, could then fail to sustain its move, or the bearish crossover on the 4-hour chart might stall. This neutral scenario is less likely given the strong directional bias suggested by most indicators and the current macroeconomic backdrop, but it remains a possibility if market participants become hesitant to commit to new positions.
The economic calendar provides context for potential consolidation. Upcoming events, such as ECB policy statements or US employment data, could introduce uncertainty. For instance, if the ECB signals a more dovish tone than expected, it might weaken the Euro and indirectly support the dollar, but if it signals further rate hikes due to inflation concerns (as mentioned by ECB's Kazimir), it could add complexity. Similarly, US employment data can swing dollar sentiment. If these events produce ambiguous results or are already priced in, the market might default to a holding pattern. However, the current technical setup, with strong trend signals from ADX, makes prolonged consolidation less probable compared to a directional move.
While consolidation around $56.16 is technically possible, the strong trend signals from ADX across multiple timeframes and the clear directional bias from indicators like RSI and MACD suggest that a period of sideways movement is less probable than a decisive move. This scenario would require a significant shift in market drivers, such as a sharp reversal in the DXY or a major geopolitical event that overrides current trends. Until such shifts occur, traders should remain prepared for a directional move rather than a sustained range.
The Most Likely Scenario: A Bearish Path Forward
Weighing the evidence from technical indicators, macroeconomic correlations, and the prevailing market sentiment, the most likely scenario for XAGUSD in the near to medium term is a bearish continuation. The confluence of factors strongly suggests that the downward pressure will persist. The US Dollar Index (DXY) is showing strength, trading at 100.70 and exhibiting upward momentum on the 1-hour chart, a trend that typically weighs on silver prices. On the technical front, silver's charts are replete with bearish signals. The RSI is below 50 on all observed timeframes (1H: 37.11, 4H: 35.87, 1D: 38.86), indicating bearish momentum. The MACD is negative and below its signal line on the 1-hour and 4-hour charts, reinforcing selling pressure. The ADX, at 35.29 on the 1-hour and 39.16 on the daily, confirms strong trending conditions, which are currently bearish.
The probability of this bearish scenario playing out is estimated at around 65-70%. The immediate trigger for this scenario would be a sustained break below the key support level at $55.36. Once this level is breached, the next target would be the 4-hour support at $54.83, followed by the daily support at $54.10. The invalidation of this bearish thesis would occur if XAGUSD manages to break decisively above the 1-hour resistance at $56.52 and subsequently holds above it, ideally with confirming bullish signals across indicators.
The bullish scenario, requiring a break above $56.52 and sustained upward momentum, currently has a lower probability, estimated at 10-15%. This would need a significant shift in market drivers, such as a sharp reversal in the DXY or a major geopolitical event that boosts safe-haven demand for gold and silver simultaneously. The consolidation scenario, where XAGUSD trades within a range, is possible but less likely given the strong trend signals. Its probability is estimated at 15-20%, primarily dependent on mixed economic data or indecision ahead of key events.
The current market environment, characterized by a strong dollar and hawkish central bank rhetoric, provides a fertile ground for this bearish outlook. While news around geopolitical events like US-Iran tensions can cause temporary volatility, the overarching trend is dictated by monetary policy expectations and currency strength. Therefore, traders should remain vigilant for signs of a breakdown below $55.36, as this is the most probable path for XAGUSD in the near term.
What I'm Watching This Week
To navigate the coming days, several key catalysts and levels demand close attention. Firstly, the immediate price action around the $56.16 level and the critical support at $55.36 is paramount. A confirmed break below this level would be the strongest signal for the bearish scenario. Secondly, the movement of the US Dollar Index (DXY) will be crucial. If the DXY continues its ascent, particularly on the 1-hour chart where it shows positive momentum, it will likely add further pressure on XAGUSD. Traders should monitor the DXY's ability to hold above 100.70.
Thirdly, upcoming economic data releases will play a significant role. While specific events like the ECB's policy decisions or US employment figures are always market movers, the *interpretation* of this data in the context of inflation and interest rate expectations will be key. Any data that reinforces hawkish central bank policy will likely support the dollar and weigh on silver. Finally, keep an eye on the technical indicators for confirmation. The Stochastic on the 1-hour chart is showing a bullish signal, but it needs confirmation from RSI moving above 50 and MACD turning positive for any sustained bullish move. Conversely, sustained bearish signals from these indicators on the 4-hour and daily charts will reinforce the downside targets.
Bearish Scenario: Downside Momentum
70% ProbabilityNeutral Scenario: Range-Bound Play
20% ProbabilityBullish Scenario: Reversal Setup
10% ProbabilityFrequently Asked Questions: XAGUSD Analysis
What happens if XAGUSD breaks below the $55.36 support level?
A break below $55.36 would likely trigger further selling pressure, targeting the next support at $54.83 on the 4-hour chart. This move would align with the prevailing bearish technical signals and the strong US dollar.
Is RSI at 37.11 a sell signal for XAGUSD right now?
An RSI of 37.11 on the 1-hour chart indicates bearish momentum, but it's not yet in oversold territory. It supports the bearish outlook but requires confirmation from other indicators like MACD and a break of key support levels for a strong sell signal.
How will the upcoming ECB policy decision affect XAGUSD this week?
An unexpectedly hawkish ECB stance could strengthen the Euro, potentially weakening the dollar and offering some respite to XAGUSD. Conversely, a dovish tone or concerns about inflation could support the dollar, adding pressure on silver.
Should I consider buying XAGUSD at current levels around $56.16?
Buying at $56.16 carries significant risk given the bearish technicals and dollar strength. A more prudent approach would be to wait for a confirmed break above resistance at $56.52 or a clear bounce from a lower support level like $54.83, with multiple indicators confirming the reversal.
Technical Outlook Summary
| Indicator | Value | Signal | Interpretation |
|---|---|---|---|
| RSI (14) | 37.11 | Bearish | Below 50, indicating bearish momentum. |
| MACD Histogram | -1.58 | Bearish | Negative momentum, below signal line. |
| Stochastic | K:43.73, D:25.17 | Bullish Crossover | %K above %D, but in neutral zone. |
| ADX | 35.29 | Strong Trend | Indicates a strong trend is active. |
| Bollinger Bands | Price below Middle Band | Bearish Bias | Suggests downward pressure. |
Key Levels
Support Levels
Resistance Levels
Track markets in real-time
AI-powered analysis, technical indicators and real-time price data.
Join Our Telegram Channel
Breaking market news, AI analysis and trading signals instantly.
Join Channel