

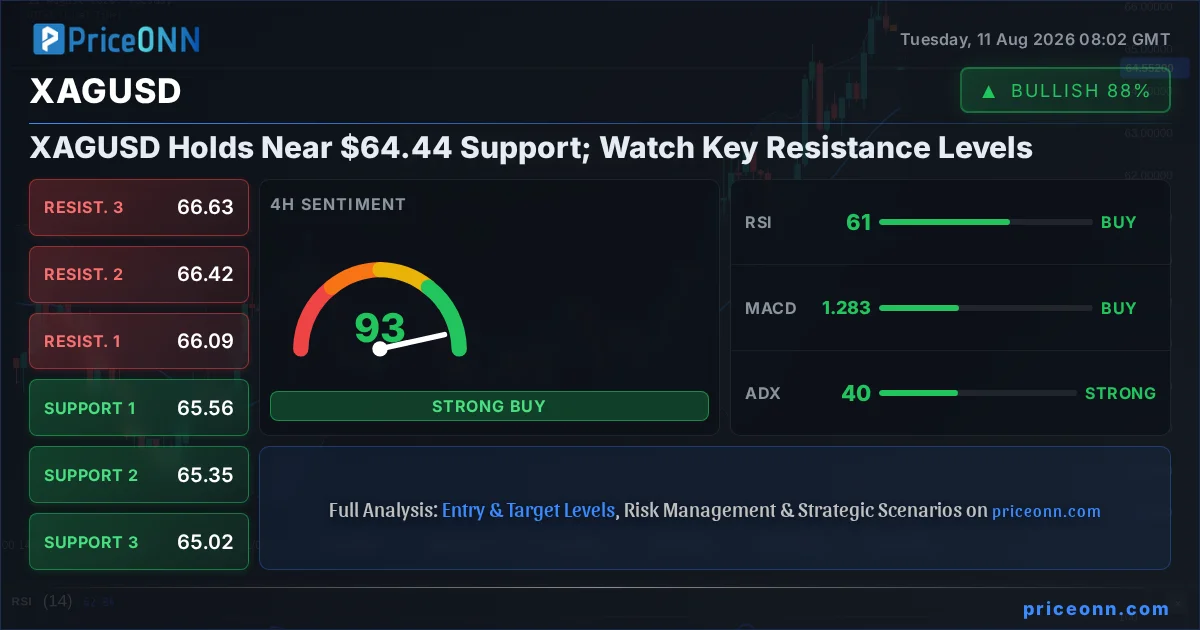
Silver, or XAGUSD, is currently trading at $64.48, a pivotal point where the bulls are defending against a bearish onslaught. The precious metal has experienced a notable dip, shedding 0.73% or $0.48 over the last trading session, painting a picture of cautious sentiment in the short term. However, the longer-term outlook, particularly on the 4-hour and daily charts, still flashes bullish signals, creating a complex tug-of-war that traders are closely watching. This delicate balance between immediate selling pressure and underlying strength makes understanding the key levels and indicators more critical than ever for navigating the XAGUSD market.
- RSI at 44.82 on the 1H chart signals bearish momentum, while the 4H RSI at 60.64 indicates a neutral-to-bullish trend.
- Critical support for XAGUSD is identified at $64.44, with further levels at $64.12 and $63.78.
- Key resistance to watch is at $64.86, followed by $65.28 and $65.61.
- The ADX at 35.74 on the 1H chart suggests a strong downtrend, contrasting with the ADX at 40 on the 4H chart indicating a strong uptrend.
- The DXY is currently at 99.92, exerting pressure on metals, while oil prices are rising, potentially influencing inflation expectations.
The intricate dance between short-term weakness and longer-term bullish potential in XAGUSD is a classic example of how multiple timeframes can paint conflicting narratives. On the immediate 1-hour chart, the sentiment leans bearish. The Relative Strength Index (RSI) at 44.82 is firmly in neutral territory but trending downwards, suggesting that sellers have a slight edge in the very short term. This is further corroborated by the Moving Average Convergence Divergence (MACD), which shows negative momentum with the MACD line below its signal line. Bollinger Bands are also indicating a bearish bias, with price trading below the middle band, hinting at potential further downside. The Stochastic Oscillator, with its %K line at 12.46 and %D line at 38.47, clearly signals a bearish sentiment, with %K significantly below %D, pointing towards oversold conditions that might precede a bounce, but the immediate signal is one of weakness. The Average Directional Index (ADX) at 35.74 reinforces this, indicating a strong bearish trend currently in play on the 1-hour timeframe. This confluence of indicators paints a picture of immediate selling pressure, suggesting that any upward movement might face headwinds in the near term.
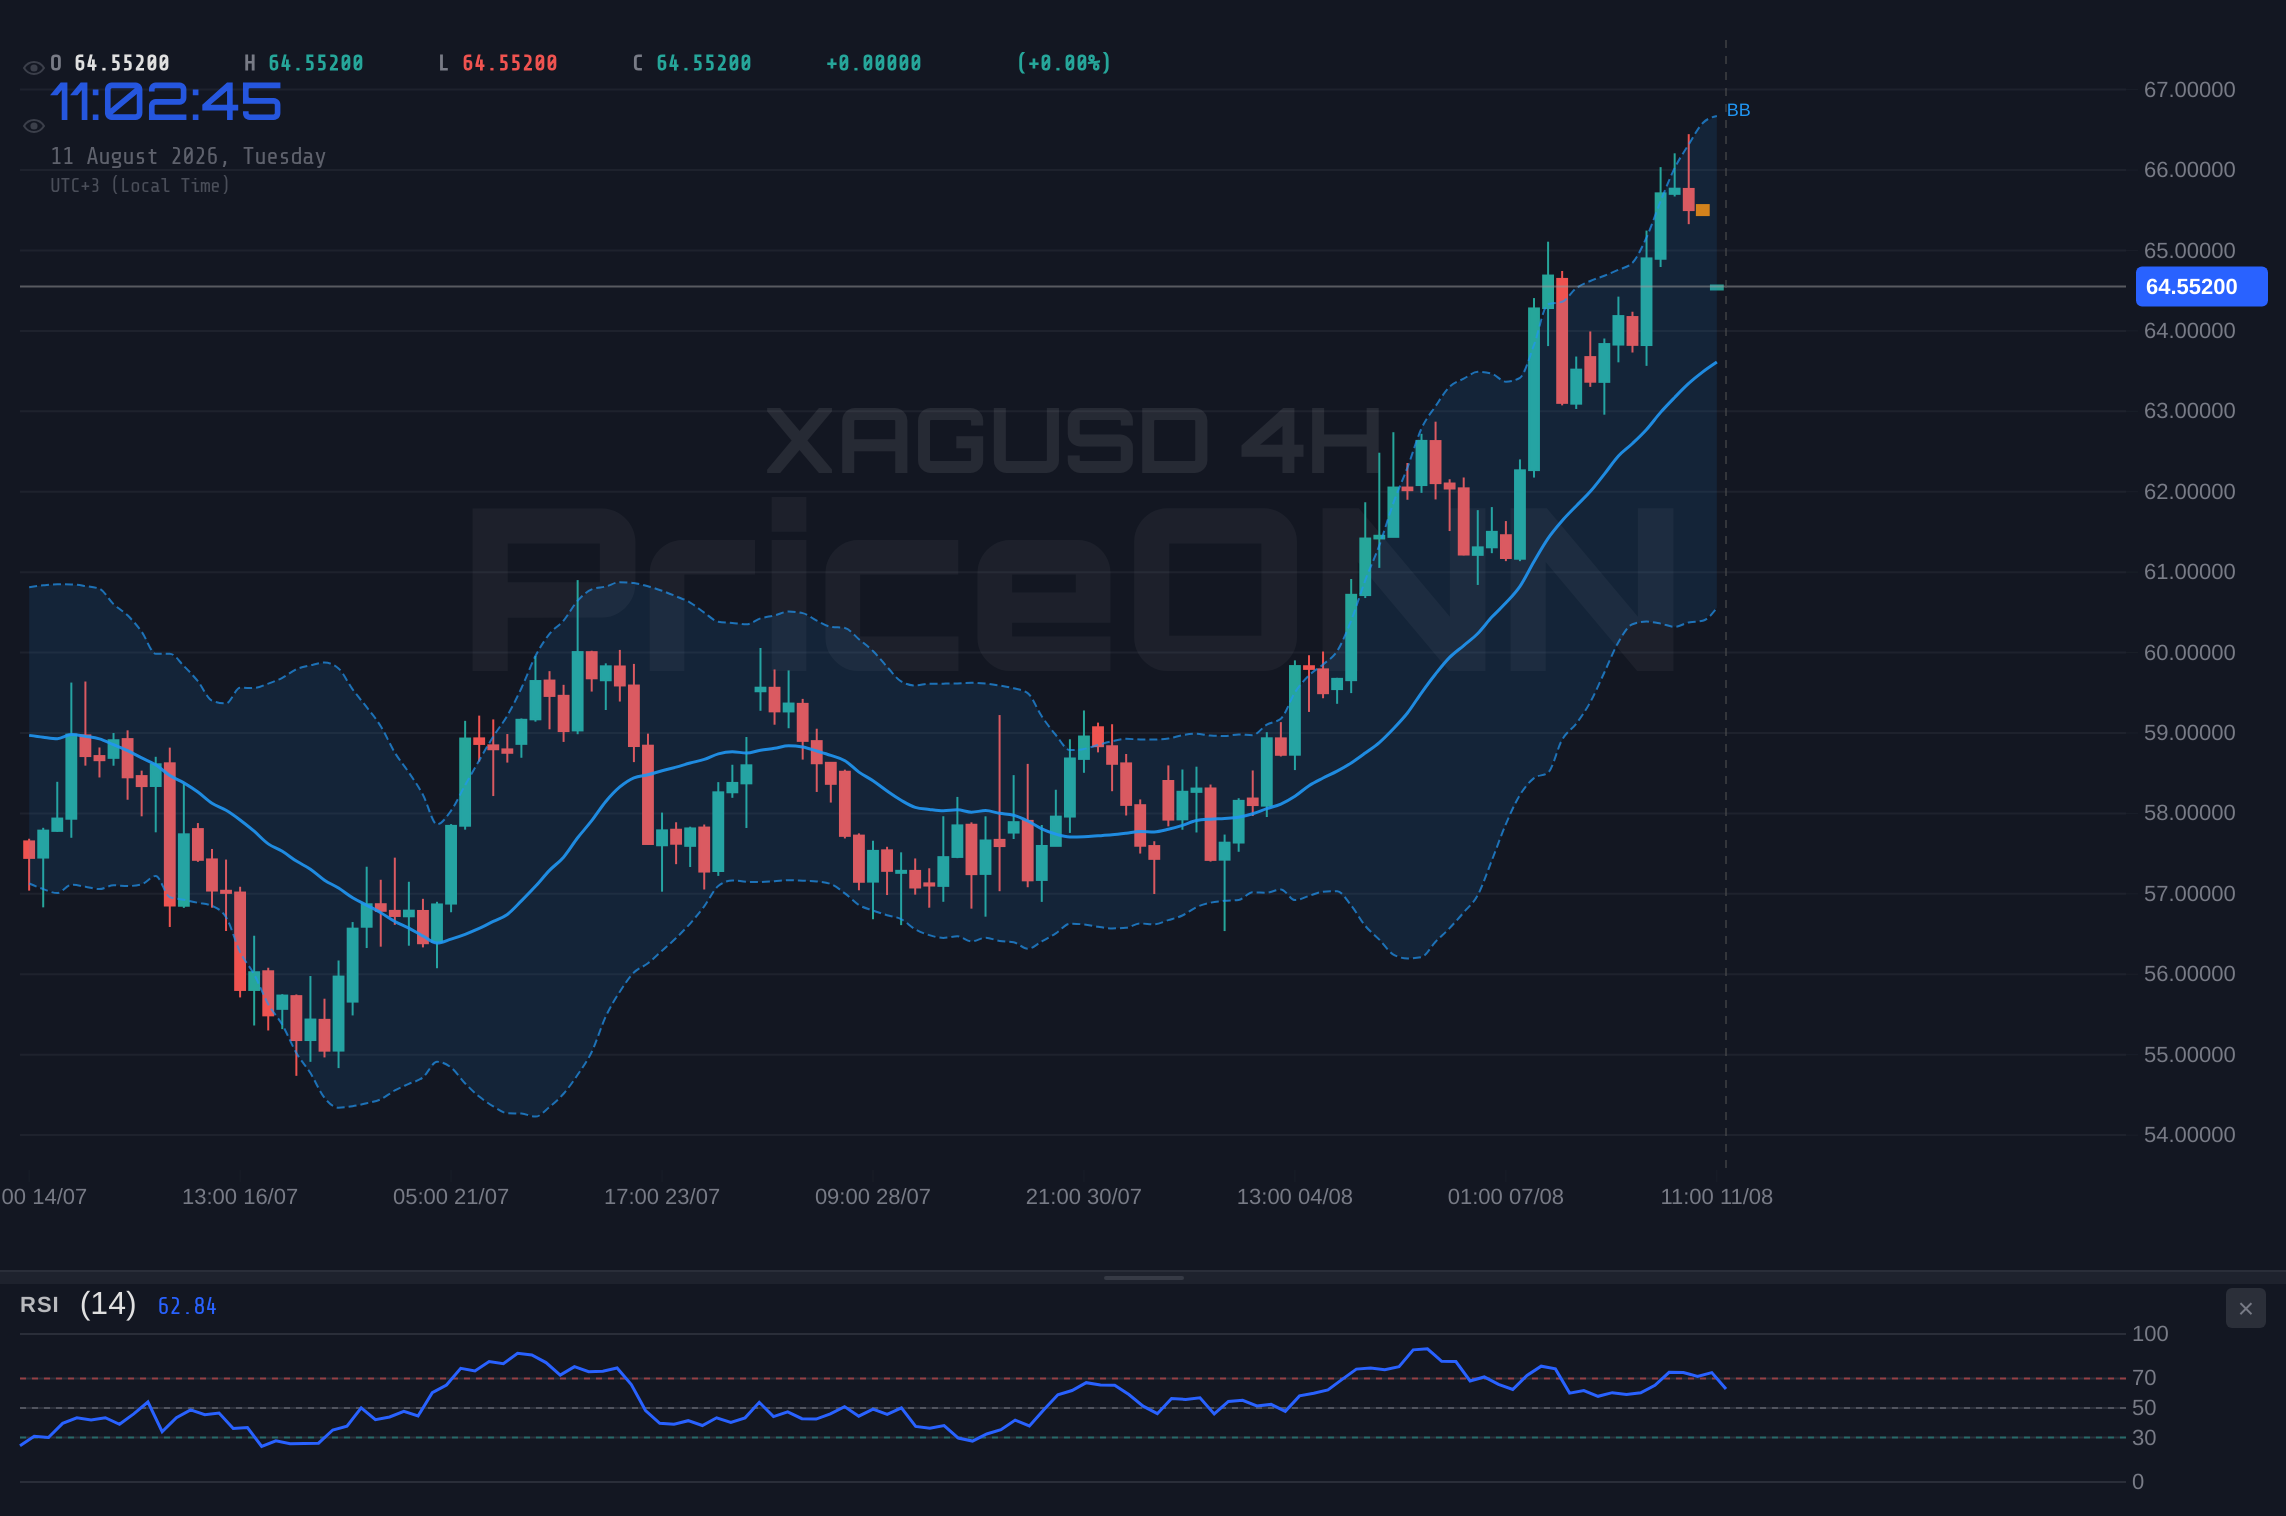
However, to dismiss silver based solely on its 1-hour performance would be a grave mistake. When we expand our view to the 4-hour chart, the narrative shifts dramatically. Here, the trend is decidedly bullish, with a powerful 100% strength rating. The RSI at 60.64 is comfortably in neutral territory and trending upwards, indicating healthy buying interest. The MACD is showing positive momentum, with the MACD line positioned above its signal line, a classic bullish sign. Bollinger Bands are also supportive, with price trading above the middle band, suggesting an upward trajectory. While the Stochastic Oscillator currently shows a bearish signal (%K at 73.13, %D at 76.62, with %K below %D), this often occurs in strong uptrends as the market approaches overbought conditions before potentially consolidating or continuing higher. Crucially, the ADX on the 4-hour chart stands at a robust 48.22, confirming a strong bullish trend. This multi-timeframe divergence is where the real trading opportunity lies – identifying the potential pivot points and understanding which timeframe's signal is likely to dominate.
Navigating the $64.44 Support Level
The immediate focus for silver traders remains anchored around the $64.44 support level. This is not just an arbitrary number; it represents a critical juncture where buying interest has historically emerged. The data shows immediate support at $64.44, followed by deeper levels at $64.12 and $63.78. A decisive break below $64.44 would invalidate the short-term bullish thesis and could trigger a cascade of selling as stop-loss orders are likely to be triggered. The 1-hour chart’s bearish signals lend credence to the possibility of testing these lower levels. However, the strength of the 4-hour uptrend suggests that this support zone might hold firm, potentially leading to a bounce. The question for traders is whether the immediate bearish momentum on the 1-hour chart is strong enough to overcome the underlying bullish structure identified on higher timeframes. Patience is key here; waiting for confirmation of a break or a convincing bounce is paramount.
Conversely, resistance levels are currently situated at $64.86, $65.28, and $65.61. The $64.86 level is the immediate hurdle that bulls need to clear to regain control on the 1-hour chart. A successful breach and hold above this resistance could signal a shift in short-term momentum, potentially aligning the 1-hour indicators with the bullish narrative seen on the 4-hour and daily charts. The daily chart itself presents a neutral trend with 50% strength, but with an upward bias indicated by the RSI at 64.76 and MACD showing positive momentum. The Stochastic on the daily chart is in overbought territory (K=90.77, D=74.34), which, while sometimes preceding a pullback, also suggests strong underlying buying pressure. The ADX at 29.01 on the daily chart indicates a strong uptrend, adding further weight to the bullish case on higher timeframes. This reinforces the idea that the current dip might be a temporary correction within a larger upward move.
Correlation and Context: DXY and Oil's Influence
Understanding the broader market context is crucial for any XAGUSD analysis. The Dollar Index (DXY), currently at 99.92, plays a significant role. Typically, a strengthening dollar puts downward pressure on precious metals like silver, as they become more expensive for holders of other currencies. The DXY's current upward trajectory, despite its weak trend on the 1-hour chart, is a factor that cannot be ignored. If the DXY continues to climb towards the 100 mark, it could exacerbate the selling pressure on XAGUSD, especially if it breaks through its immediate resistance levels. The data shows the DXY on the 1D chart in a downtrend with a strong ADX at 28.78, suggesting that while it might be experiencing short-term strength, the longer-term direction could still be downwards, which would be supportive for silver.
Furthermore, energy prices, particularly Brent crude oil at $88.12, are on the rise, indicating increased inflationary pressures or geopolitical concerns. Rising oil prices often correlate with higher inflation expectations, which can, in turn, increase demand for gold and silver as inflation hedges. Brent crude's strong 1.84% daily gain and bullish signals across timeframes suggest that energy markets are heating up. This could provide a tailwind for silver if inflation fears begin to dominate market sentiment, potentially overriding the negative impact of a strong dollar. The interplay between the dollar's strength and inflation expectations driven by oil prices creates a complex environment, demanding careful observation of which factor gains prominence.
The recent news flow also adds layers to this analysis. Reports suggest that the US jobs data has caused the USD index to plummet amid a decline in US employment, benefiting gold. While this specific news might not directly impact silver in the same magnitude, it indicates a potential shift in market sentiment away from dollar strength. The mention of knowing how to trade CPI inflation data and silver being a potentially better trade than gold in that context highlights the underlying demand for precious metals as inflation indicators. The resumption of gold’s bullish momentum also suggests a broader positive sentiment for the precious metals complex. While specific news about ArcelorMittal ranking as a top metals pick is more equity-focused, it points to general strength in the metals sector. The ongoing geopolitical tensions, such as the evasive U.S.-Iran deal and pressure to restrict U.S. oil exports, contribute to the broader uncertainty that often drives safe-haven demand towards precious metals.
Trade Scenarios for XAGUSD
Given the conflicting signals across different timeframes and the current price action around the $64.44 support, developing clear trade scenarios is essential. The ADX at 40 on the 4-hour chart is a strong indicator of a robust uptrend, suggesting that the bullish scenario, while currently challenged by 1-hour weakness, holds a significant probability. However, the immediate bearish signals on the 1-hour chart cannot be ignored, necessitating a cautious approach and well-defined risk management.
Bearish Scenario: Support Breakdown
25% ProbabilityNeutral Scenario: Consolidation Near Support
40% ProbabilityBullish Scenario: Bounce from Support
35% ProbabilityThe Path Forward: Risk Management is Paramount
The current technical picture for XAGUSD is complex, characterized by conflicting signals between short-term bearish indicators and a more robust bullish trend on higher timeframes. The $64.44 support level is the immediate battleground. A sustained hold above this level, followed by a decisive break above the $64.86 resistance, could see silver resume its upward trajectory, aligning with the 4-hour and daily chart signals. Conversely, a failure to hold $64.44 and a subsequent break below $64.12 would likely open the door for further downside, testing lower support levels. Traders must remain vigilant, prioritizing risk management by setting appropriate stop-losses, especially given the ADX readings suggesting strong trends are in play on both the 1-hour and 4-hour charts.
The interplay with the DXY and oil prices will be critical in the coming sessions. If the dollar continues its ascent towards the 100 level, it could cap any upside potential for silver. However, if inflation concerns, fueled by rising oil prices, begin to take precedence, silver could find a strong bid as a hedge. The Stochastic oscillator on the 1-hour chart is in oversold territory, hinting at a potential bounce, but the ADX at 35.74 indicates that trend strength is significant, meaning any bounce might be short-lived if the bearish momentum persists. On the other hand, the 4-hour ADX at 40 highlights a strong uptrend, suggesting that dips might be buying opportunities for those with a longer-term perspective. Ultimately, confirmation is key - waiting for price action to align across multiple timeframes before committing to a trade will be the most prudent strategy.
The market is dynamic, and conditions can change rapidly. While the 1-hour chart currently shows bearish signs, the underlying strength indicated by higher timeframes suggests that the bulls are not yet out of the fight. The key lies in observing how price reacts to the $64.44 support and the $64.86 resistance. A decisive move in either direction, supported by confirmation from other indicators, will likely dictate the next significant price action for XAGUSD. Traders should remain disciplined, manage their risk effectively, and be prepared to adapt to evolving market conditions. The path forward for silver will likely be defined by its ability to hold key support levels and overcome immediate resistance in the face of broader market influences.
Frequently Asked Questions: XAGUSD Analysis
What happens if XAGUSD breaks below the $64.12 support level?
A break below $64.12 would invalidate the immediate bullish thesis and could trigger further selling pressure. This scenario, with a 25% probability, targets $63.78 and potentially $63.37, aligning with the bearish signals on the 1-hour chart.
Should I buy XAGUSD at current levels of $64.48 given the mixed signals?
Buying at current levels requires caution due to conflicting timeframes. A bullish scenario (35% probability) is confirmed by a hold above $64.12 and a break above $64.86, targeting $65.28. Without this confirmation, a neutral scenario around $64.44 is more likely.
Is the RSI at 44.82 a sell signal for XAGUSD on the 1H chart?
An RSI of 44.82 on the 1-hour chart indicates neutral momentum trending downwards, suggesting some bearish pressure but not yet oversold territory. It aligns with the immediate bearish sentiment but is contrasted by higher RSI values on longer timeframes.
How will the rising DXY at 99.92 affect XAGUSD this week?
A rising DXY generally puts pressure on silver. If the DXY continues its ascent towards 100, it could hinder XAGUSD's recovery. However, if inflation fears driven by rising oil prices ($88.12 Brent) become dominant, this could provide a counteracting bullish force for silver.
Track markets in real-time
AI-powered analysis, technical indicators and real-time price data.
Join Our Telegram Channel
Breaking market news, AI analysis and trading signals instantly.
Join Channel