

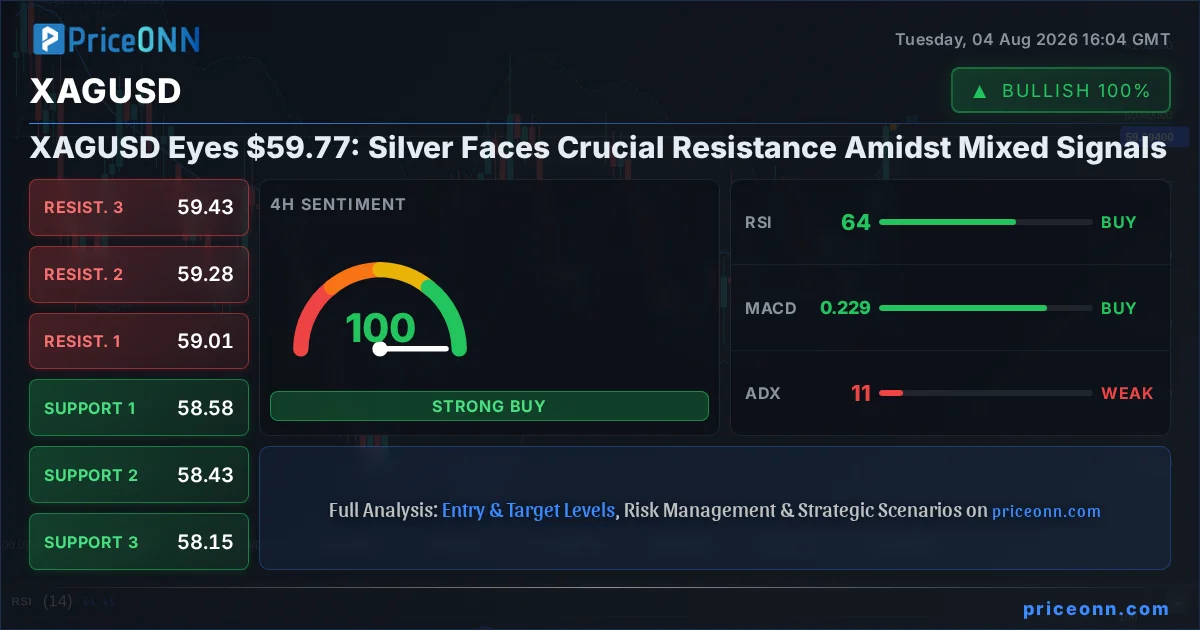
Silver, or XAGUSD as it's known in the trading world, is currently trading at a pivotal point, hovering around the $59.77 mark. This level is not just a number; it represents a critical juncture where short-term price action is battling against longer-term trends and a host of technical indicators. After a significant upward move, the precious metal is now approaching a well-defined resistance zone, making the coming hours and days crucial for determining its next directional bias. The market is a complex interplay of forces, and understanding the nuances of XAGUSD's current technical posture is key for any trader looking to navigate this volatile landscape.
- Silver (XAGUSD) is trading at $59.77, testing resistance at $59.01.
- The 1-hour RSI is at 69.63, indicating strong bullish momentum but approaching overbought territory.
- ADX readings across timeframes suggest a weak to moderate trend, pointing towards potential consolidation or a choppy breakout.
- A decisive move above the $59.01 resistance is needed to confirm a continuation of the bullish trend, while failure could see a retreat towards support levels.
The 1-hour chart paints a picture of bullish momentum, with the Relative Strength Index (RSI) sitting at 69.63. While this is comfortably within the neutral zone, it's inching towards the overbought territory, suggesting that the recent upward surge might be losing some steam or is at least ripe for a pause. The MACD indicator on this timeframe also supports a positive outlook, showing positive momentum with the MACD line above its signal line. This usually implies that the buying pressure is still dominant in the very short term. However, the Stochastic Oscillator, with %K at 82.12 and %D at 60.56, is firmly in overbought territory, flashing a warning sign for immediate upside continuation. The Average Directional Index (ADX) at 17.59 confirms what many traders are likely feeling: the trend strength is weak, meaning any breakout could be less convincing and more prone to reversals or whipsaws. This confluence of signals on the 1H chart suggests caution is warranted for aggressive long positions.
Navigating the Choppy Waters: 4-Hour Technicals
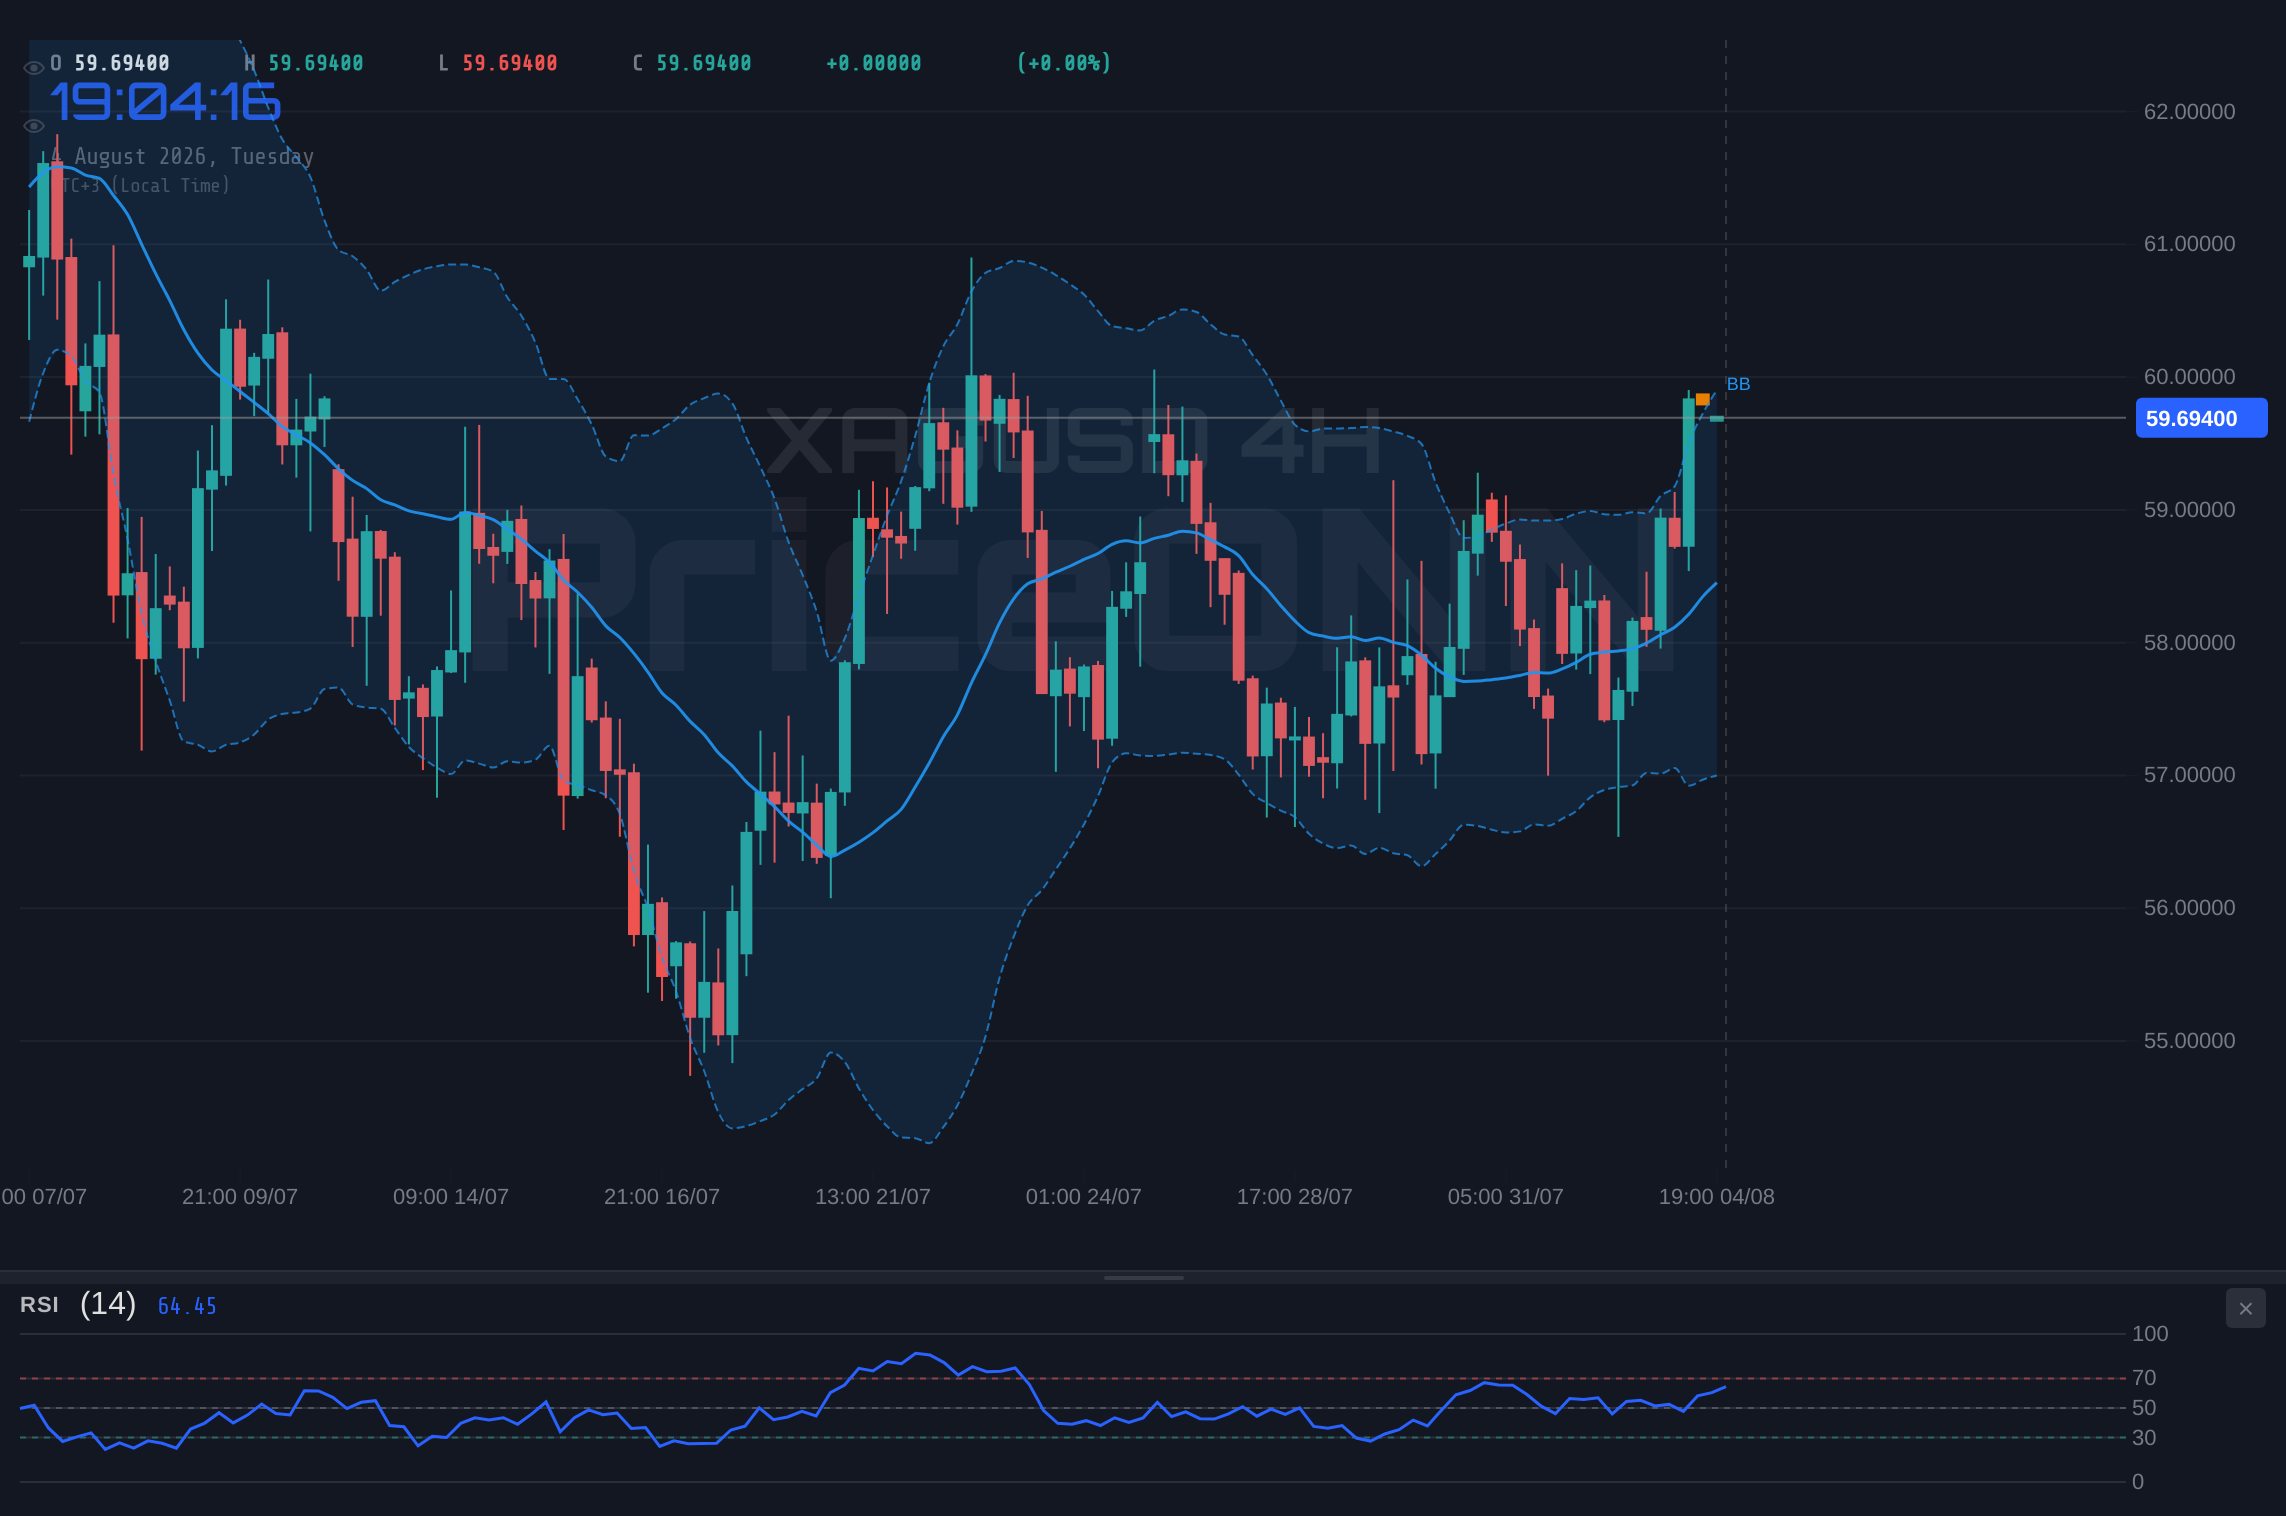
Shifting our focus to the 4-hour timeframe, the picture for XAGUSD becomes even more nuanced. The trend is officially neutral here, with a power rating of 50%, indicating a lack of strong directional conviction from market participants. The RSI at 57.72 reinforces this neutral stance, sitting comfortably in the middle ground, showing neither significant buying nor selling pressure. The MACD, while still showing positive momentum, is less convincing than on the 1-hour chart. Bollinger Bands are hugging the middle band, hinting at a period of consolidation rather than explosive moves. The Stochastic Oscillator, however, continues to lean bullish with %K at 77.69 and %D at 50.66, suggesting that while the overall trend is neutral, there's still underlying strength that could push prices higher. Yet, the ADX at a mere 13.28 underscores the lack of a strong trend. This low ADX value is a critical piece of information for traders; it signals that the market is consolidating, and a breakout might be building, but it's not yet confirmed. The 'General Signal' of 'BUY' across multiple shorter timeframes, contrasted with the neutral trend and weak ADX, creates a complex trading environment. It suggests that while buyers are present, the conviction isn't strong enough for a sustained rally without further catalysts.
The Daily Chart Perspective: A Broader View
Looking at the daily chart, the narrative for XAGUSD shifts significantly. Here, the trend is decisively identified as 'Downtrend' with a power rating of 93%. This is a crucial piece of context. The daily RSI at 49.34 hovers just below the 50-mark, indicating a slight bearish inclination. The MACD here shows positive momentum, which might seem contradictory, but it often lags behind price action and can sometimes give false signals in a well-established downtrend, especially if it's a weaker downtrend. The Bollinger Bands are above the middle band, suggesting a potential upward bias within the larger downtrend, a common pattern during consolidation phases within a larger bearish move. However, the Stochastic Oscillator's %K at 42.75 and %D at 46.33 presents a bearish signal, with %K below %D, aligning with the daily trend. The ADX at 26.54 signifies a moderately strong downtrend. The 'General Signal' on the daily chart is 'SELL' (5 Sell, 3 Buy, 0 Neutral). This divergence between the shorter-term bullish signals and the longer-term bearish trend is where the real trading challenge lies. It suggests that while there might be short-term opportunities for bulls, the overarching sentiment and structure on the daily chart favor sellers. Traders must be aware of this multi-timeframe conflict.
Key Levels and the $59.01 Battleground
The immediate battleground for XAGUSD is clearly around the $59.01 resistance level. This is not just an arbitrary line; it's a price point that has shown significance in the recent price action. On the 1-hour chart, $59.01 is the first key resistance. A decisive break and hold above this level would be a strong signal for bulls, potentially opening the door to further upside towards the next resistance at $60.09. Conversely, failure to overcome $59.01 could see prices retreat. The support levels on the 1-hour chart are at $59.23, $58.96, and $58.67. A break below $59.23 could signal a short-term pullback, with $58.96 acting as the next significant test. On the 4-hour chart, the resistance is also identified around $59.01, with subsequent levels at $59.28 and $59.43. The support here is located at $58.58, $58.43, and $58.15. The daily chart places the immediate resistance at $4083.41, which is significantly higher than the current price and reflects the longer-term trend. However, for the current price action near $59.77, the relevant resistance is the one identified on the shorter timeframes. The interplay between these levels and the current price of $59.77 is what traders will be closely watching. A clear move above $59.01, supported by increasing volume and conviction, could signal a continuation of the intraday rally. However, if price action stalls or reverses at this level, it would reinforce the bearish sentiment seen on the daily chart.
Correlation Analysis: DXY and Equities
Understanding the broader market context is crucial for XAGUSD, and correlations with the US Dollar Index (DXY) and major equity indices like the S&P 500 provide valuable insights. Currently, the DXY is trading near 99.9, showing a slight decline of 0.07% on the day. Historically, a strengthening dollar often puts downward pressure on precious metals like silver, as they become more expensive for holders of other currencies. Conversely, a weaker dollar can provide a tailwind for silver. The current slight dip in the DXY is a minor factor, but it aligns with the intraday bullish sentiment in silver. However, the longer-term trend of the DXY and its relationship with silver should not be ignored. If the DXY were to resume a significant upward trend, it would likely create headwinds for XAGUSD. On the equity front, the S&P 500 is showing strength, up 0.74% at 6572.87, and the Nasdaq is even stronger, up 2.65% at 29572.74. This risk-on sentiment in equities generally correlates with increased demand for riskier assets and potentially less demand for safe-haven assets like silver, although silver can also act as an inflation hedge. The strong performance in equities might be contributing to the bullish sentiment seen in the shorter timeframes of XAGUSD. However, if this risk appetite were to suddenly evaporate, leading to a sell-off in stocks, we could see a rotation into safe-haven assets, potentially boosting silver prices, especially if the DXY also weakens in such a scenario. The current divergence where equities are up and DXY is slightly down supports the intraday bullish move in silver, but the underlying trend of the DXY and global risk sentiment remains a critical factor.
The Trader's Dilemma: What the Signals Mean
For traders, the current technical setup for XAGUSD presents a classic dilemma: short-term bullish signals conflicting with longer-term bearish trends and weak overall trend strength. The 'General Signal' across multiple timeframes leans towards 'BUY' on the 1-hour and 4-hour charts, driven by strong intraday momentum and positive readings on RSI and Stochastic in those frames. However, the daily chart paints a different story, with a strong downtrend signal and a bearish Stochastic reading. The ADX across all timeframes consistently points to weak or moderate trend strength, indicating that the market is currently in a choppy, range-bound state rather than a clear, trending environment. This means that while short-term traders might find opportunities to buy dips and ride intraday momentum, the risk of a sharp reversal or a failure to break key resistance levels is significant. The overarching message from the indicators is one of caution and a need for confirmation. A strong close above the $59.01 resistance on the 1-hour or 4-hour chart, ideally accompanied by increasing volume and a confirmation from the daily chart, would be needed to validate the bullish short-term signals. Until then, the prevailing neutral to bearish long-term trend suggests that any upside moves might be temporary profit-taking opportunities for bears or short-covering rallies.
Trade Scenarios: Mapping the Possibilities
Given the mixed signals and the critical resistance level at $59.01, let's map out potential scenarios. The probabilities assigned reflect the current technical data, with the bearish scenario carrying a higher weight due to the daily chart's trend.
Bearish Scenario: Retreat from Resistance
60% ProbabilityNeutral Scenario: Consolidation and Range Play
25% ProbabilityBullish Scenario: Breaking the Ceiling
15% ProbabilityThe Path Forward: What to Watch
The immediate focus for XAGUSD traders must be on the $59.01 resistance level. A failure to break this level, especially on the daily chart, would lend significant weight to the bearish scenarios. Look for confirmation through a decisive price action, ideally a strong candlestick pattern or a sustained move above this mark on the 1-hour or 4-hour charts. Increased trading volume accompanying such a move would further bolster the bullish case. Conversely, if silver falters at $59.01, traders should be prepared for a potential pullback towards the support levels identified, starting with $58.58 and then $58.15 on the 4-hour chart. The weak ADX across timeframes suggests that a breakout, if it occurs, might not be a clean, one-directional move. Traders should be mindful of potential volatility and range-bound trading until stronger trend signals emerge. The broader macroeconomic backdrop, particularly movements in the DXY and global risk sentiment, will also play a significant role in shaping silver's trajectory in the coming days.
Economic Calendar and Market Sentiment
While the current price action is heavily influenced by technical factors, macroeconomic events and underlying market sentiment can act as powerful catalysts. The recent news flow shows a mixed bag: some positive analyst ratings for precious metal miners like Freeport-McMoran, and strong earnings for Fresnillo driven by gold and silver prices, suggest underlying strength in the precious metals sector. However, in the forex space, the focus is on inflation and central bank policies. Comments from Fed's John Williams suggest a focus beyond oil shocks towards core inflation trends, implying that central bank decisions will remain data-dependent. Upcoming employment reports for Australia and New Zealand could influence AUD and NZD, which in turn can have ripple effects across the broader currency market and, by extension, precious metals. The pound's recent strength against the dollar, driven by technical patterns and potential economic data, also adds to the currency market's complexity. For silver, any indication of persistent inflation or a shift in central bank hawkishness could either boost its appeal as an inflation hedge or dampen demand if it leads to higher yields and a stronger dollar. Currently, the market sentiment appears cautiously optimistic on shorter timeframes, but the longer-term bearish trend on the daily chart indicates that underlying concerns about economic stability or monetary policy might still be weighing on the asset.
The Importance of Risk Management
In a market environment as nuanced as the current one for XAGUSD, where short-term bullish signals clash with long-term bearish trends and weak overall trend strength, disciplined risk management is paramount. The critical resistance at $59.01 and the support levels around $58.58 and $58.15 are not just price points; they are crucial lines in the sand for managing risk. Traders should consider their position sizing carefully, ensuring that any trade taken allows for sufficient stop-loss placement without exposing an excessive portion of their capital. For instance, if considering a long position on a breakout above $59.01, a stop-loss placed below a key support level, such as $58.58, would be essential. Conversely, if anticipating a rejection at resistance, a short position could be initiated with a stop-loss above the $59.01 to $59.43 resistance zone. The weak ADX readings across timeframes also highlight the importance of avoiding overly aggressive trades and instead focusing on setups with a favorable risk-reward ratio. Patience is key; waiting for clear confirmation signals, especially a decisive break of the $59.01 resistance or a clear rejection leading to a test of daily support, is likely to be more rewarding than chasing volatile intraday moves. The market always provides second chances, and adhering to a well-defined trading plan with strict risk controls is the surest way to navigate these choppy conditions.
FAQ: XAGUSD at the Crossroads
Frequently Asked Questions: XAGUSD Analysis
What happens if XAGUSD fails to break above the $59.01 resistance?
If XAGUSD fails to break above the $59.01 resistance, especially with conviction and volume, it would likely reinforce the bearish sentiment seen on the daily chart. This scenario could lead to a pullback towards the identified support levels, starting with $58.58 and potentially testing $58.15 on the 4-hour timeframe.
Should I buy XAGUSD at current levels near $59.77, given the RSI at 69.63?
Buying at current levels near $59.77 with an RSI of 69.63 carries risk due to the proximity to overbought territory on the 1-hour chart and the significant resistance at $59.01. A more prudent approach would be to wait for a confirmed breakout above $59.01, ideally with strong volume, or a clear rejection at resistance followed by a test of support levels, offering a better risk-reward setup.
Is the Stochastic Oscillator reading of K=82.12 a strong sell signal for XAGUSD?
The Stochastic Oscillator reading of K=82.12 on the 1-hour chart indicates an overbought condition, which is a warning signal for further immediate upside but not necessarily a direct sell signal on its own. When combined with other factors like the approaching resistance at $59.01 and the bearish daily trend, it suggests that upside potential might be limited and a pullback is more probable than a sustained rally from current levels.
How might upcoming employment data from Australia and New Zealand affect XAGUSD this week?
Stronger-than-expected employment data from Australia or New Zealand could strengthen their respective currencies (AUD and NZD). This might indirectly support or pressure XAGUSD depending on the broader market reaction and its correlation with the commodity currencies. If such data leads to a weaker DXY or increased risk appetite, it could provide a tailwind for silver; conversely, if it signals tighter monetary policy leading to higher yields, it could be a headwind.
Track markets in real-time
AI-powered analysis, technical indicators and real-time price data.
Join Our Telegram Channel
Breaking market news, AI analysis and trading signals instantly.
Join Channel