

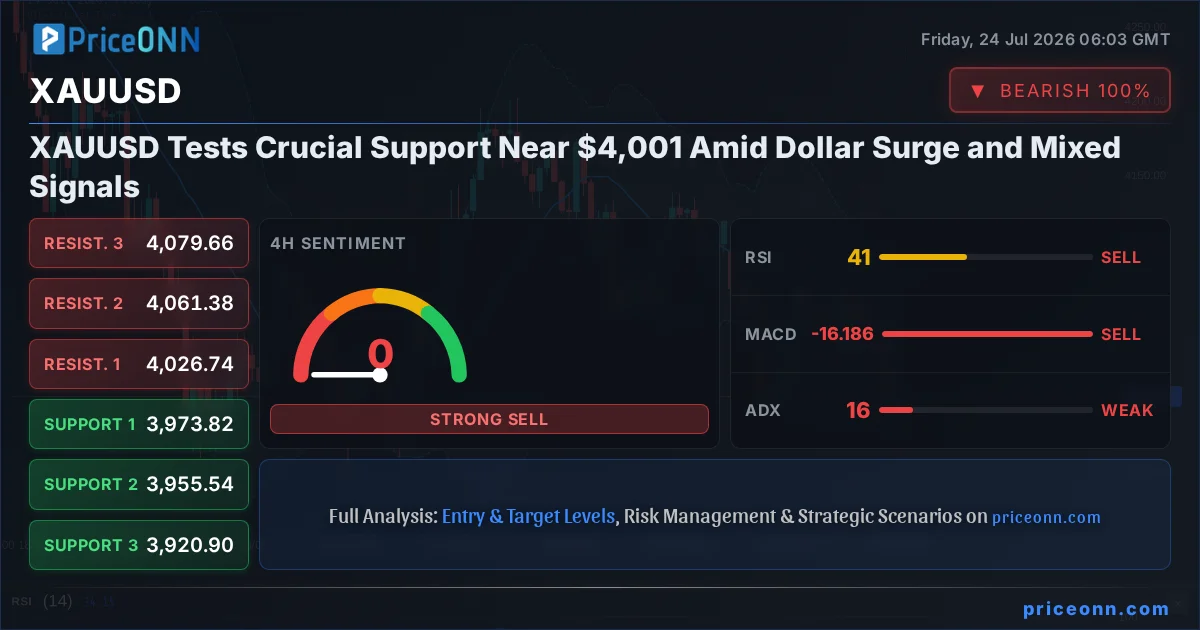
Gold, or XAUUSD, finds itself at a critical juncture, currently trading at precisely $4,001.21. This price point is not just another number; it represents a significant test of support as the US Dollar Index (DXY) stages a notable resurgence. The interplay between gold's traditional role as a safe-haven asset and the dollar's strength, particularly in an environment marked by geopolitical tensions and shifting central bank expectations, creates a complex trading landscape. As traders and investors analyze the current market sentiment, understanding the confluence of technical indicators and macroeconomic drivers becomes paramount in navigating the volatility that gold is currently experiencing. This XAUUSD today analysis delves into the intricate details shaping the yellow metal's immediate future.
- The RSI at 37.81 on the 1-hour chart signals cooling momentum, indicating potential downside pressure for XAUUSD.
- Critical support for XAUUSD sits at $3,991.8, a level that has seen multiple tests this week.
- The ADX at 20.26 on the 1H timeframe suggests a weakening trend, implying consolidation or a potential reversal is on the horizon.
- The strengthening DXY, currently at 100.7, is correlated with pressure on gold prices, reflecting a shift towards the dollar as a preferred safe haven.
The 1-hour technical indicators paint a cautious picture for gold. With the Relative Strength Index (RSI) at 37.81, the momentum is clearly leaning towards a bearish sentiment, although it remains in neutral territory, suggesting that a sharp sell-off isn't immediate but the pressure is mounting. This reading is further corroborated by the MACD, which is exhibiting negative momentum with its signal line firmly above the histogram. The Bollinger Bands also reinforce this view, with the price trading below the middle band, indicating a bearish bias on this shorter timeframe. However, a glimmer of counter-trend optimism appears in the Stochastic oscillator, where the %K line is above the %D line (40.52 vs 37.27), hinting at a potential, albeit weak, upward correction or consolidation. The Average Directional Index (ADX) at 20.26 signifies a moderately trending market, but its lower end suggests the current trend's conviction might be waning, opening the door for range-bound trading or a shift in direction if key levels are breached.
Delving into the 4-hour chart, the picture becomes more decisively bearish. The trend strength is rated at a robust 83%, clearly indicating a prevailing downtrend. Support levels are identified at 3973.82, 3955.54, and 3920.9, levels that traders will be watching closely for any signs of capitulation or a potential bounce. The RSI here is at 40.59, still in neutral territory but reinforcing the downward pressure seen on the 1-hour chart. Similarly, the MACD continues to show negative momentum, and the Bollinger Bands are positioned below the middle band, confirming the bearish outlook. The Stochastic oscillator provides a clearer downside signal, with %K at 18.51 and %D at 31.25, indicating oversold conditions could be approaching, potentially leading to a bounce. However, the ADX at 15.79 suggests that the trend strength itself is weakening on this timeframe, which could imply that the current downtrend might be losing steam and could lead to a period of consolidation before the next significant move. This divergence between the bearish price action and the weakening trend strength indicators warrants close observation.
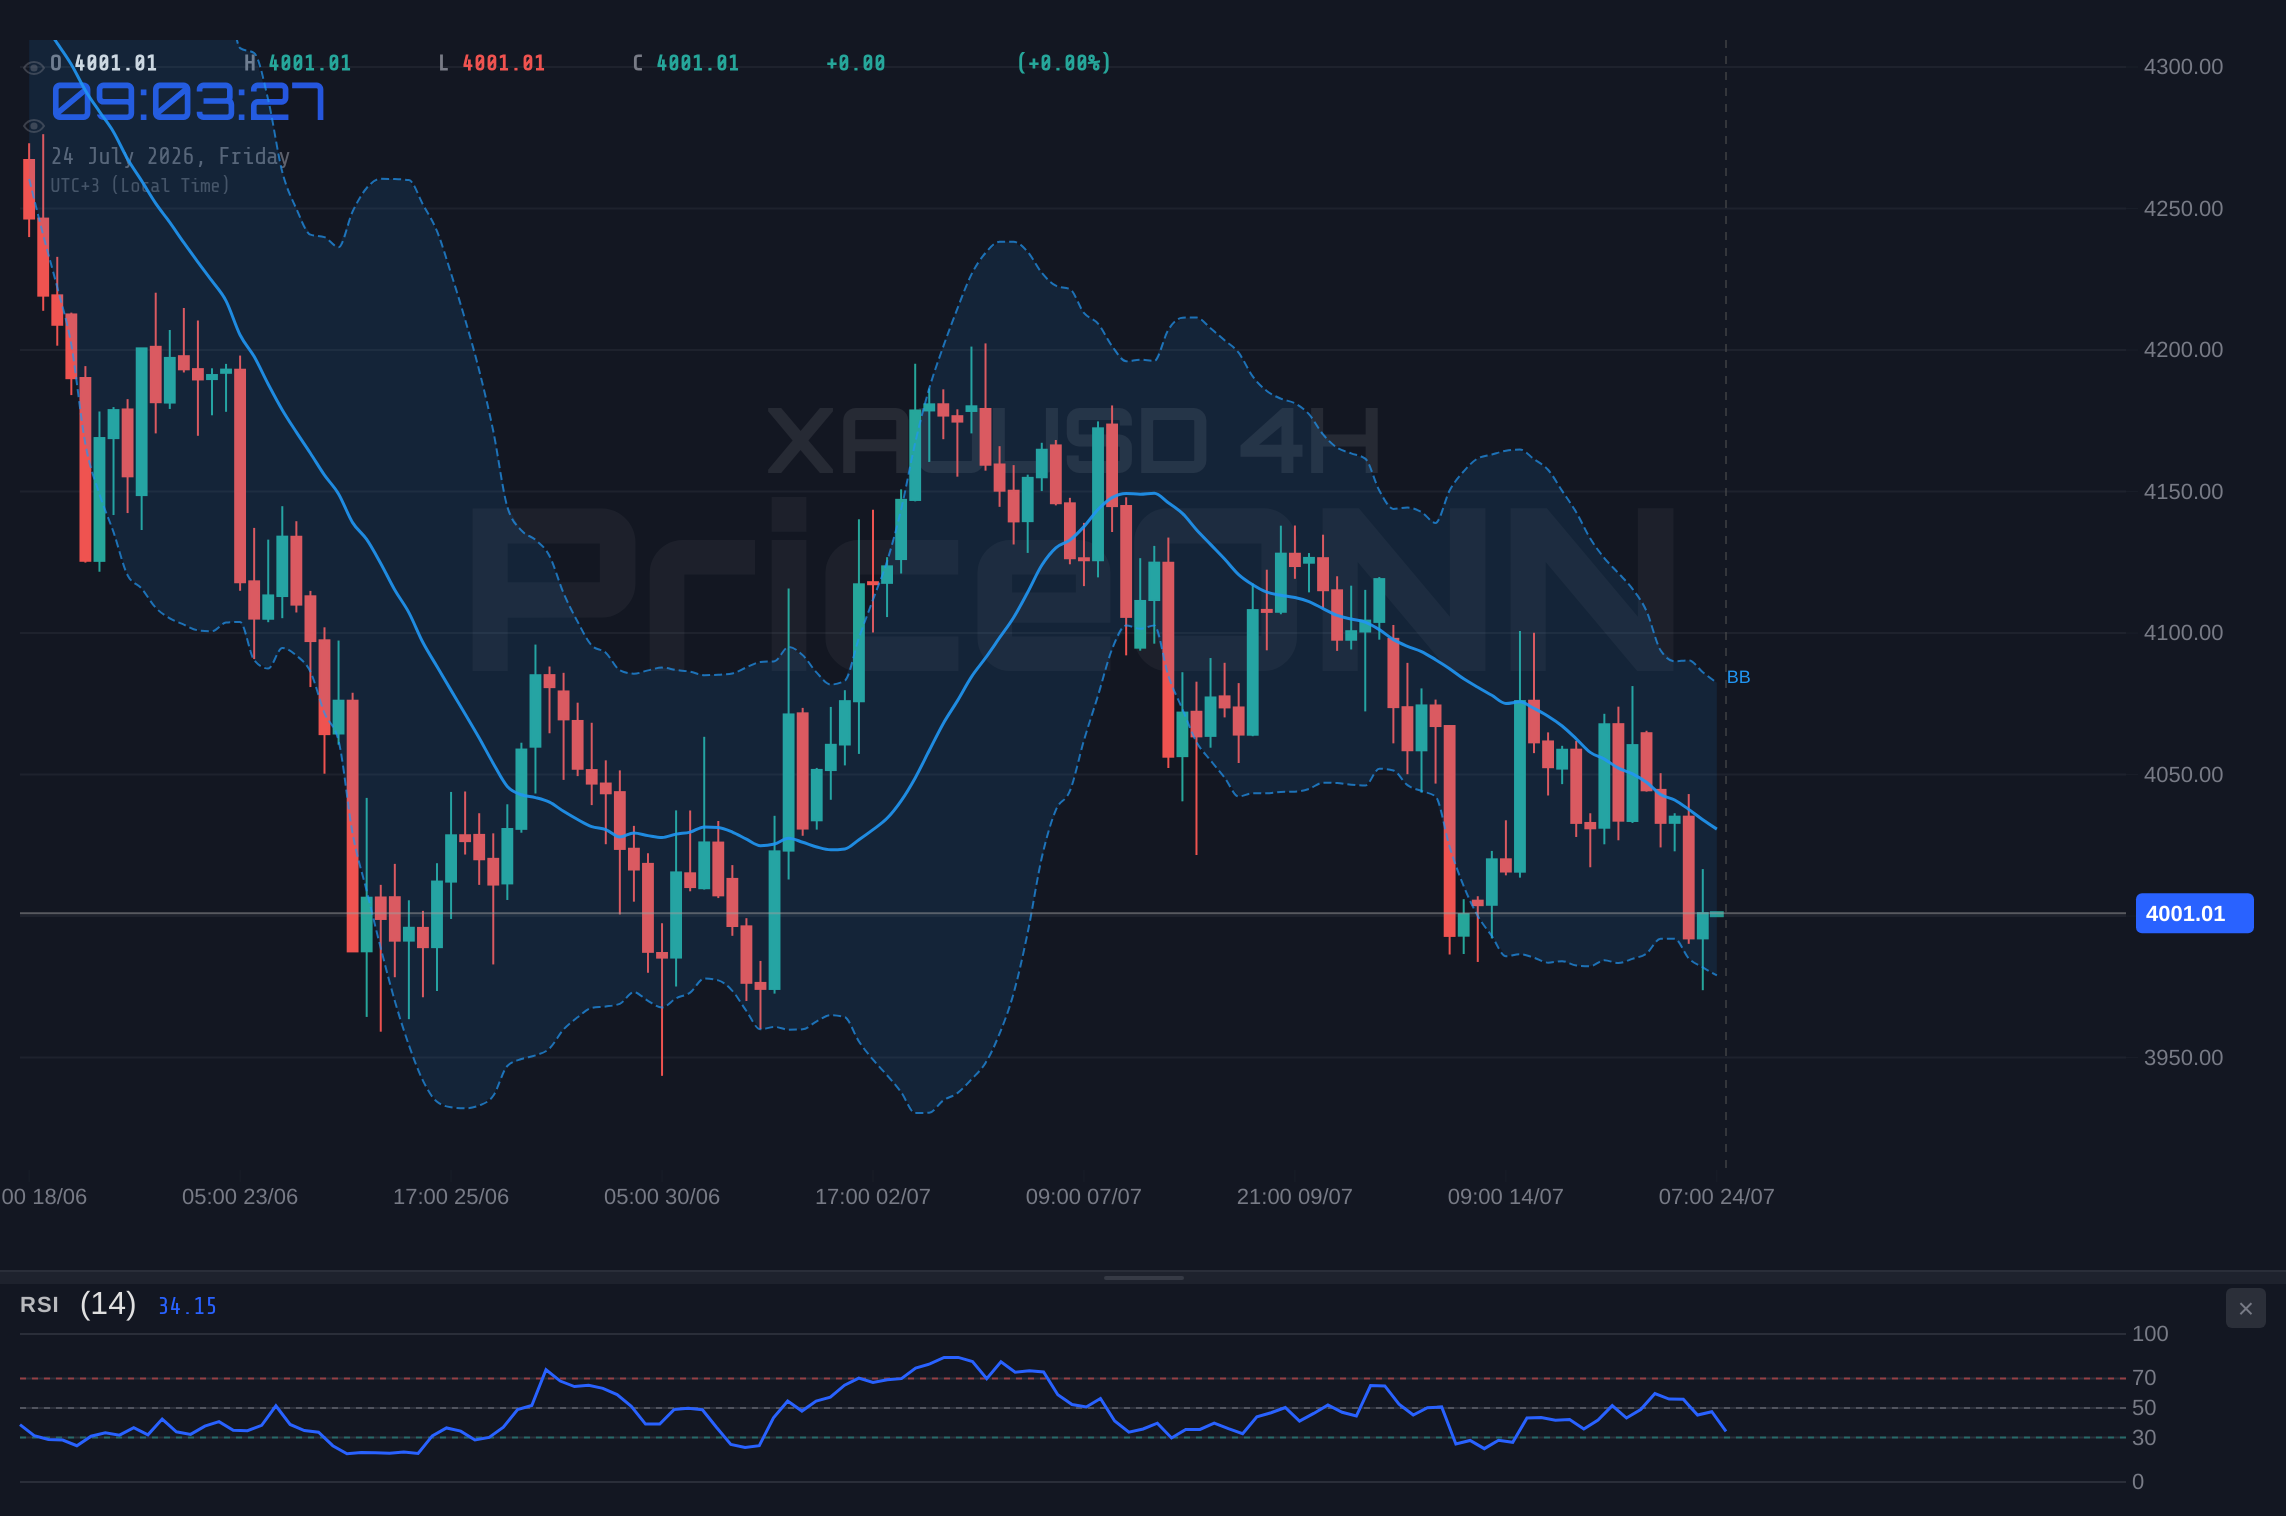
Shifting to the daily timeframe, the trend is definitively bearish, with a strength rating of 95%. This longer-term perspective is crucial for understanding the broader context of gold's current price action. Key support levels to monitor are situated at 4024.67, 3988.95, and 3960.65. The RSI stands at 38.86, continuing the theme of bearish momentum without yet entering oversold territory. A notable divergence appears with the MACD on the daily chart; unlike the shorter timeframes, it is showing positive momentum with the MACD line above its signal line. This suggests that while the price action is bearish, the underlying momentum on a daily scale might be attempting to shift, or this could be a precursor to a bullish divergence if the price continues to fall while momentum indicators begin to turn upwards. The Bollinger Bands remain below the middle band, aligning with the bearish trend. The Stochastic oscillator is in a downtrend signal (%K at 26.18, %D at 44.73), and the ADX at 39.16 confirms a strong trending environment, albeit downwards. This daily picture presents a complex scenario: a clear bearish trend in price action, but with some indicators on shorter timeframes hinting at potential exhaustion or divergence, and the daily MACD showing a flicker of positive momentum.
The correlation with the US Dollar Index (DXY) cannot be overstated in understanding gold's current predicament. With the DXY currently at 100.7, its upward trajectory is exerting significant downward pressure on XAUUSD. A rising dollar generally makes gold more expensive for holders of other currencies, thus dampening demand. This inverse relationship is a fundamental driver in the gold market, and as the dollar strengthens, partly due to expectations surrounding Federal Reserve policy and global economic uncertainty, gold faces headwinds. The recent surge in oil prices, while typically seen as inflationary and supportive of gold, seems to be overshadowed by the dollar's strength and broader market repricing dynamics, as noted in recent energy market commentary. This suggests that the market is prioritizing the dollar's safe-haven appeal over gold's inflation-hedging properties in the immediate term, a dynamic that could persist as long as the dollar remains on a firm footing.
Silver (XAGUSD) is mirroring gold's bearish trend, currently trading at $56.16, down 2.73% on the day. The precious metal has experienced a significant drop, trading within a range of 55.36 to 57.88. On the 1-hour chart, the trend is decisively bearish with a strength of 93%. Support levels are identified at 55.97, 55.68, and 55.42, while resistance is seen at 56.52, 56.77, and 57.06. The RSI at 37.11 indicates bearish momentum, and the MACD shows negative readings. The Stochastic, however, offers a conflicting bullish signal (%K > %D), hinting at a potential short-term bounce. The ADX at 35.29 points to a strong downtrend. The 4-hour and daily charts also show a prevailing bearish trend for silver, with RSI readings in the mid-30s and predominantly bearish signals across indicators, except for some conflicting Stochastic readings suggesting oversold conditions might be near.
Examining the forex market, EURUSD is trading at 1.14436, showing a slight downtrend of -0.13% for the day. The 1-hour chart suggests a neutral trend with some bearish indicators, but the 4-hour and daily charts present a more mixed picture. On the 4-hour, the RSI at 53.17 is in neutral territory with an upward bias, and Bollinger Bands are above the middle band, indicating a potential bullish lean, despite a bearish Stochastic signal. The daily chart shows RSI at 47.95, with positive MACD momentum and Bollinger Bands above the middle band, suggesting a potential for a recovery, though the ADX indicates a strong downtrend. This suggests that while the immediate pressure is downwards, there's underlying support that could lead to a reversal if key resistance levels are breached. The recent news regarding the ECB holding rates unchanged, while closely watching energy shocks and inflation spillovers, adds a layer of complexity. The market seems to be anticipating a hawkish hold, which could support the Euro if the central bank's rhetoric proves firmer than expected.
USDJPY presents a contrasting bullish picture, currently trading at 162.429, up 0.16% on the day. The 1-hour chart shows a neutral trend with strong bullish signals from RSI (66.56) and Stochastic (overbought at 92.72/88.92), though the ADX is weak at 19.33. The 4-hour chart confirms a strong uptrend (95% strength), with RSI at 58.89 and bullish Stochastic signals. The daily chart also leans bullish, with RSI at 60.52 and strong bullish Stochastic readings. This persistent strength in USDJPY, despite its weak ADX on shorter timeframes, suggests underlying demand for the dollar against the yen, possibly driven by interest rate differentials and risk sentiment. The breakout gathering pace, with support forming around 163.20 and 163.50, indicates that bulls are in control, potentially targeting higher levels towards 164.00 as suggested by recent forecasts.
GBPUSD is experiencing a notable downtrend, trading at 1.34773, down 0.45% for the day. The 1-hour chart indicates a neutral trend with bearish signals, including RSI at 41.45 and Stochastic in oversold territory (2.33/12). The ADX at 26.22 signals a strong downtrend. However, the 4-hour and daily charts present a more optimistic outlook, showing neutral trends but with bullish signals from RSI (58.41 and 59.83 respectively) and positive MACD momentum. Bollinger Bands on these longer timeframes are above the middle band, suggesting potential for a recovery. The Stochastic on the daily chart is also showing a bullish signal (73.75/76.02). This divergence between the short-term bearish pressure and the longer-term bullish indicators suggests that the current dip might be a buying opportunity for those with a longer horizon, provided key support levels hold and the broader market sentiment doesn't deteriorate further.
The AUDUSD pair is trading at 0.69991, showing a slight downtrend of -0.09%. The 1-hour chart indicates a bullish trend with weak ADX (12.76), suggesting consolidation rather than a strong directional move. RSI is at 52.03, and Stochastic shows a bearish signal. The 4-hour chart, however, presents a strong bullish trend (92% strength) with RSI at 66.55, suggesting a move into overbought territory could be near. The daily chart is neutral, but with bullish signals from RSI (53.45) and Stochastic (83.94/72.84), and a strong ADX (28.53), indicating a solid uptrend. This suggests that while short-term fluctuations exist, the medium to long-term outlook for AUDUSD appears constructive, likely supported by broader market sentiment and commodity prices.
NZDUSD is also experiencing a slight downtrend, trading at 0.58419, down 0.08%. The 1-hour chart shows a neutral trend with bearish signals, while the 4-hour chart indicates a strong bullish trend (98% strength) with RSI at 67.43. The daily chart is neutral but shows bullish signals from RSI (62.92) and Stochastic (87.88/79.81), coupled with a strong ADX (28.22). This suggests that despite short-term weakness, the underlying trend for NZDUSD is bullish, with potential for upside as it moves towards higher resistance levels. The confluence of bullish signals across multiple timeframes, particularly the strong ADX on the daily chart, indicates a healthy uptrend is in play.
The S&P 500 (SP500) has shown resilience, trading at 6572.87 and up 0.74% for the day, indicating a positive risk appetite. The 1-hour chart shows a strong bullish trend, with RSI in overbought territory (70.95) and Stochastic showing a bearish signal, suggesting potential for a pullback. The 4-hour chart is neutral, but with bullish indicators, while the daily chart shows a bearish trend with RSI at 45.35. This mixed picture across timeframes suggests that while the immediate sentiment is positive, the longer-term trend might be under pressure, especially if correlated assets like the DXY continue to strengthen or if broader market concerns resurface. The Nasdaq 100, however, paints a different story, trading at 29164.86 and down 1.16%, clearly in a bearish trend on multiple timeframes. The RSI is in the low 30s, and the MACD shows negative momentum, indicating significant selling pressure. This divergence between the S&P 500 and Nasdaq 100 warrants attention, as it could signal underlying weakness in the tech-heavy Nasdaq that might eventually spill over into broader markets.
The energy markets are showing some volatility. Brent crude is trading at $83.79, down 0.83%, while WTI is at $79.59, down 1.03%. Recent news highlighted that oil climbed on Middle East escalation, but markets resisted a full risk-off shift. This suggests that while geopolitical tensions are supportive of oil prices, the broader market repricing driven by the dollar's strength and potential inflation concerns is tempering the upside. The 1-hour charts for both Brent and WTI show neutral trends with mixed signals, but the 4-hour and daily charts lean bullish, indicating that the underlying trend for oil might still be upwards, despite the current intraday pullback. The potential for inflation spillovers from higher energy prices remains a key consideration for central banks and, consequently, for gold.
Bitcoin (BTCUSD) is currently trading at $64,629.65, down 0.53% on the day, indicating a pause in its recovery. The 1-hour and 4-hour charts show mixed signals, while the daily chart leans bullish. Similarly, Ethereum (ETHUSD) is trading at $1,877.38, down 2.40%. The 1-hour chart shows a bearish trend, while the 4-hour and daily charts are bullish. The recent news that Bitcoin and Ethereum have paused their recovery underscores the current cautious sentiment in the crypto market. This pause, coupled with the strength in the dollar and the bearish pressure on gold, suggests that risk assets are facing headwinds. For gold, this means that the safe-haven demand might continue to favor traditional assets like the dollar over riskier alternatives or even gold itself, if the dollar's strength is perceived as a more immediate hedge against global uncertainties.
Considering the current technical setup and market correlations, a clear directional trade on XAUUSD is challenging. The daily chart shows a strong bearish trend, but shorter timeframes exhibit conflicting signals, including potential bullish divergence on the MACD and oversold conditions on the Stochastic. The crucial support level to watch is $3,991.8. A decisive break below this level, especially with confirmation from the DXY holding firm above 100.7, would likely trigger further downside towards the $3,976.78 support. Conversely, if gold manages to reclaim the $4,019.21 resistance level and hold it, coupled with a potential pullback in the DXY, it could signal a short-covering rally. However, the prevailing trend and the dollar's strength suggest that any upward moves might be met with selling pressure. Therefore, patience is key, waiting for a clearer signal or a confirmed break of a significant level.
Bearish Scenario: Downside Acceleration
65% ProbabilityNeutral Scenario: Consolidation and Choppiness
25% ProbabilityBullish Scenario: Short-Covering Rally
10% ProbabilityFrequently Asked Questions: XAUUSD Analysis
What happens if XAUUSD breaks below the $3,991.8 support level?
A break below $3,991.8, especially with the DXY holding strong near 100.7, would likely signal further downside for gold. This could lead to tests of the $3,976.78 support, with a potential extension towards $3,964.39 if selling pressure intensifies.
Should I buy XAUUSD at current levels of $4,001.21 given the mixed technical signals?
Buying at current levels is risky due to the prevailing bearish trend and dollar strength. A more prudent approach would be to wait for a confirmed break above $4,019.21 resistance or a clear signal of reversal on the daily chart, possibly after a test of $3,991.8 support. Patience is advised.
Is the RSI at 37.81 a sell signal for XAUUSD right now?
An RSI of 37.81 on the 1-hour chart indicates bearish momentum but is not yet in oversold territory. While it suggests downward pressure, it doesn't automatically signal a sell. Confirmation from price action breaking key support levels like $3,991.8 would strengthen the bearish case.
How will the strengthening DXY at 100.7 affect XAUUSD this week?
The rising DXY at 100.7 typically exerts downward pressure on gold prices, making them more expensive for foreign buyers. This correlation suggests that continued dollar strength could hinder any significant rallies in XAUUSD, potentially keeping prices capped near resistance levels like $4,019.21.
| Indicator | Value | Signal | Interpretation |
|---|---|---|---|
| RSI (14) | 37.81 | Bearish Momentum | Neutral Zone |
| MACD Histogram | -15.20 | Negative Momentum | Below Signal Line |
| Stochastic (%K/%D) | 40.52 / 37.27 | Bullish Crossover | Potential Bounce |
| ADX | 20.26 | Weakening Trend | Choppy Market |
| Bollinger Bands | Mid Band | Below Mid Band | Bearish Pressure |
The current technical condition presents a 'WATCH_ZONE' scenario for XAUUSD. The ADX at 20.26 on the 1-hour chart indicates that the market is choppy and ranging, making any trade plan inherently risky. While the RSI and MACD histogram are aligned with a clear directional signal towards the downside, the Stochastic oscillator is showing a potential for a short-term bounce. A valid setup would require a clearer commitment from the market. Specifically, a daily close above the critical resistance level of $4,019.21, especially if accompanied by a weakening DXY, would open the door for a potential short-covering rally. Until then, caution and patience are advised, waiting for the market to provide a more definitive direction or a confirmed break of the key support at $3,991.8.
Track markets in real-time
AI-powered analysis, technical indicators and real-time price data.
Join Our Telegram Channel
Breaking market news, AI analysis and trading signals instantly.
Join Channel