

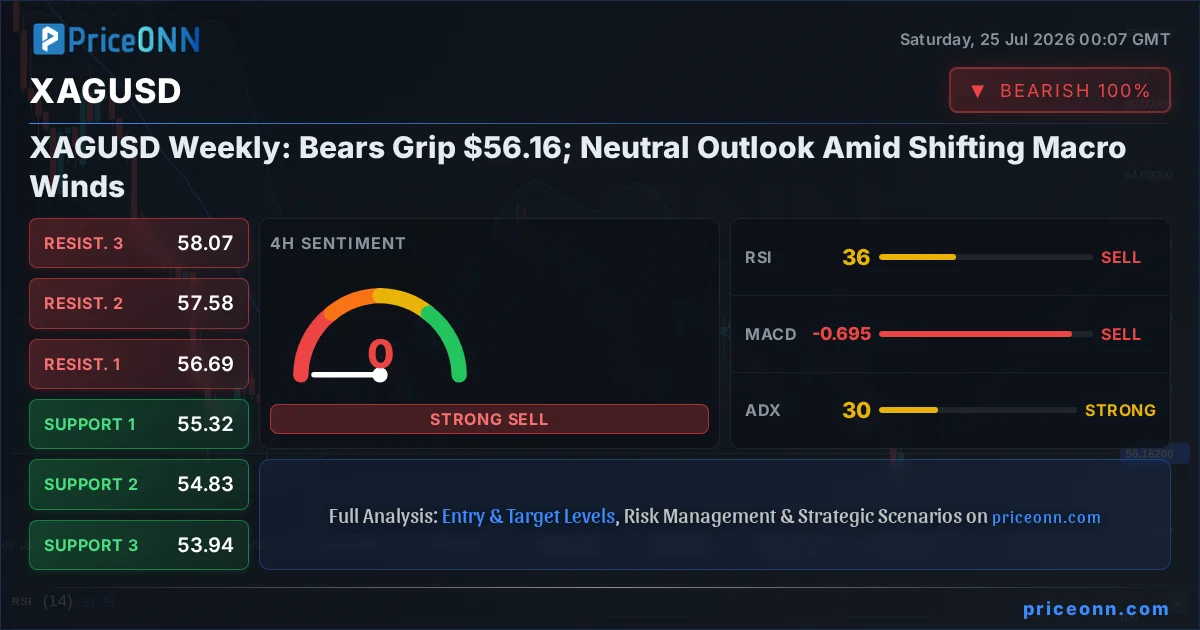
The past week has seen silver, or XAGUSD, dance precariously around the $56.16 mark, a level that now represents a critical pivot point for the precious metal. As traders step back to assess the broader economic landscape following a tumultuous period, the outlook for silver remains decidedly neutral, caught between persistent inflation concerns and the evolving narrative around central bank monetary policy. This past week, in particular, has been a masterclass in market digestion, with key economic releases and geopolitical undercurrents creating a complex tapestry for silver's next move. The correlation with the US Dollar Index (DXY), currently hovering around 100.7, and the broader risk appetite reflected in indices like the S&P 500 (trading around 6572.87) and the Nasdaq (at 29164.86), provides crucial context for understanding the forces at play. While gold has seen significant downward pressure, silver’s own price action at $56.16 warrants a closer look, examining the interplay of fundamental drivers and technical signals that will shape its trajectory in the coming week.
- Silver is trading around $56.16, caught between inflation pressures and central bank policy signals.
- The DXY is at 100.7, influencing gold and major currency pairs, and indirectly impacting silver's safe-haven appeal.
- Key support for XAGUSD is identified at $55.97, while resistance looms around $56.52 on the 1-hour chart.
- The 1-day RSI at 34.24 suggests oversold conditions are developing, but a clear trend reversal is yet to materialize.
The narrative surrounding silver has become increasingly intricate, moving beyond simple supply and demand dynamics to encompass a wider array of macroeconomic factors. Last week’s developments, including the continued rally in Brent crude oil prices towards $83.79 and the persistent focus on central bank actions, have created a complex environment. The Federal Reserve, in particular, remains under scrutiny, with market participants recalibrated expectations for interest rate paths. The latest data suggests a hawkish tilt might be on the horizon, a move that could bolster the dollar and, consequently, exert pressure on commodities like silver. This interplay between monetary policy, inflation expectations, and geopolitical tensions is the primary driver shaping silver's current neutral stance around the $56.16 level. Understanding these macro forces is paramount for anyone looking to navigate the silver market in the short to medium term.
The recent surge in oil prices, with Brent crude nearing the $83.79 level, has undeniably reintroduced inflation fears into the market's calculus. This is a critical factor for silver, which has historically been viewed as an inflation hedge. When oil prices climb significantly, they tend to push up inflation expectations, which in turn can boost demand for precious metals. However, this relationship isn't always straightforward. The market's reaction also depends heavily on central bank policy. If central banks, like the Federal Reserve, perceive rising oil prices as a significant inflationary threat, they may respond with more aggressive interest rate hikes. This hawkish response can strengthen the US dollar (currently around 100.7 on the DXY), making dollar-denominated assets like silver more expensive for holders of other currencies. This dynamic creates a tug-of-war effect, where the inflationary impulse from oil is partially offset by the tightening monetary policy response, leaving silver in a state of indecision around the $56.16 mark. The market is thus caught between the immediate inflationary impact of higher energy costs and the longer-term implications of potential central bank tightening.
Central bank policy, particularly that of the US Federal Reserve, continues to be a dominant theme influencing global markets, and silver is no exception. The recent recalibration of interest rate expectations, with markets now pricing in a more hawkish stance, has had a palpable effect. A stronger dollar, driven by higher anticipated interest rates, typically puts downward pressure on commodities priced in dollars, including silver. For XAGUSD, trading at $56.16, this means that any further indication of aggressive monetary tightening from the Fed could lead to increased selling pressure. Conversely, if the Fed signals a more dovish approach or a pause in rate hikes, it could provide a tailwind for silver. The upcoming economic calendar, with key inflation and employment data releases on the horizon, will be crucial in shaping these expectations and, consequently, the direction of silver prices. Traders are closely watching for any signals that might indicate a shift in the Fed's stance, as this will be a primary determinant of silver's short-term trajectory.
The correlation between silver and the US Dollar Index (DXY) is a well-established relationship, and current market dynamics highlight its continued importance. With the DXY trading around 100.7, a level that indicates a relatively strong dollar, it naturally exerts downward pressure on dollar-denominated assets like silver. This inverse correlation means that as the dollar strengthens, silver tends to become more expensive for international buyers, potentially dampening demand and leading to price declines. Conversely, a weaker dollar often supports higher silver prices. The market is currently navigating a period where the DXY is showing upward momentum, partly influenced by expectations of continued Fed tightening. This strengthens the argument for caution on the bullish side for XAGUSD, especially as it hovers around $56.16. Any significant shift in the DXY's trajectory, whether driven by Fed policy changes or broader global economic sentiment, will likely have a direct and immediate impact on silver's price action.
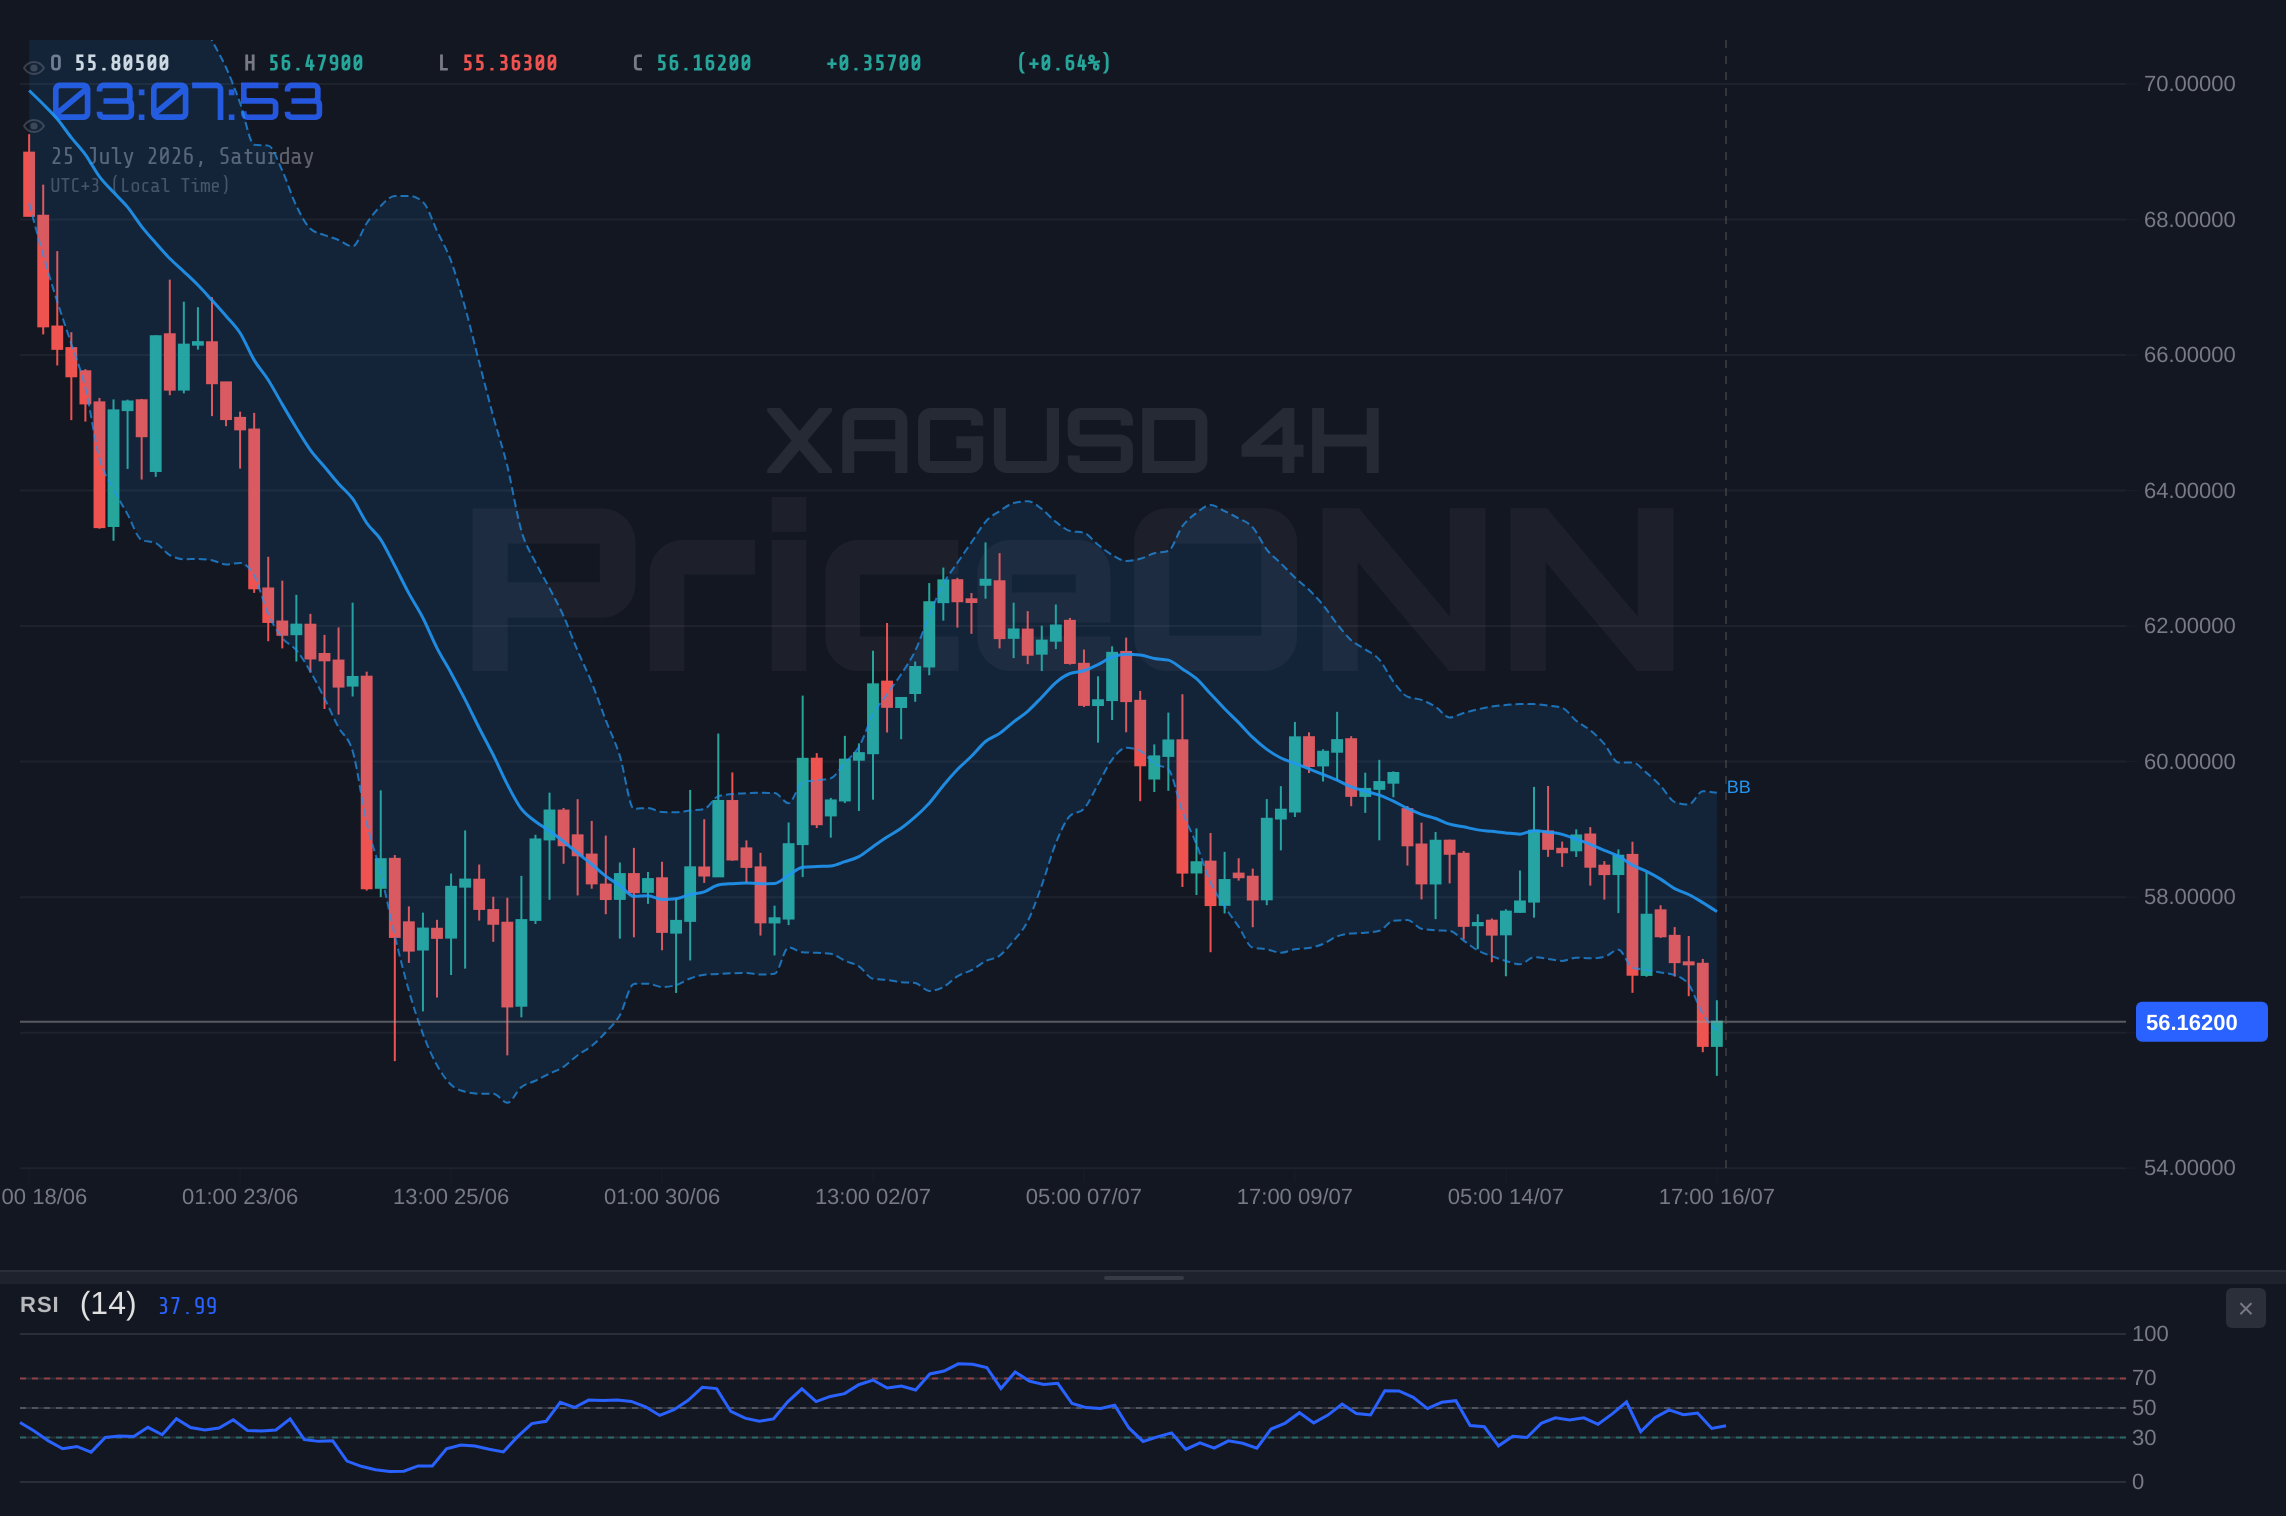
Looking at the technical indicators on the 1-hour chart for XAGUSD, the picture is one of cautious indecision, with a slight lean towards bearish momentum. The current price of $56.16 is trading below the middle Bollinger Band, suggesting a bearish inclination in the short term. The RSI(14) at 37.81, while in the neutral zone, is trending downwards, indicating that selling pressure might be building. Similarly, the MACD is displaying negative momentum, with the MACD line below the signal line. However, the Stochastic indicator offers a conflicting signal, showing %K (40.52) above %D (37.27), which typically suggests a potential for upward movement. The ADX at 20.26 indicates a moderately strong downtrend, reinforcing the bearish sentiment. The overall signal leans towards 'SELL', with 7 sell signals against only 1 buy signal. This mixed technical picture around the $56.16 level suggests that short-term traders should exercise caution, awaiting clearer directional cues.
The 4-hour timeframe for XAGUSD presents a more definitive bearish trend, reinforcing the caution observed on the shorter timeframe. The price at $56.16 is firmly below the middle Bollinger Band, and the RSI(14) at 40.59 continues to trend downwards, signaling weakening buying interest. The MACD is also in negative territory, below its signal line, confirming bearish momentum. The Stochastic indicator, with %K at 18.51 and %D at 31.25, strongly indicates a downward trend, with %K below %D and in oversold territory. The ADX reading of 15.79 suggests a weak trend overall, which can sometimes precede a more significant move, but in this context, it aligns with the prevailing bearish sentiment. The overwhelming 'SELL' signal (8 sell, 0 buy) on this timeframe underscores the pressure on silver. The key support levels to watch on this chart are $55.32, $54.83, and $53.94, while resistance is seen at $56.69, $57.58, and $58.07. The current price of $56.16 sits precariously close to the immediate support, making a breakdown a tangible possibility.
Shifting to the daily timeframe, the technical indicators paint a consistent picture of a prevailing downtrend for XAGUSD, with the price currently at $56.16. The RSI(14) stands at 38.86, remaining in the neutral zone but exhibiting a bearish tendency. The MACD, however, shows positive momentum with the MACD line above the signal line, which is a slight divergence from the shorter timeframes and could indicate potential underlying buying interest or a weakening of the bearish trend. The Bollinger Bands are positioned below the middle band, reinforcing the bearish outlook. The Stochastic oscillator, with %K at 26.18 and %D at 44.73, signals a downtrend, with %K below %D. The ADX at 39.16 indicates a strong downtrend, substantiating the bearish sentiment. The overall signal on the daily chart is 'SELL' (7 sell, 1 buy), aligning with the longer-term trend. The crucial support levels to monitor are $40.24, $39.88, and $39.60, while key resistance levels are established at $40.88, $41.17, and $41.53. Despite the strong daily trend, the conflicting MACD signal warrants attention for potential shifts in momentum.
The interplay of these technical signals across different timeframes suggests a market at a crossroads for silver. While the 4-hour and 1-day charts clearly indicate a bearish trend, the conflicting MACD on the daily chart and the Stochastic's attempt at a recovery on the 1-hour chart introduce an element of uncertainty. The current price of $56.16 is a key battleground. A break below the immediate support levels, particularly the 1-hour support at $55.97 and the 4-hour support at $55.32, would confirm the bearish bias and likely lead to further downside. Conversely, a sustained move above the 1-hour resistance at $56.52, supported by improving momentum indicators and a potential shift in the broader market sentiment, could signal a short-term reversal. However, given the prevailing downtrend and the pressure from a strengthening dollar and rising oil prices feeding into inflation concerns, the path of least resistance appears to be downwards in the immediate term.
Delving deeper into the fundamental drivers, the recent geopolitical tensions, particularly those involving the Middle East and the potential for increased oil supply disruptions, add another layer of complexity. Brent crude oil's ascent towards $83.79 has reignited inflation risks, which traditionally benefits silver as a safe-haven asset. However, as noted, this inflationary impulse is being countered by the prospect of tighter monetary policy. The market's reaction to these competing forces is crucial. If geopolitical risks escalate significantly, they could override the impact of Fed policy, driving safe-haven demand for silver despite higher interest rates. Conversely, if diplomatic efforts de-escalate tensions, the focus would return squarely to monetary policy, potentially favoring a stronger dollar and weaker silver prices. The binary nature of these geopolitical risks introduces significant volatility, making it challenging to predict silver's precise movement but underscoring the importance of monitoring news flow closely.
The weekly outlook for XAGUSD at $56.16 hinges on the resolution of these competing forces. From a technical standpoint, the daily chart shows a strong downtrend (ADX 39.16), but the MACD's positive momentum suggests potential for a bounce. The 1-hour chart shows a neutral-to-bearish bias, with key support at $55.97 and resistance at $56.52. The 4-hour chart is more decisively bearish, with support at $55.32 and resistance at $56.69. The overall market sentiment, influenced by the DXY at 100.7 and the S&P 500 at 6572.87, leans towards caution, with risk appetite waning. Upcoming economic data, particularly inflation figures and Fed commentary, will be critical in determining whether the inflationary pressures from oil continue to support silver or if the prospect of higher interest rates will lead to a further dollar rally and a breakdown below the $56.16 key level.
Looking ahead, the economic calendar is packed with events that could significantly influence silver's price. Key inflation data releases, such as CPI and PPI reports, will provide crucial insights into the persistence of inflationary pressures. These figures will, in turn, heavily influence the Federal Reserve's monetary policy decisions. Market participants will be scrutinizing every word from Fed officials for clues about future interest rate hikes or pauses. The correlation with the DXY and equity markets will remain a critical factor. A sustained rise in the DXY above 100.7 could spell further trouble for silver, while a weakening dollar might offer some respite. Geopolitical developments, especially concerning oil supply and global stability, will also act as a wildcard. For silver to break its current neutral stance around $56.16, a clear catalyst – either a significant shift in Fed policy, a major geopolitical event, or a decisive break of key technical levels – will be required.
The current technical configuration for XAGUSD, trading around $56.16, presents a complex picture with mixed signals across different timeframes. On the 1-hour chart, the trend is neutral with a slight bearish lean, indicated by the RSI at 37.81 and MACD showing negative momentum. Support is found at $55.97, with resistance at $56.52. The 4-hour chart leans more bearish, showing a strong downtrend with RSI at 40.59 and Stochastic in oversold territory. Crucially, the daily chart displays a strong downtrend (ADX 39.16), yet the MACD shows positive momentum, suggesting a potential for a short-term reversal or at least a weakening of the bearish pressure. The key resistance levels to watch on the daily chart are $40.88 and $41.17, while support lies at $40.24 and $39.88. This divergence between the longer-term downtrend and the potential for short-term recovery, coupled with the conflicting signals from indicators like the MACD and Stochastic, creates a neutral outlook around the $56.16 price point. The market appears to be waiting for a clearer directional cue from macroeconomic data or geopolitical events.
The critical support level to monitor closely for XAGUSD is around $55.97 on the 1-hour chart, and further down at $55.32 on the 4-hour chart. A decisive close below these levels would likely confirm the bearish sentiment and could trigger a move towards the next support zones. On the resistance side, the $56.52 level on the 1-hour chart and $56.69 on the 4-hour chart are key hurdles. A sustained break above these points, particularly if accompanied by positive shifts in broader market sentiment and a weakening dollar, could signal a potential upward correction. However, the prevailing downtrend on the daily chart, supported by a strong ADX of 39.16, suggests that any upward moves might be met with selling pressure. The current price of $56.16 represents a point of equilibrium where these opposing forces are currently balanced, leading to the neutral outlook.
From a fundamental perspective, the narrative is dominated by the ongoing tug-of-war between inflation and monetary policy. The elevated price of Brent crude oil near $83.79 continues to fuel inflation concerns, which historically benefits silver. However, the market's expectation of a hawkish Federal Reserve, reflected in the DXY's current position around 100.7, acts as a significant counterforce. Investors are keenly awaiting upcoming economic data, such as inflation reports and employment figures, which will likely dictate the Fed's next move and, consequently, silver's direction. Geopolitical risks also remain a significant factor, capable of triggering safe-haven flows into silver, potentially overriding other concerns. The absence of a clear directional bias from these macro factors, combined with mixed technical signals across timeframes, solidifies the neutral outlook for XAGUSD at $56.16 as we head into the next trading week.
The market sentiment surrounding silver, currently trading at $56.16, can be described as cautiously watchful. While the underlying downtrend on the daily chart is evident, the conflicting signals on shorter timeframes and the persistent inflation concerns provide a basis for potential short-term stabilization or even a mild recovery. The correlation with the DXY at 100.7 and broader equity markets like the S&P 500 at 6572.87 suggests that any significant shifts in risk appetite or dollar strength will be closely mirrored by silver. The market is in a state of anticipation, waiting for definitive guidance from upcoming economic data and central bank communications. Until then, silver is likely to remain range-bound, with traders closely watching the key support at $55.97 and resistance at $56.52.
The recent PriceONN market news highlights the ongoing tension. Reports from July 24th indicated that 'Gold and Silver Tumble as Oil Link Returns; Trump’s Looming Decision on Iran Adds Binary Risk.' This underscores the dual nature of the market: oil prices can support silver due to inflation, but geopolitical risks, like potential US-Iran developments, can introduce sharp volatility and binary outcomes. Another report from July 22nd noted, 'Silver Price Forecast: XAG/USD rises to near $60.00 despite surging inflation fears,' suggesting that even with inflation fears, the price action can be complex, potentially driven by factors other than just inflation hedging. This reinforces the idea that while oil's influence is present, it's not the sole determinant, and other macro factors, including Fed policy, are actively shaping the price around the $56.16 level. The market is clearly navigating multiple, sometimes conflicting, narratives.
The critical support levels for XAGUSD remain anchored around the $55.97 and $55.32 marks, derived from the 1-hour and 4-hour technical charts respectively. A decisive breach of these levels would signal a continuation of the bearish trend, potentially opening the door for a move towards deeper support zones. On the upside, resistance is forming around $56.52 (1-hour) and $56.69 (4-hour). Breaking and holding above these resistance levels would be necessary to challenge the prevailing bearish sentiment, especially on the daily chart where the ADX indicates a strong downtrend. The current price of $56.16 sits precisely in the middle of these immediate technical boundaries, reflecting the market's indecision and the neutral outlook. Traders will be watching these levels intently for any signs of a breakout or breakdown in the coming trading sessions.
The divergence in signals across timeframes is a key aspect of silver's current predicament. The 1-hour chart shows a neutral trend with a weak attempt at recovery by Stochastic, while the 4-hour and daily charts clearly depict a downtrend, albeit with a conflicting MACD signal on the daily chart. This technical ambiguity, coupled with the fundamental crosscurrents of inflation concerns versus central bank tightening expectations, creates a challenging environment for clear directional trades. The price action around $56.16 is likely to remain choppy until a more definitive catalyst emerges. The market is essentially in a holding pattern, weighing the inflationary potential of rising oil prices against the dampening effect of a strong dollar and potential interest rate hikes.
Silver at $56.16 is navigating a complex macroeconomic and technical landscape. The persistent inflation narrative, fueled by rising oil prices, is counterbalanced by the prospect of tighter monetary policy from the Federal Reserve, which supports a stronger dollar and puts pressure on commodities. Technically, while longer-term charts show a downtrend, shorter-term indicators offer mixed signals, creating a neutral outlook. Key support lies at $55.97 and resistance at $56.52. The coming week's economic data and central bank commentary will be crucial in determining whether silver can overcome the current headwinds or if further downside is imminent. Patience and risk management will be paramount for traders navigating this uncertain environment.
Frequently Asked Questions: XAGUSD Analysis
What happens if XAGUSD breaks below $55.97 support?
A break below the $55.97 support level on the 1-hour chart would likely confirm the bearish bias, potentially leading to a move towards the next support at $55.32. This scenario is supported by the prevailing downtrend on longer timeframes.
Should I buy XAGUSD at current levels of $56.16 given the neutral outlook?
Buying at current levels of $56.16 is speculative given the neutral outlook and conflicting signals. A more prudent approach would be to wait for a clear break above resistance at $56.52 or a confirmed bounce from stronger support levels, accompanied by improving technical momentum.
Is the RSI at 37.81 a sell signal for XAGUSD right now?
An RSI of 37.81 on the 1-hour chart indicates a neutral-to-bearish leaning, as it's below 50 and trending down. While not definitively oversold, it suggests limited buying pressure and supports a cautious approach, especially when viewed alongside other bearish indicators.
How will upcoming Fed policy decisions affect XAGUSD this week?
Upcoming Fed policy signals are critical. A hawkish stance, implying potential rate hikes, would likely strengthen the DXY (currently 100.7) and pressure XAGUSD below $56.16. Conversely, a more dovish tone could weaken the dollar and support silver prices.
Track markets in real-time
AI-powered analysis, technical indicators and real-time price data.
Join Our Telegram Channel
Breaking market news, AI analysis and trading signals instantly.
Join Channel