

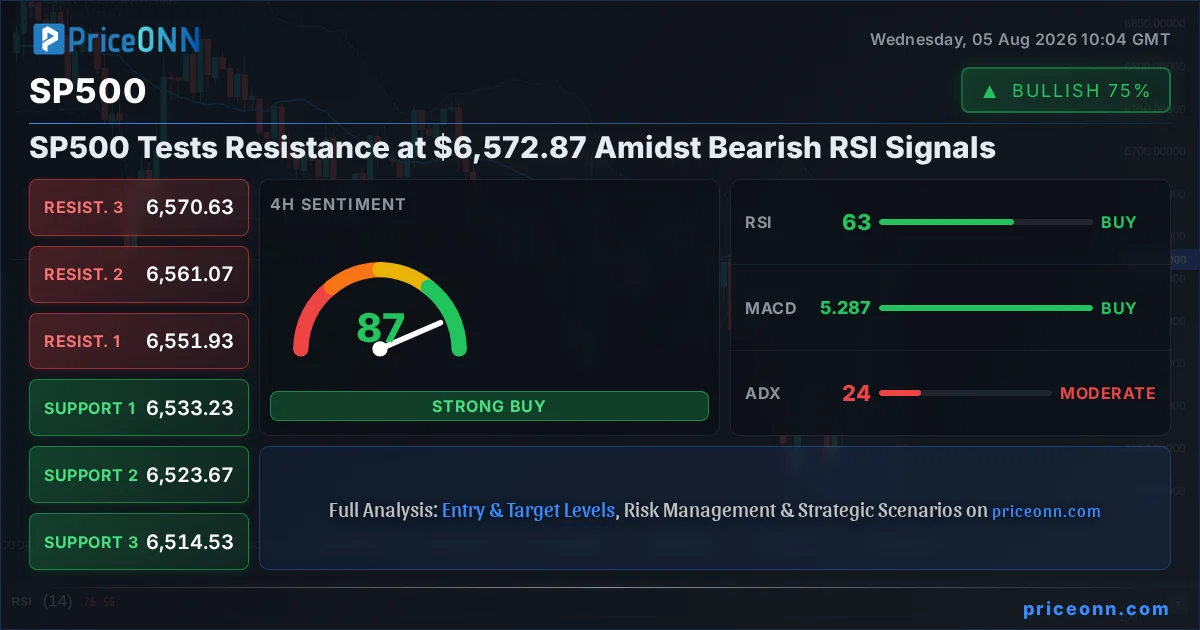
The S&P 500 (SP500) is currently navigating a critical juncture, trading at approximately $6,572.87. This price point represents a significant area of resistance, where the market's next directional conviction will likely be forged. The index has demonstrated resilience, staging a notable recovery from its recent lows, but the underlying technical indicators present a mixed picture, hinting at potential headwinds ahead. Understanding the interplay between these technical signals and the broader market context is paramount for traders aiming to navigate the upcoming price action effectively. This analysis delves into the multi-timeframe technicals, exploring the implications of current indicator readings and price action for the S&P 500.
- The S&P 500 is currently trading at $6,572.87, testing a key resistance level.
- On the 1-hour chart, the ADX at 49.72 indicates a strong upward trend, but the RSI at 70.95 signals overbought conditions, suggesting potential for a pullback.
- The daily chart shows a bearish divergence with RSI at 45.35, indicating weakening momentum despite the index's recent gains.
- Correlation analysis shows the DXY at 99.84 is currently trending downwards, which typically supports risk assets like the S&P 500, but this is being countered by internal index weakness.
Navigating the Resistance Zone
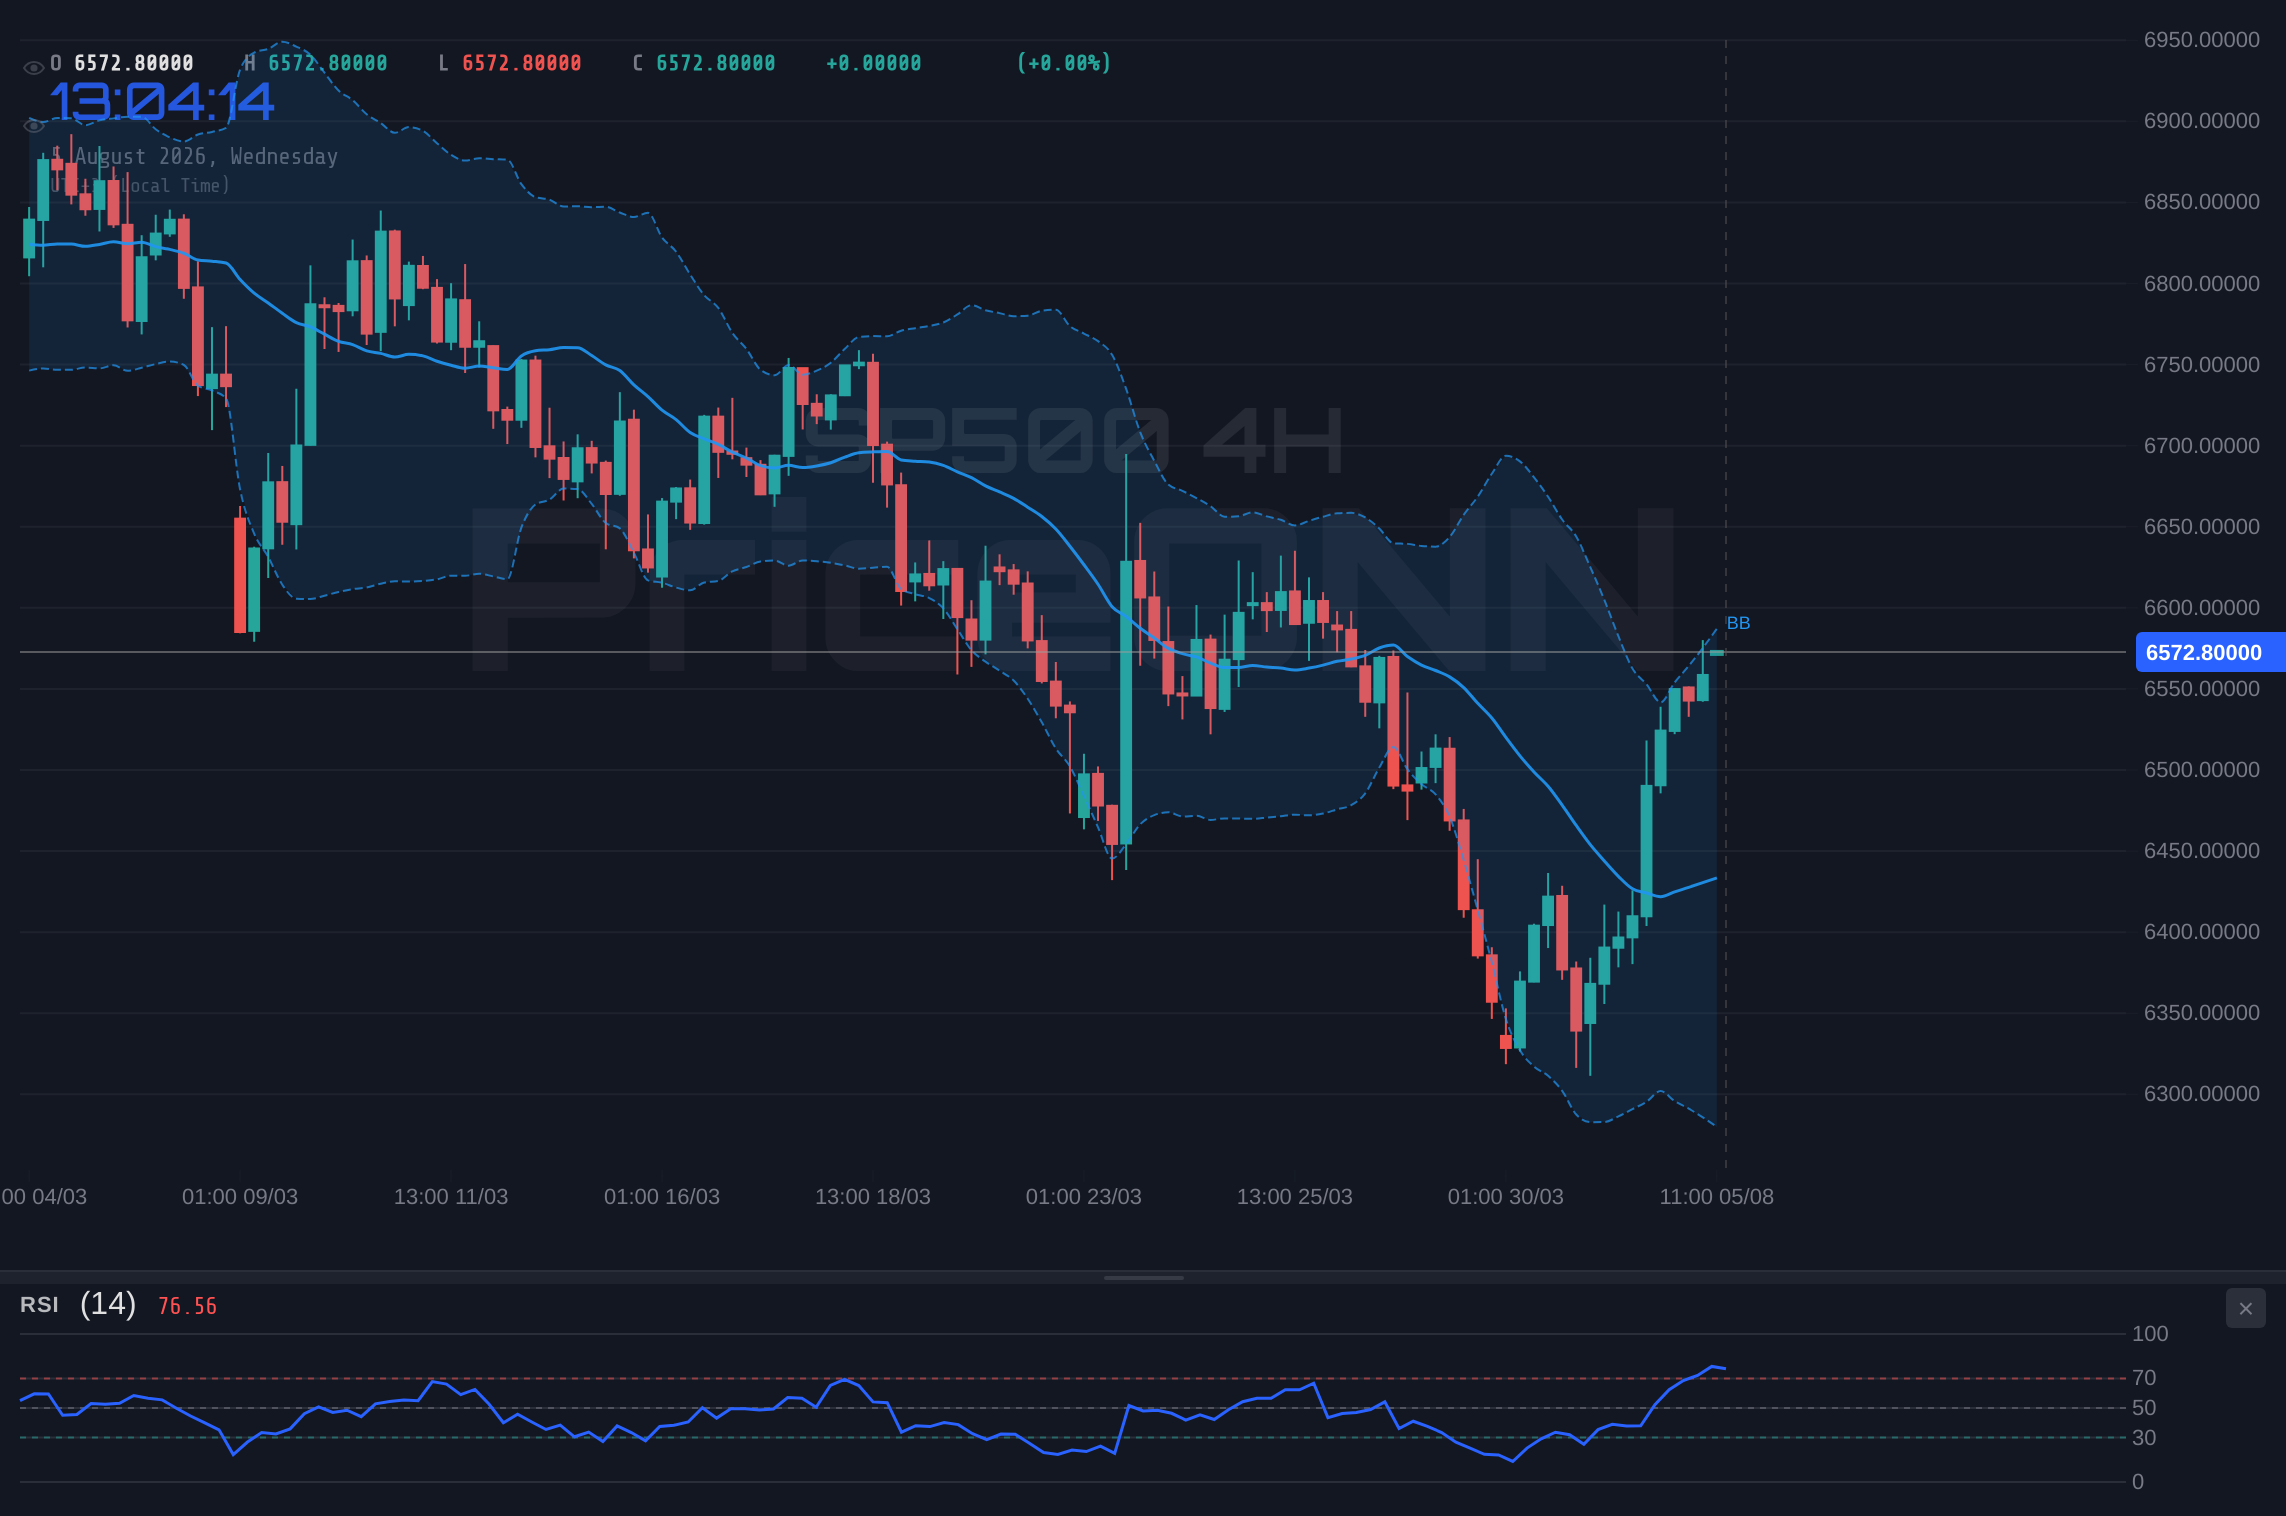
The S&P 500's ascent towards the $6,572.87 mark has been characterized by a strong showing on the shorter timeframes, particularly the 1-hour chart. Here, the trend strength indicator, ADX, stands at a robust 49.72, signalling a powerful prevailing trend. This technical reading suggests that the upward momentum driving the index has been significant and committed. Complementing this, the MACD indicator on the 1-hour timeframe also displays positive momentum, with the MACD line positioned above its signal line. This confluence of bullish signals on the intraday charts paints a picture of immediate upward pressure, suggesting that buyers have been in control during recent trading sessions. The index has managed to trade above its intraday middle Bollinger Band, further reinforcing the short-term bullish sentiment. However, this immediate optimism is tempered by the RSI(14) reading of 70.95 on the same timeframe, which firmly places the index in overbought territory. This suggests that the recent rally may be approaching exhaustion, and a period of consolidation or even a short-term pullback could be on the cards before the next significant move.
The Stochastic Oscillator on the 1-hour chart, with %K at 65.73 and %D at 73.5, also hints at a potential cooling-off period. While not yet in extreme overbought territory, the %K line is below the %D line, which can sometimes signal a shift in momentum. Despite these short-term cautionary signals, the overall 'AL' (Buy) signal across most intraday indicators on the 1H chart underscores the immediate strength buyers have exhibited. This battle between strong trend strength and overbought conditions at resistance is a common theme in markets, and the resolution will be key to determining the near-term direction.
The Daily Chart's Cautionary Tale
Shifting focus to the daily chart, a more nuanced and potentially bearish perspective emerges. While the 1-hour chart paints a picture of immediate strength, the daily RSI(14) reading of 45.35 indicates a rather bearish sentiment, suggesting that despite recent price action, underlying momentum on a daily basis is not as robust as intraday charts might suggest. This divergence between short-term bullish signals and longer-term weaker momentum is a critical element for traders to consider. The MACD on the daily chart also shows negative momentum, with the MACD line below its signal line, further reinforcing the idea that the broader trend might be losing steam. Furthermore, the Bollinger Bands on the daily chart are positioned below the middle band, which typically indicates a bearish trend or a period of consolidation following a downturn. The ADX on the daily chart, at 47.51, signifies a strong trend, but its presence alongside a bearish RSI and MACD suggests that this strong trend might be a bearish one, or at least one that is facing significant selling pressure.
The Stochastic Oscillator on the daily chart, with %K at 42.97 and %D at 29.88, shows %K above %D, which is a bullish signal in isolation. However, its position below 50 and the generally bearish signals from RSI and MACD on this timeframe suggest that this bullish stochastic signal might be a temporary reprieve rather than a sustained reversal. The overall 'SAT' (Sell) signal on the daily chart, despite the intraday strength, highlights the significant risk of a broader market correction or a sustained downturn if key support levels are breached. This conflict in signals across different timeframes creates a complex trading environment, demanding careful risk management and a clear understanding of the dominant trend.
Correlations and Macroeconomic Undercurrents
The S&P 500's price action cannot be viewed in isolation. Its correlation with other major market drivers, such as the US Dollar Index (DXY), is crucial. Currently, the DXY is trading around 99.84, showing a slight downward trend on the 1-hour chart. Historically, a weakening DXY often correlates with strength in risk assets like equities, as it can signal a decrease in global risk aversion or a shift in monetary policy expectations. However, in this specific instance, the downward pressure on the dollar is not translating into overwhelming bullish conviction for the S&P 500, particularly when contrasted with the bearish signals from the daily RSI and MACD. This decoupling suggests that internal market dynamics or other macroeconomic factors might be playing a more dominant role in influencing the S&P 500's direction right now.
The broader risk appetite, often gauged by indices like the Nasdaq 100 and the Dow Jones 30, also provides context. The Nasdaq 100 is showing strong upward momentum on its 1-hour and 4-hour charts, with an ADX of 55.87 and 30.57 respectively, suggesting a strong trend. However, its daily RSI is at 57.79, indicating a neutral-to-bullish stance, while the Dow Jones 30 exhibits strong upward signals across timeframes, with an RSI of 67.17 on the daily chart. Despite this general strength in other major indices, the specific technical readings for the S&P 500, particularly the daily divergences, suggest a potential divergence or a leading indicator of a broader market correction. This complex correlation landscape requires traders to look beyond simple correlations and focus on the specific technical health of the S&P 500 itself.
Furthermore, the recent news flow, while not directly pointing to a major catalyst for the S&P 500, provides background context. Reports highlighting analyst favorites in the copper and gold sectors, like Freeport-McMoran, indicate specific strength in commodities, which can sometimes draw capital away from broader equity markets or signal inflation concerns that might influence central bank policy. While not directly impacting the S&P 500's intraday movements, these underlying commodity price trends can contribute to the broader market sentiment and inflation expectations, which are key drivers for interest rate decisions and, consequently, equity valuations.
Key Levels and Price Action Strategy
The immediate price action for the S&P 500 revolves around the $6,572.87 resistance level. On the 1-hour chart, the next significant resistance is identified at $6,577.27, followed by $6,589.83. A decisive break and sustained hold above these levels would invalidate the immediate bearish concerns and could signal a continuation of the upward trend. Conversely, failure to overcome $6,572.87 could lead to a retest of intraday support levels. The most critical intraday support is found at $6,568.73, followed by $6,547.63 and $6,535.07. A break below these levels would likely accelerate selling pressure, especially if confirmed by increasing volume and deteriorating technical indicators.
Looking at the daily timeframe, the support levels become more significant. The first major daily support is situated at $6,377.47, with further levels at $6,230.63 and $6,149.87. These levels represent critical junctures where a more substantial correction could find buying interest or where a broader trend reversal might be initiated. On the resistance side for the daily chart, $6,605.07 presents the next hurdle, followed by $6,685.83 and $6,832.67. These higher resistance levels are targets for a more optimistic scenario, but they appear less probable given the current daily technical picture.
Trade Scenarios and Probabilities
Bearish Scenario: RSI Divergence Takes Hold
65% ProbabilityNeutral Scenario: Consolidation Around Resistance
25% ProbabilityBullish Scenario: Breakout Above Resistance
10% ProbabilityThe Trader's Perspective: Balancing Risk and Reward
From a trader's standpoint, the current setup on the S&P 500 presents a classic risk-reward dilemma. The intraday charts suggest potential for a short-term continuation of the rally, driven by strong momentum and the overall strength seen in other indices like the Nasdaq 100 and Dow Jones 30. However, the daily chart's bearish RSI and MACD signals cannot be ignored. This divergence implies that the underlying trend might be weaker than the recent price action suggests, making a breakout above resistance less probable without a significant shift in market sentiment or macroeconomic news.
The prevailing sentiment appears to be one of cautious optimism, with buyers showing strength on shorter timeframes but facing significant headwinds at higher resistance levels. The ADX at 49.72 on the 1-hour chart indicates a strong trend is in play, but the RSI's journey into overbought territory at 70.95 suggests this trend might be ripe for a pause or reversal. The daily RSI at 45.35 further complicates the picture, suggesting that the broader market sentiment is not fully supportive of a sustained rally. This means that any trade initiated here requires strict risk management. A strategy focused on shorting the resistance at $6,572.87, with a tight stop-loss above $6,589.83, and targeting the intraday supports like $6,568.73 or $6,547.63, offers a higher probability setup given the current technical confluence of bearish signals on the daily timeframe.
Alternatively, for those looking to play a potential breakout, waiting for confirmation above the $6,589.83 resistance level would be prudent. Such a move, especially if accompanied by a surge in volume and a daily RSI moving above 50, could signal a more sustainable upward trajectory. However, given the current bearish divergence on the daily chart, this scenario appears less likely in the immediate term. The neutral scenario, involving consolidation within the current range, also presents opportunities for range-bound trading strategies, but the strong ADX readings suggest that volatility might increase, making range-bound plays riskier.
The current market environment is characterized by conflicting signals across different timeframes. Traders should exercise extreme caution and employ strict risk management protocols. A close below the critical support level of $6,547.63 on the 1-hour chart could trigger a rapid decline, especially if accompanied by negative macroeconomic news or a sharp move in the DXY. Always ensure your stop-loss orders are appropriately placed to mitigate potential losses.
| Indicator | Value | Signal | Interpretation |
|---|---|---|---|
| RSI (14) | 70.95 | Overbought | Short-term exhaustion possible |
| MACD Histogram | Positive | Bullish Momentum | Intraday strength support |
| Stochastic (%K/%D) | 65.73 / 73.5 | Mixed | Potential cooling off |
| ADX | 49.72 | Strong Trend | Significant upward momentum (1H) |
| Bollinger Bands | Above Mid | Bullish Bias | Price above middle band (1H) |
Frequently Asked Questions: SP500 Analysis
What happens if SP500 breaks below the $6,547.63 support level?
A break below $6,547.63 on the 1-hour chart would likely trigger further downside, potentially retesting the $6,535.07 support. This would be confirmed if the bearish divergence seen on the daily RSI at 45.35 starts to dominate price action, invalidating the short-term bullish signals.
Should I consider buying SP500 at current levels around $6,572.87 given the mixed signals?
Buying at $6,572.87 is a high-risk proposition due to the resistance and bearish daily RSI divergence. A more prudent approach would be to wait for a clear break above $6,589.83 or a pullback to a more defined support level like $6,547.63, ideally with confirmation from other indicators.
Is the RSI at 70.95 a definitive sell signal for SP500 on the 1-hour chart?
An RSI of 70.95 signals overbought conditions on the 1-hour chart, suggesting potential for a short-term pullback or consolidation. It's not an immediate sell signal on its own, but it warrants caution, especially when viewed alongside the bearish divergence on the daily RSI (45.35).
How might the current DXY trend at 99.84 influence the SP500's next move?
The slight downtrend in the DXY (99.84) typically supports risk assets like the S&P 500. However, this positive correlation seems to be overshadowed by internal S&P 500 weaknesses, particularly the bearish daily technicals. If the DXY were to reverse sharply upwards, it would likely add further pressure on the S&P 500.
The S&P 500 stands at a critical juncture, trading near $6,572.87 resistance. While intraday charts show bullish momentum, the daily indicators, particularly the bearish RSI divergence at 45.35, signal caution. For now, patience and disciplined risk management are key. Traders should look for clear confirmations of either a breakout above resistance or a breakdown below key support levels before committing to significant positions. The market often provides second chances, and waiting for a clearer setup will likely be the most rewarding strategy in this complex environment.
Track markets in real-time
AI-powered analysis, technical indicators and real-time price data.
Join Our Telegram Channel
Breaking market news, AI analysis and trading signals instantly.
Join Channel