

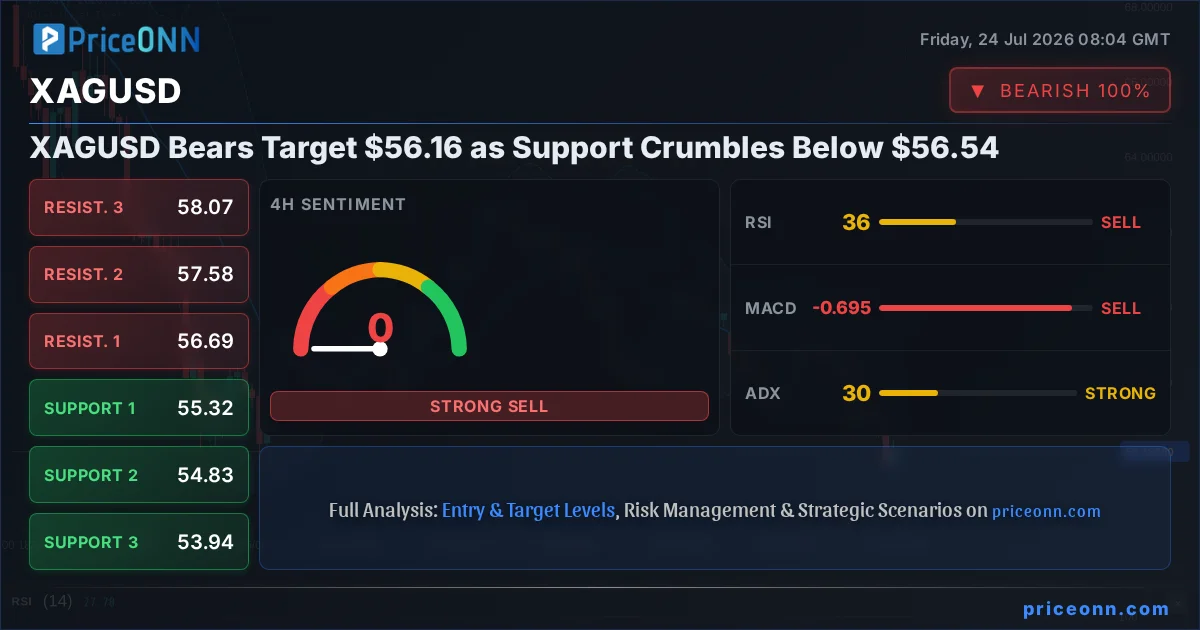
The relentless march of the US Dollar, coupled with a broader risk-off sentiment gripping global markets, is casting a long shadow over precious metals. Silver, or XAGUSD as it's known in the trading pits, is currently finding itself under significant pressure, trading at precisely $56.16. This level is not just a number; it represents a critical juncture where the bulls have struggled to maintain control, and the bears are now firmly in the driver's seat, targeting further downside. The recent break below the $56.54 support level is a stark signal, indicating that the path of least resistance for silver may be downwards, at least in the short term. This analysis dives deep into the fundamental drivers and technical signals that are shaping the current narrative for silver, exploring the compelling bear case while acknowledging the conditions under which the bulls might stage a comeback.
- RSI at 37.11 on the 1H chart signals bearish momentum, indicating waning buying pressure.
- Critical support at $56.54 has been breached, with immediate downside targets now focused on $55.97.
- The ADX at 35.29 on the 1H timeframe confirms a strong downward trend is in play for XAGUSD.
- DXY strength, currently at 100.7, is a significant headwind for silver, correlating with its downward price action.
The Widening Chasm: Why Bears Are Dominating Silver
The narrative around silver has shifted dramatically. Just days ago, discussions might have revolved around its potential to hedge against inflation or act as a safe haven amidst geopolitical jitters. However, the current market environment paints a different picture. The US Dollar Index (DXY), currently standing strong at 100.7, is acting as a powerful headwind. Historically, a rising dollar often spells trouble for dollar-denominated commodities like silver, as it makes them more expensive for holders of other currencies. This inverse correlation is playing out starkly, with the DXY's upward trajectory coinciding with silver's descent. The strength in the dollar isn't occurring in a vacuum; it's often a reflection of risk aversion or expectations of tighter monetary policy, both of which tend to dampen demand for riskier assets and commodities.
Furthermore, the broader market sentiment is currently leaning towards caution. Major indices like the S&P 500, trading at 6572.87, are showing signs of consolidation after recent gains, and the Nasdaq 100, at 29164.86, has experienced a notable pullback. This risk-off sentiment typically sees investors flocking to perceived safe-haven assets, but ironically, in the current climate, the US dollar is often the primary beneficiary, overshadowing traditional safe havens like gold and silver when risk appetite wanes significantly. The fact that Brent crude is nearing $100 and causing broader market repricing, as reported by news outlets, suggests that inflationary pressures remain a concern, yet this hasn't translated into a safe-haven bid for silver. Instead, the focus seems to be on the potential for economic slowdown and the subsequent impact on industrial demand for silver.
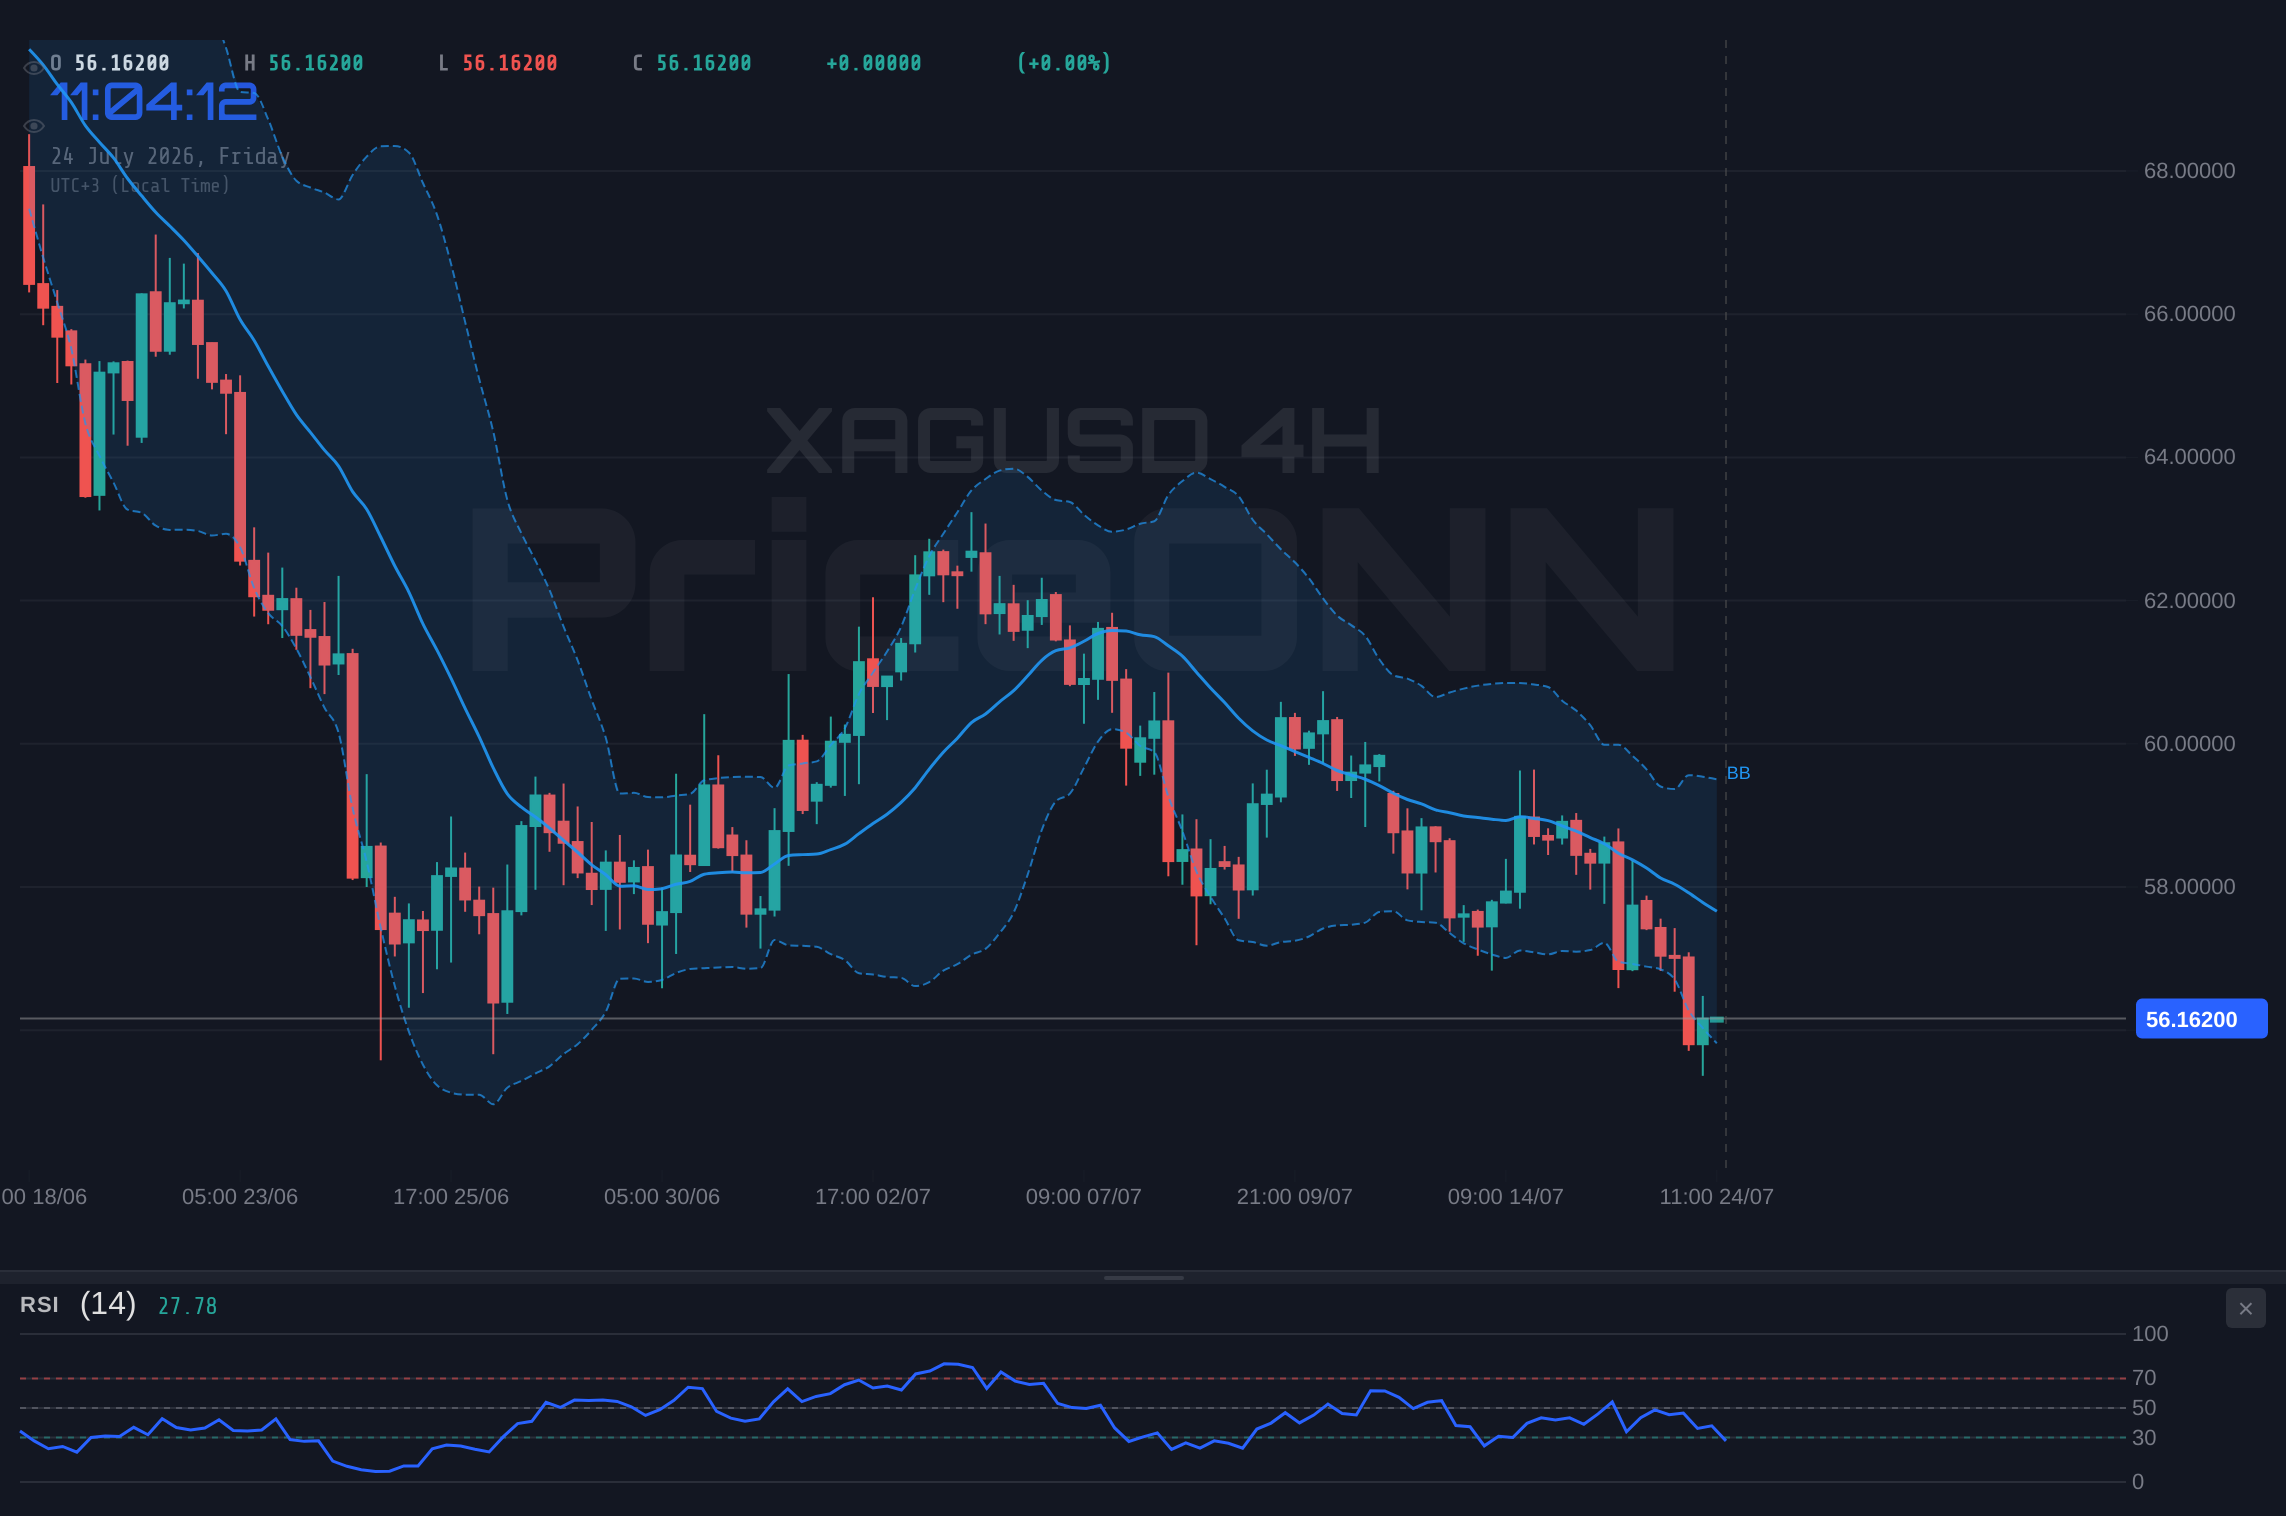
Unpacking the Technical Breakdown: A Bearish Confirmation
The technical indicators for XAGUSD are painting a decidedly bearish picture, especially when viewed across multiple timeframes. On the 1-hour chart, the RSI is hovering at 37.11, firmly in neutral territory but with a clear downward inclination, suggesting that selling momentum is building. The MACD is also flashing negative momentum, with the MACD line below its signal line, reinforcing the bearish bias. The Bollinger Bands confirm this, with the price trading below the middle band, indicating downward pressure. While the 1-hour Stochastic shows a slight bullish signal (%K > %D), this is often a fleeting divergence in a stronger downtrend and is currently overshadowed by other indicators. The ADX at 20.26 on the 1H chart confirms a medium-strength downtrend, suggesting that the current move has legs.
Stepping out to the 4-hour timeframe, the bearish signals intensify. The trend is clearly identified as 'Düşüş' (Downtrend) with a high power rating of 83%. The RSI at 40.59 continues to indicate weakness, and the MACD remains firmly in negative territory. The Stochastic, with K=18.51 and D=31.25, is giving a clear bearish signal (%K
The daily chart offers the most compelling evidence for the bear case. The trend is overwhelmingly 'Düşüş' (Downtrend) with a 95% power rating. The RSI at 38.86, while still in neutral territory, continues to trend downwards, reflecting persistent selling pressure. Crucially, the MACD on the daily chart is showing positive momentum and is above its signal line, which appears to contradict the shorter timeframes. However, this can often be a lagging indicator or represent a brief pause before the larger trend reasserts itself, especially if it's not supported by other momentum oscillators. The Stochastic on the daily chart is bearish (%K
The Fundamental Squeeze: Inflation, Rates, and Industrial Demand
Beyond the technicals, the fundamental backdrop for silver is also becoming increasingly challenging. While silver often benefits from inflation as a store of value, its dual nature as an industrial metal means that slowing economic growth poses a significant threat. Recent economic data, such as the PMI figures and GDP reports, have painted a mixed but increasingly cautious global economic picture. If economic activity slows considerably, the demand for silver in sectors like electronics, solar panels, and automotive manufacturing could diminish. This would put further downward pressure on prices, regardless of any inflation hedging demand.
Central bank policies remain a critical factor. The European Central Bank (ECB), as reported, held rates steady but is closely watching energy shocks and inflation spillovers. While the ECB might be leaning towards a hawkish hold, the US Federal Reserve's stance is paramount. If the Fed continues to signal a data-dependent approach but maintains a bias towards keeping rates higher for longer to combat stubborn inflation, this will likely support the dollar and weigh on silver. The market is constantly repricing these expectations based on incoming economic data. For instance, recent comments from Fed officials suggesting inflation remains 'stubborn' could be interpreted as a signal that rate cuts might be further delayed, reinforcing the bullish case for the dollar and bearish case for silver.
Geopolitical tensions, particularly in the Middle East, have typically been a tailwind for precious metals. However, the current dynamics suggest a complex interplay. While oil prices are climbing due to these tensions, which could theoretically fuel inflation concerns and boost safe-haven demand for silver, the dominant narrative seems to be one of broader market uncertainty and a strengthening dollar as the primary safe haven. This suggests that the geopolitical risk premium is not translating into direct support for silver prices at this moment. Investors appear more focused on the immediate economic headwinds and the potential for a global slowdown, which are directly impacting industrial demand for silver.
The current strength of the DXY (100.7) is a major impediment for XAGUSD. A sustained rise in the dollar typically correlates with a fall in silver prices. This relationship is a key focus for traders monitoring the pair.
Can the Bulls Mount a Defense at $56.16?
Despite the overwhelming bearish signals, the market is rarely a one-way street. For the bulls to regain control, several conditions would need to be met. Firstly, a decisive shift in the broader market sentiment towards risk-on would be necessary. This could be triggered by more dovish-than-expected commentary from the Federal Reserve, a significant cooling of geopolitical tensions, or surprisingly strong economic growth data that suggests a soft landing is more likely. Such a shift would likely weaken the US dollar, providing immediate relief for silver.
Technically, a bullish reversal would require price action to decisively break back above key resistance levels. The immediate resistance stands at $4019.21 on the 1H chart, followed by $4031.6. A sustained move above these levels, particularly breaking through the 1-hour middle Bollinger Band and showing increasing RSI above 50, would be the first signs of a potential turnaround. Confirmation would come from a daily close above the daily resistance level of $4088.69. The MACD on the daily chart currently shows positive momentum, which could be the seed of a future recovery, but it needs to be supported by a broader shift in short-term indicators and sustained buying volume. The Stochastic on the 1H chart showing a bullish signal (%K > %D) could be an early hint, but it needs to be confirmed by other oscillators and price action.
However, the current data does not strongly support this bullish thesis. The overwhelming number of 'SAT' (SELL) signals across multiple timeframes, the clear downtrend on daily charts, and the strong correlation with a rising DXY all point to continued weakness. The support levels at $3991.8 and $3976.78 on the 1-hour chart are now the immediate focus. A break below these could quickly lead to further acceleration towards the $3964.39 level. The ADX readings across the board, especially the 39.16 on the daily chart, indicate a powerful trend is in motion, and reversing such a trend requires significant force and sustained buying pressure, which is currently absent.
Bearish Scenario: Downside Acceleration
70% ProbabilityConsolidation Scenario: Sideways Chop
20% ProbabilityBullish Scenario: Reversal Attempt
10% ProbabilityFrequently Asked Questions: XAGUSD Analysis
What happens if XAGUSD breaks below $55.97 support?
A break below $55.97 would confirm the bearish trend and likely accelerate selling pressure. The next significant support level to watch would be $55.68, potentially leading to a rapid decline as traders exit long positions.
Is the RSI at 37.11 a sell signal for XAGUSD right now?
While not technically oversold, an RSI of 37.11 on the 1-hour chart indicates bearish momentum is building. Combined with other technicals and the break of $56.54 support, it reinforces the downside risk, suggesting caution for any potential buyers.
How will the DXY strength at 100.7 affect XAGUSD's price?
The current DXY level of 100.7 is exerting downward pressure on XAGUSD due to the typical inverse correlation. A strong dollar makes silver more expensive for non-dollar holders, dampening demand and contributing to the bearish sentiment.
What is the outlook for XAGUSD if the ECB maintains a hawkish stance?
If the ECB remains hawkish while the Fed holds rates or signals further tightening, it could lead to further dollar strength, negatively impacting XAGUSD. However, if the ECB's hawkishness is seen as a sign of economic resilience in Europe, it might eventually support EUR/XAG crosses, though the USD correlation often dominates.
| Indicator | Value | Signal | Interpretation |
|---|---|---|---|
| RSI (14) | 37.11 | Bearish | Neutral zone, leaning down |
| MACD Histogram | -0.25 | Bearish | Negative momentum |
| Stochastic | K:43.73, D:25.17 | Bullish Divergence | %K > %D, potential short-term bounce |
| ADX | 35.29 | Strong Trend | Confirms downtrend strength |
| Bollinger Bands | Mid Band | Below | Price under pressure |
Track markets in real-time
AI-powered analysis, technical indicators and real-time price data.
Join Our Telegram Channel
Breaking market news, AI analysis and trading signals instantly.
Join Channel