

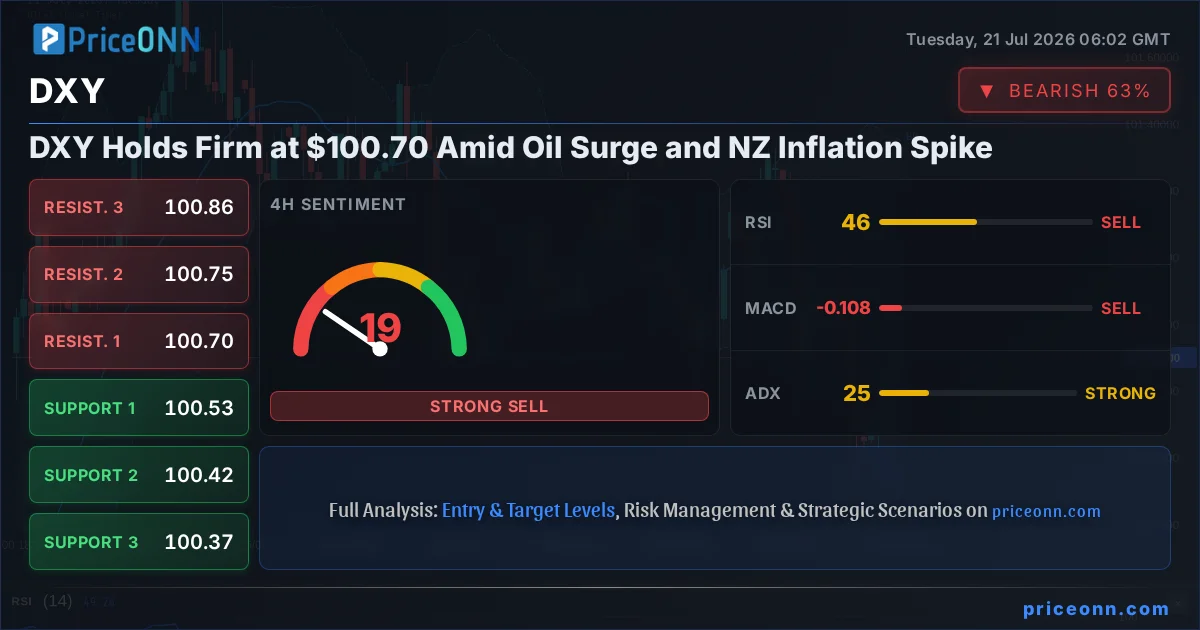
The DXY is holding its ground near the critical $100.70 mark, presenting a complex picture for traders as global markets react to diverging economic pressures. While renewed US-Iran tensions have propelled Brent crude oil prices higher and New Zealand's surprisingly high inflation figures challenge the Reserve Bank of New Zealand (RBNZ), the dollar's resilience suggests underlying strength or a reassessment of global risk appetite. This confluence of events creates a fascinating dynamic, forcing a deeper look into the fundamental drivers shaping currency and commodity markets today.
- The DXY is currently trading at $100.70, showing resilience amidst global market shifts.
- Brent crude surged on US-Iran tensions, currently priced at $83.79, signaling rising inflation expectations.
- New Zealand's CPI hit 4.1% year-on-year, creating a challenge for the RBNZ and potentially impacting NZD.
- The 4-hour chart for DXY shows a neutral trend with a sell signal, while the 1-hour chart indicates a buy signal with positive momentum.
- Key levels for DXY are identified at support $100.21 and resistance $100.90 on the daily timeframe.
The dollar index, or DXY, has carved out a trading range around $100.70. This isn't just a static number; it represents a key psychological and technical battleground. Its ability to hold this level, despite significant global crosscurrents, speaks volumes about the underlying demand for the greenback. Traders are scrutinizing every tick, every piece of data, trying to decipher whether this stability is a temporary pause or the prelude to a more significant move. The interplay between US monetary policy expectations, global risk sentiment, and the sheer momentum of the dollar itself is what keeps analysts glued to their screens.
Navigating the Crosscurrents: Oil, Inflation, and the Dollar's Stand
One of the most immediate and impactful developments is the surge in Brent crude oil prices. Currently trading at $83.79, oil is reacting to escalating geopolitical tensions between the US and Iran. This isn't merely an energy market story; it's a potent inflation signal. Higher oil prices translate directly into increased transportation and production costs across the global economy, reigniting concerns about inflationary pressures. For central banks, particularly the Federal Reserve, this presents a dilemma: combatting inflation might require tighter monetary policy, but doing so in an already fragile global economic environment carries significant risks. The Fed's next move, or even its rhetoric, will be heavily influenced by the persistence of these energy-driven price increases.
Adding another layer of complexity is the latest Consumer Price Index (CPI) data from New Zealand. Reporting a 4.1% year-on-year increase, inflation in NZ has accelerated from 3.1%, largely driven by rising fuel costs. This figure puts the RBNZ in a difficult position. With inflation running hotter than anticipated, the central bank faces pressure to tighten its monetary policy, potentially through interest rate hikes. However, the global economic backdrop, characterized by slowing growth in some regions and geopolitical uncertainty, makes such a move a delicate balancing act. The reaction of the New Zealand Dollar (NZD) to this data will be a key indicator of how markets are pricing in potential RBNZ action and the broader impact on commodity-linked currencies.
The correlation between these seemingly disparate events and the DXY's stability is crucial. Typically, rising oil prices and higher inflation expectations can lead to a stronger dollar as markets anticipate tighter monetary policy. However, the current picture is more nuanced. While the DXY shows resilience around $100.70, its intraday movements suggest caution. The 1-hour chart shows a neutral trend with a strong sell signal (7 sells, 1 buy), indicating short-term bearish pressure. Conversely, the 4-hour chart flips this, showing a neutral trend but with a buy signal (5 buys, 3 sells), suggesting a potential for upward momentum over a slightly longer timeframe. This divergence highlights the indecision in the market and the importance of watching how these conflicting signals resolve.
Technical Snapshot: DXY's Battle at $100.70
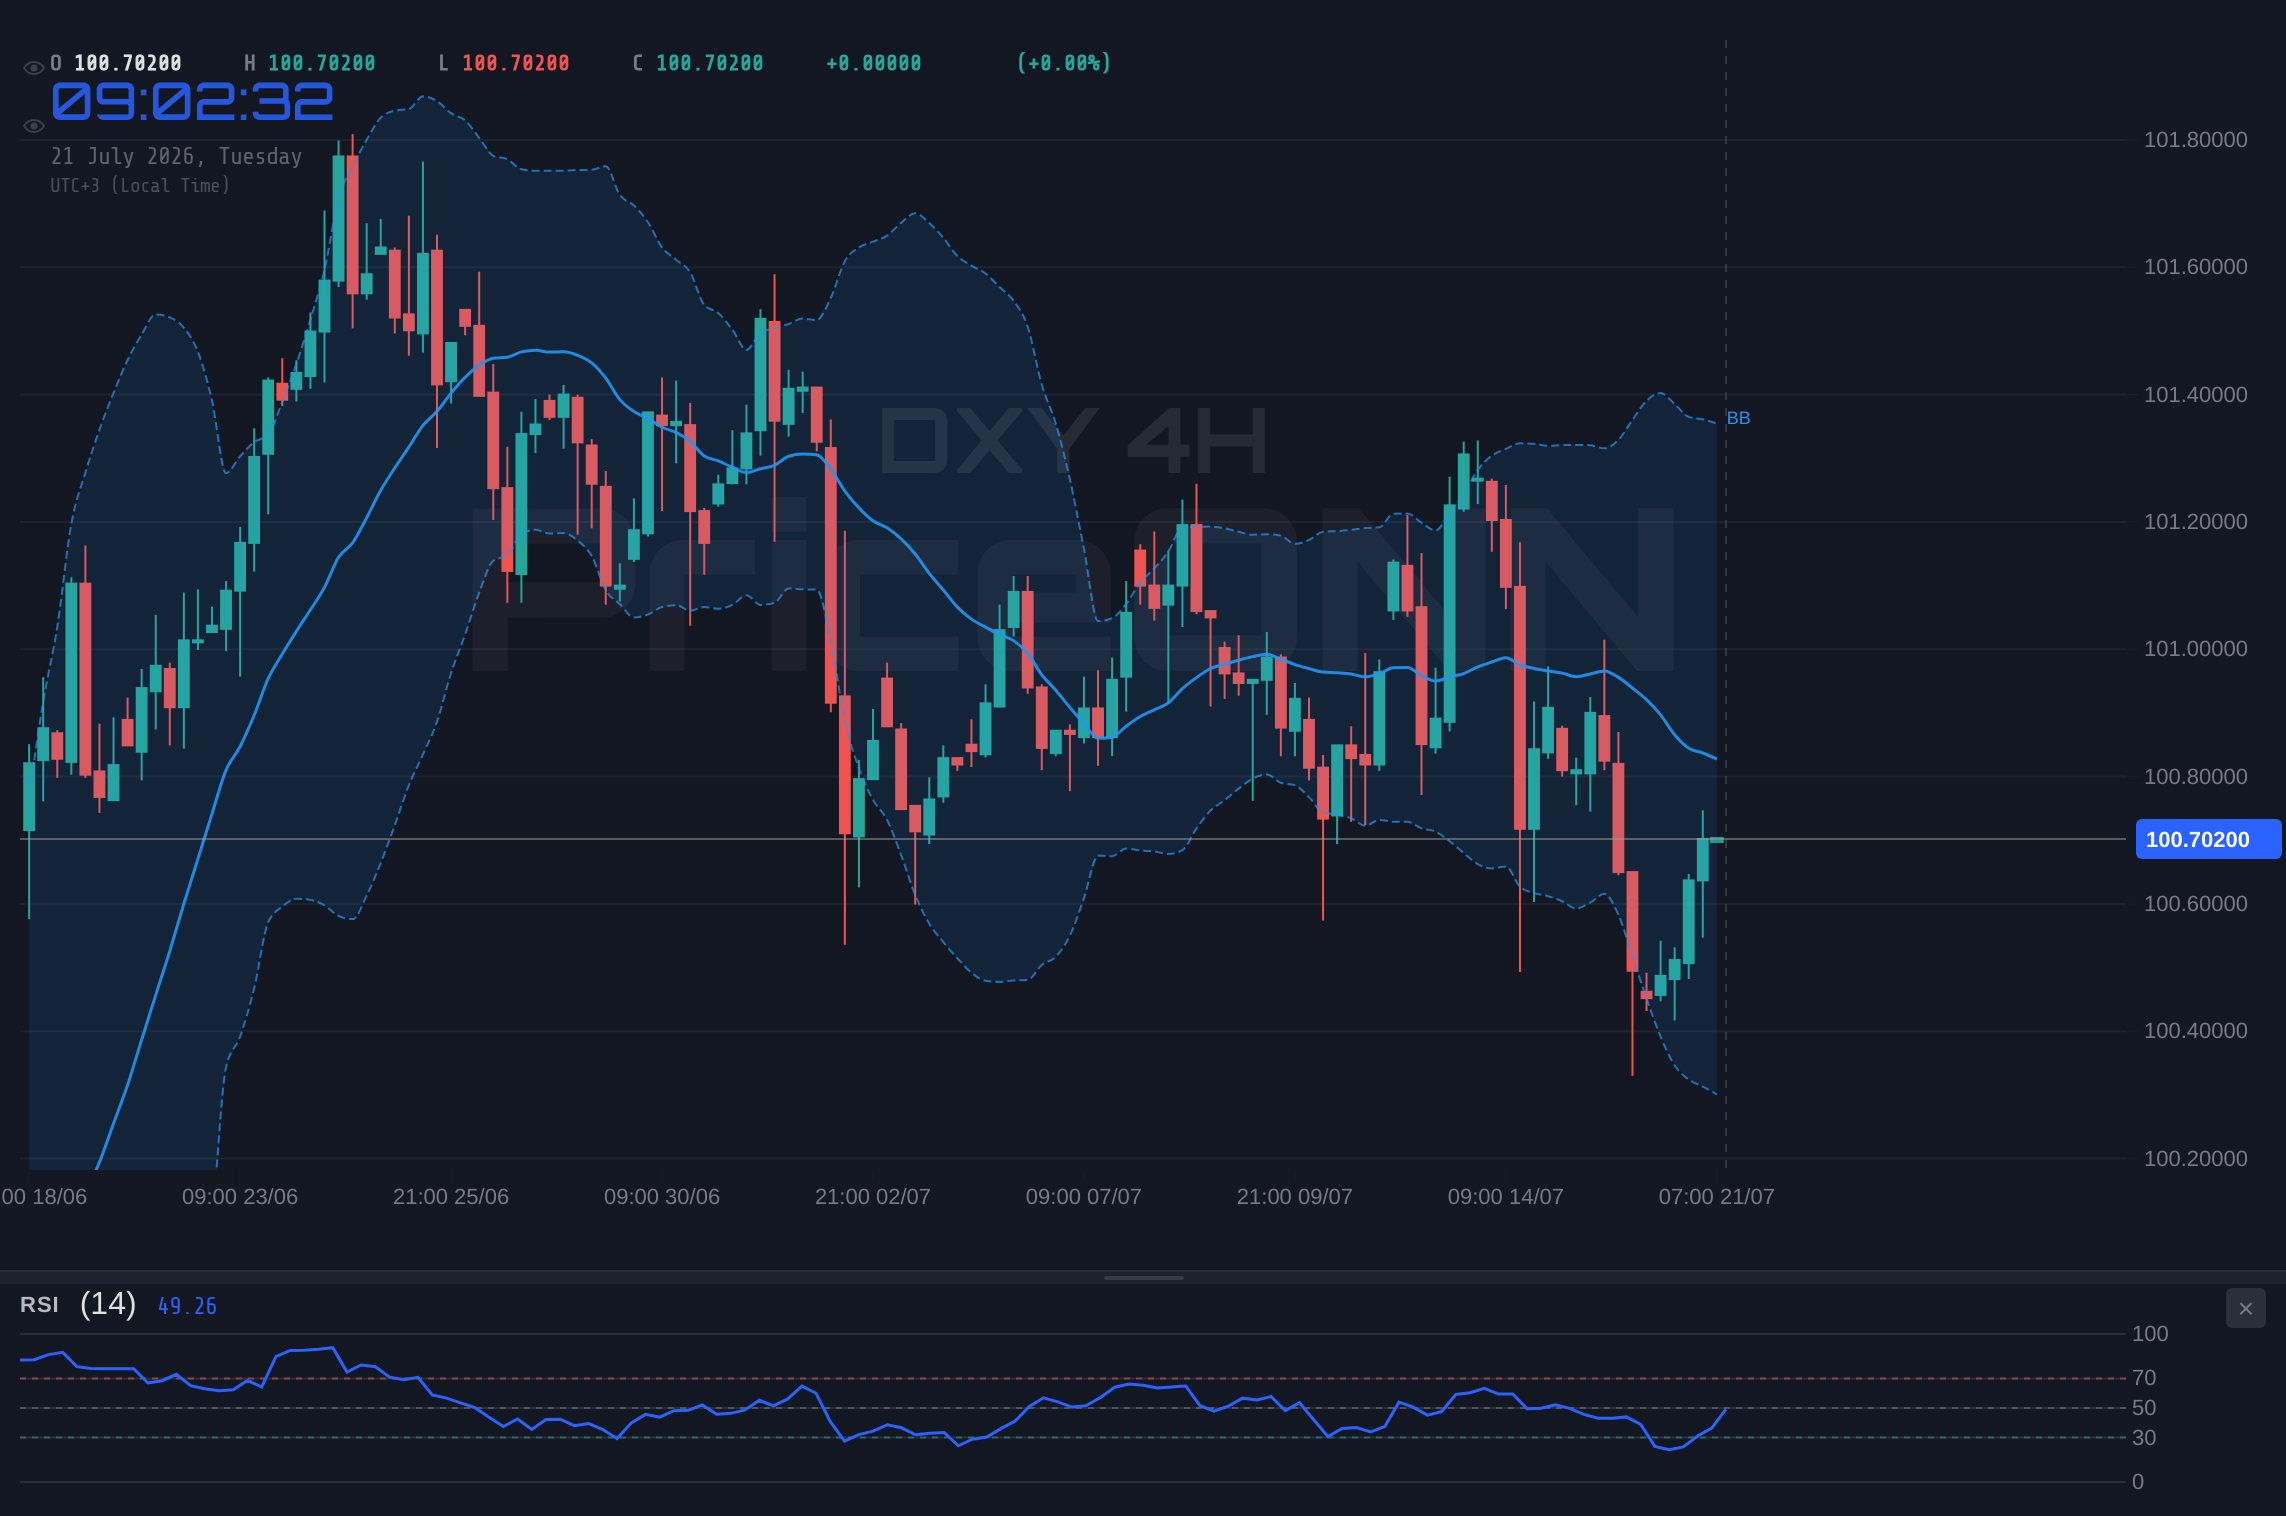
Looking at the DXY's technicals, the daily chart presents a trend strength of 50%, reinforcing the neutral yet critical stance around $100.70. The RSI(14) at 51.34 is hovering in neutral territory, suggesting neither strong buying nor selling pressure is dominant on a daily basis. However, the MACD is showing negative momentum with the MACD line below its signal line, indicating a potential for downward movement. The Bollinger Bands are also sitting below the middle band, reinforcing this bearish lean on the daily timeframe. Stochastic K is at 32.61 and D at 44.07, a clear bearish signal with K below D, suggesting oversold conditions might be approaching, but the trend is still showing strength at ADX 27.03.
The intraday charts offer a more mixed perspective. The 1-hour timeframe shows a neutral trend with a strong 'Sell' general signal (7 sells, 1 buy). The RSI(14) is at 56.6, indicating a slight upward bias but still within neutral territory. The MACD is positive, and the Bollinger Bands are above the upper band, hinting at potential overbought conditions or a strong upward push. Stochastic K (86.15) and D (82.01) are deep in overbought territory, signaling that a pullback could be imminent. The ADX at 27.71 suggests a strong uptrend is in place on this short-term chart. This contrast between the daily bearish lean and the hourly bullish signals underscores the current market indecision.
On the 4-hour chart, the trend is also neutral with mixed signals. The RSI(14) at 46.15 leans bearish, while the MACD shows negative momentum. However, the Bollinger Bands are below the middle band, suggesting a bearish inclination, but the Stochastic K (41.9) and D (27.16) show a bullish crossover, indicating potential upward movement. The ADX at 25.26 points to a strong downtrend, which seems to contradict the Stochastic signal. This technical ambiguity is precisely why price action around $100.70 is so crucial. Traders are looking for a clear breakout or breakdown to confirm the next directional move.
Correlation Analysis: DXY, Equities, and Commodities
The DXY's performance is intrinsically linked to global risk sentiment, often showing an inverse correlation with major stock indices like the S&P 500 and Nasdaq. Currently, the S&P 500 is showing strength, trading at 6572.87 with a daily gain of 0.74%, while the Nasdaq 100 has experienced a more significant drop of 1.16% to 29164.86. This divergence suggests a mixed risk appetite. The S&P 500's upward momentum, despite some bearish signals on its 1-hour chart (RSI 70.95, Stochastic showing a drop), might be supported by specific sector strength or anticipation of positive economic news. The Nasdaq's weakness, however, could be a precursor to a broader risk-off move, which would typically support the DXY and safe-haven assets.
The correlation with commodities, particularly gold (XAUUSD) and silver (XAGUSD), is also noteworthy. XAUUSD is currently down 1.46% at $4001.21, and XAGUSD is down 2.73% at $56.16. This broad-based decline in precious metals, despite rising oil prices and geopolitical uncertainty, is a strong indicator that the dollar's resilience is playing a significant role. Usually, heightened geopolitical risks and inflation fears would drive investors towards safe-haven assets like gold. However, the current strength of the DXY appears to be overriding these traditional correlations, suggesting that the dollar itself is acting as the primary safe-haven destination for now. This is a critical observation for understanding market sentiment.
The relationship between the DXY and currency pairs like EUR/USD, USD/JPY, and GBP/USD provides further context. EUR/USD is trading at 1.14436, showing a slight daily decline, while USD/JPY is climbing to 162.429, and GBP/USD is down 0.45% at 1.34773. The strength in USD/JPY, a classic risk-on pair, contrasts with the weakness in EUR/USD and GBP/USD, which are facing their own fundamental headwinds. The recent news about the US expanding tariffs beyond USMCA protections, as reported by Forex analysts, could also be contributing to a broader risk-off sentiment that indirectly benefits the dollar. This complex web of correlations demands a multi-faceted approach to market analysis.
Fundamental Catalysts and Future Outlook
Looking ahead, the economic calendar is packed with events that could significantly impact the DXY's trajectory. While specific upcoming events weren't detailed in the provided data beyond the NZ CPI, general market expectations often revolve around central bank policy. The Federal Reserve's stance on interest rates remains paramount. Any indication of a hawkish policy shift, perhaps driven by persistent inflation data like the oil surge, could further bolster the dollar. Conversely, signs of economic weakening or a pivot towards easier policy would likely pressure the DXY.
The geopolitical situation, particularly US-Iran relations, remains a wildcard. Any escalation could trigger a flight to safety, bolstering the dollar and impacting oil prices. Conversely, de-escalation could lead to a reversal in oil and potentially reduce demand for the dollar as a safe haven. Traders will be closely watching for any official statements or developments on this front. Furthermore, the performance of other major economies, such as the Eurozone and the UK, will continue to influence their respective currencies against the dollar.
The current price action around $100.70 is a battleground where these fundamental forces are clashing. The resilience of the DXY suggests that, despite global uncertainties, the dollar is currently favored. However, the mixed technical signals and the persistent inflation concerns, amplified by rising oil prices, mean that the situation is far from settled. Patience and a data-driven approach will be key for navigating this complex market landscape in the coming days and weeks.
Bearish Scenario: Dollar Weakens Below Key Support
65% ProbabilityNeutral Scenario: Range-Bound Consolidation
25% ProbabilityBullish Scenario: Dollar Strength Extends
10% ProbabilityFrequently Asked Questions: DXY Analysis
What happens if DXY breaks below the $100.21 support level?
A break below $100.21 would invalidate the current consolidation and likely signal a move towards lower support levels, potentially targeting $99.93. This scenario would be driven by increasing risk aversion or a shift in Fed policy expectations.
Is the RSI at 51.34 a buy signal for DXY right now?
An RSI reading of 51.34 is considered neutral territory on the daily chart, indicating no immediate strong buying or selling pressure. While short-term charts show different signals, this daily reading suggests caution is warranted until a clearer trend emerges.
How will the rising oil prices and NZ CPI data affect DXY this week?
Rising oil prices ($83.79 Brent) and NZ CPI (4.1%) can increase inflation concerns, potentially leading to expectations of tighter monetary policy. This could support the DXY if the Fed is seen as more likely to hike rates, but the impact depends on broader risk sentiment and other central bank actions.
Should I consider buying DXY at current levels of $100.70 given the mixed technical signals?
Given the mixed signals across different timeframes and the critical $100.70 level, caution is advised. A confirmed break above resistance at $100.90 could signal a bullish continuation, while a close below support at $100.21 would suggest a bearish move. Risk management is paramount.
Track markets in real-time
AI-powered analysis, technical indicators and real-time price data.
Join Our Telegram Channel
Breaking market news, AI analysis and trading signals instantly.
Join Channel