

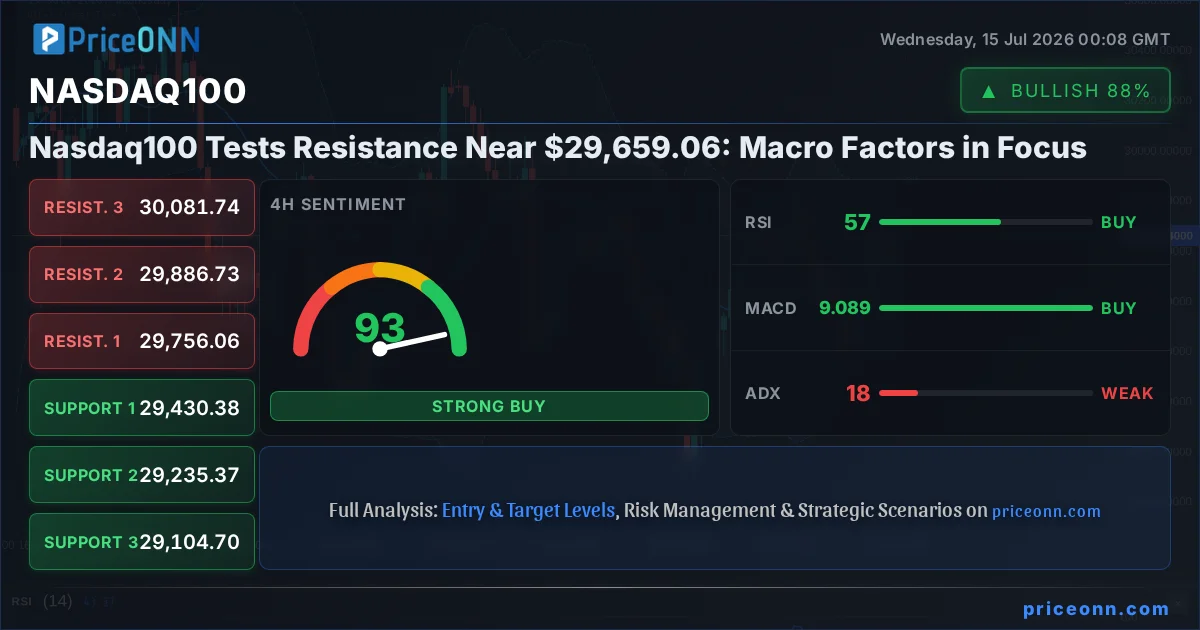
Amidst a complex interplay of global economic data and evolving central bank expectations, the Nasdaq 100 index finds itself at a critical juncture, currently hovering near the $29,659.06 mark. The past 48 hours have seen a flurry of market-moving news, from Euro gains against a softening dollar ahead of crucial US inflation figures to shifts in oil prices and renewed bets on Federal Reserve policy. This environment creates a challenging landscape for tech-heavy indices like the Nasdaq 100, where macroeconomic undercurrents often dictate short-term price action more than isolated technical patterns. Understanding the fundamental drivers behind these market movements is paramount for navigating the current volatility and identifying potential opportunities or risks.
- The Nasdaq 100 is trading near $29,659.06, with key resistance identified at $29,638.99 on the daily chart.
- US CPI data, expected to show cooling inflation due to falling fuel prices, is a major focus for market sentiment.
- Federal Reserve rate hike expectations are influencing currency markets, with the Dollar Index (DXY) at 100.89, impacting risk assets.
- Technical indicators show mixed signals across timeframes, suggesting a period of consolidation or a potential trend shift.
Navigating the Inflation Data Labyrinth
The upcoming release of the June Consumer Price Index (CPI) data is arguably the most significant event on the immediate economic calendar for the Nasdaq 100. Analysts are anticipating a cooling trend, largely attributed to tumbling fuel prices. This anticipated disinflationary pressure could significantly influence the Federal Reserve's monetary policy stance. If the CPI report comes in softer than expected, it might reinforce the market's belief that the Fed is nearing the end of its tightening cycle, or even pave the way for potential rate cuts later in the year. Such a scenario typically boosts risk appetite, which would be a tailwind for growth-oriented sectors that dominate the Nasdaq 100. However, the market's reaction will depend heavily on the magnitude of the slowdown and any accompanying commentary from the Bureau of Labor Statistics regarding underlying inflationary pressures. A surprise uptick in core inflation, even with falling energy prices, could quickly dampen optimism and lead to renewed selling pressure on tech stocks.
Federal Reserve's Shadow Over Market Sentiment
The Federal Reserve's policy decisions remain a dominant force shaping market sentiment, and by extension, the trajectory of the Nasdaq 100. With the Dollar Index (DXY) currently trading around 100.89, reflecting a complex mix of global economic factors and Fed expectations, its movements are closely watched. A stronger dollar, often a consequence of hawkish Fed rhetoric or rising US interest rate expectations, tends to put pressure on multinational tech companies within the Nasdaq 100, as their overseas earnings become less valuable when converted back to dollars. Conversely, signs of a dovish Fed, or a pause in rate hikes, can weaken the dollar and provide a much-needed boost to equities. Market participants are meticulously dissecting every piece of economic data, including employment figures and manufacturing surveys, for clues about the Fed's next move. The interplay between inflation data, labor market strength, and the Fed's forward guidance will be critical in determining whether the Nasdaq 100 can sustain its current levels or faces renewed headwinds.
Correlations: DXY, Oil, and the Tech Sector
The Nasdaq 100 does not operate in a vacuum; its performance is intrinsically linked to broader market correlations. The Dollar Index (DXY) at 100.89 presents a key indicator. Historically, a rising DXY often correlates with pressure on global equities, including the Nasdaq 100, as the cost of capital increases and foreign earnings translate into fewer dollars. Conversely, a weakening dollar can provide a significant tailwind. Furthermore, the price of oil, currently at $84.36 for Brent, plays a crucial role. Rising oil prices can signal increasing inflation expectations, prompting concerns about further Fed tightening, which is typically bearish for growth stocks. However, the narrative can be complex; if oil is surging due to supply-side issues or geopolitical tensions, it can also reflect underlying economic strength or increased risk premiums, leading to a more nuanced market reaction. The current upward trend in oil prices, therefore, warrants close attention for its potential to influence inflation expectations and, consequently, Fed policy and Nasdaq 100 sentiment. The S&P 500, trading at 6572.87, and Nasdaq 100 itself are also closely correlated; a strong showing in the broader market often lifts tech stocks, while a sell-off in the S&P 500 can drag the Nasdaq 100 lower, especially if risk aversion rises.
Technical Crossroads: Nasdaq 100 at the $29,659.06 Level
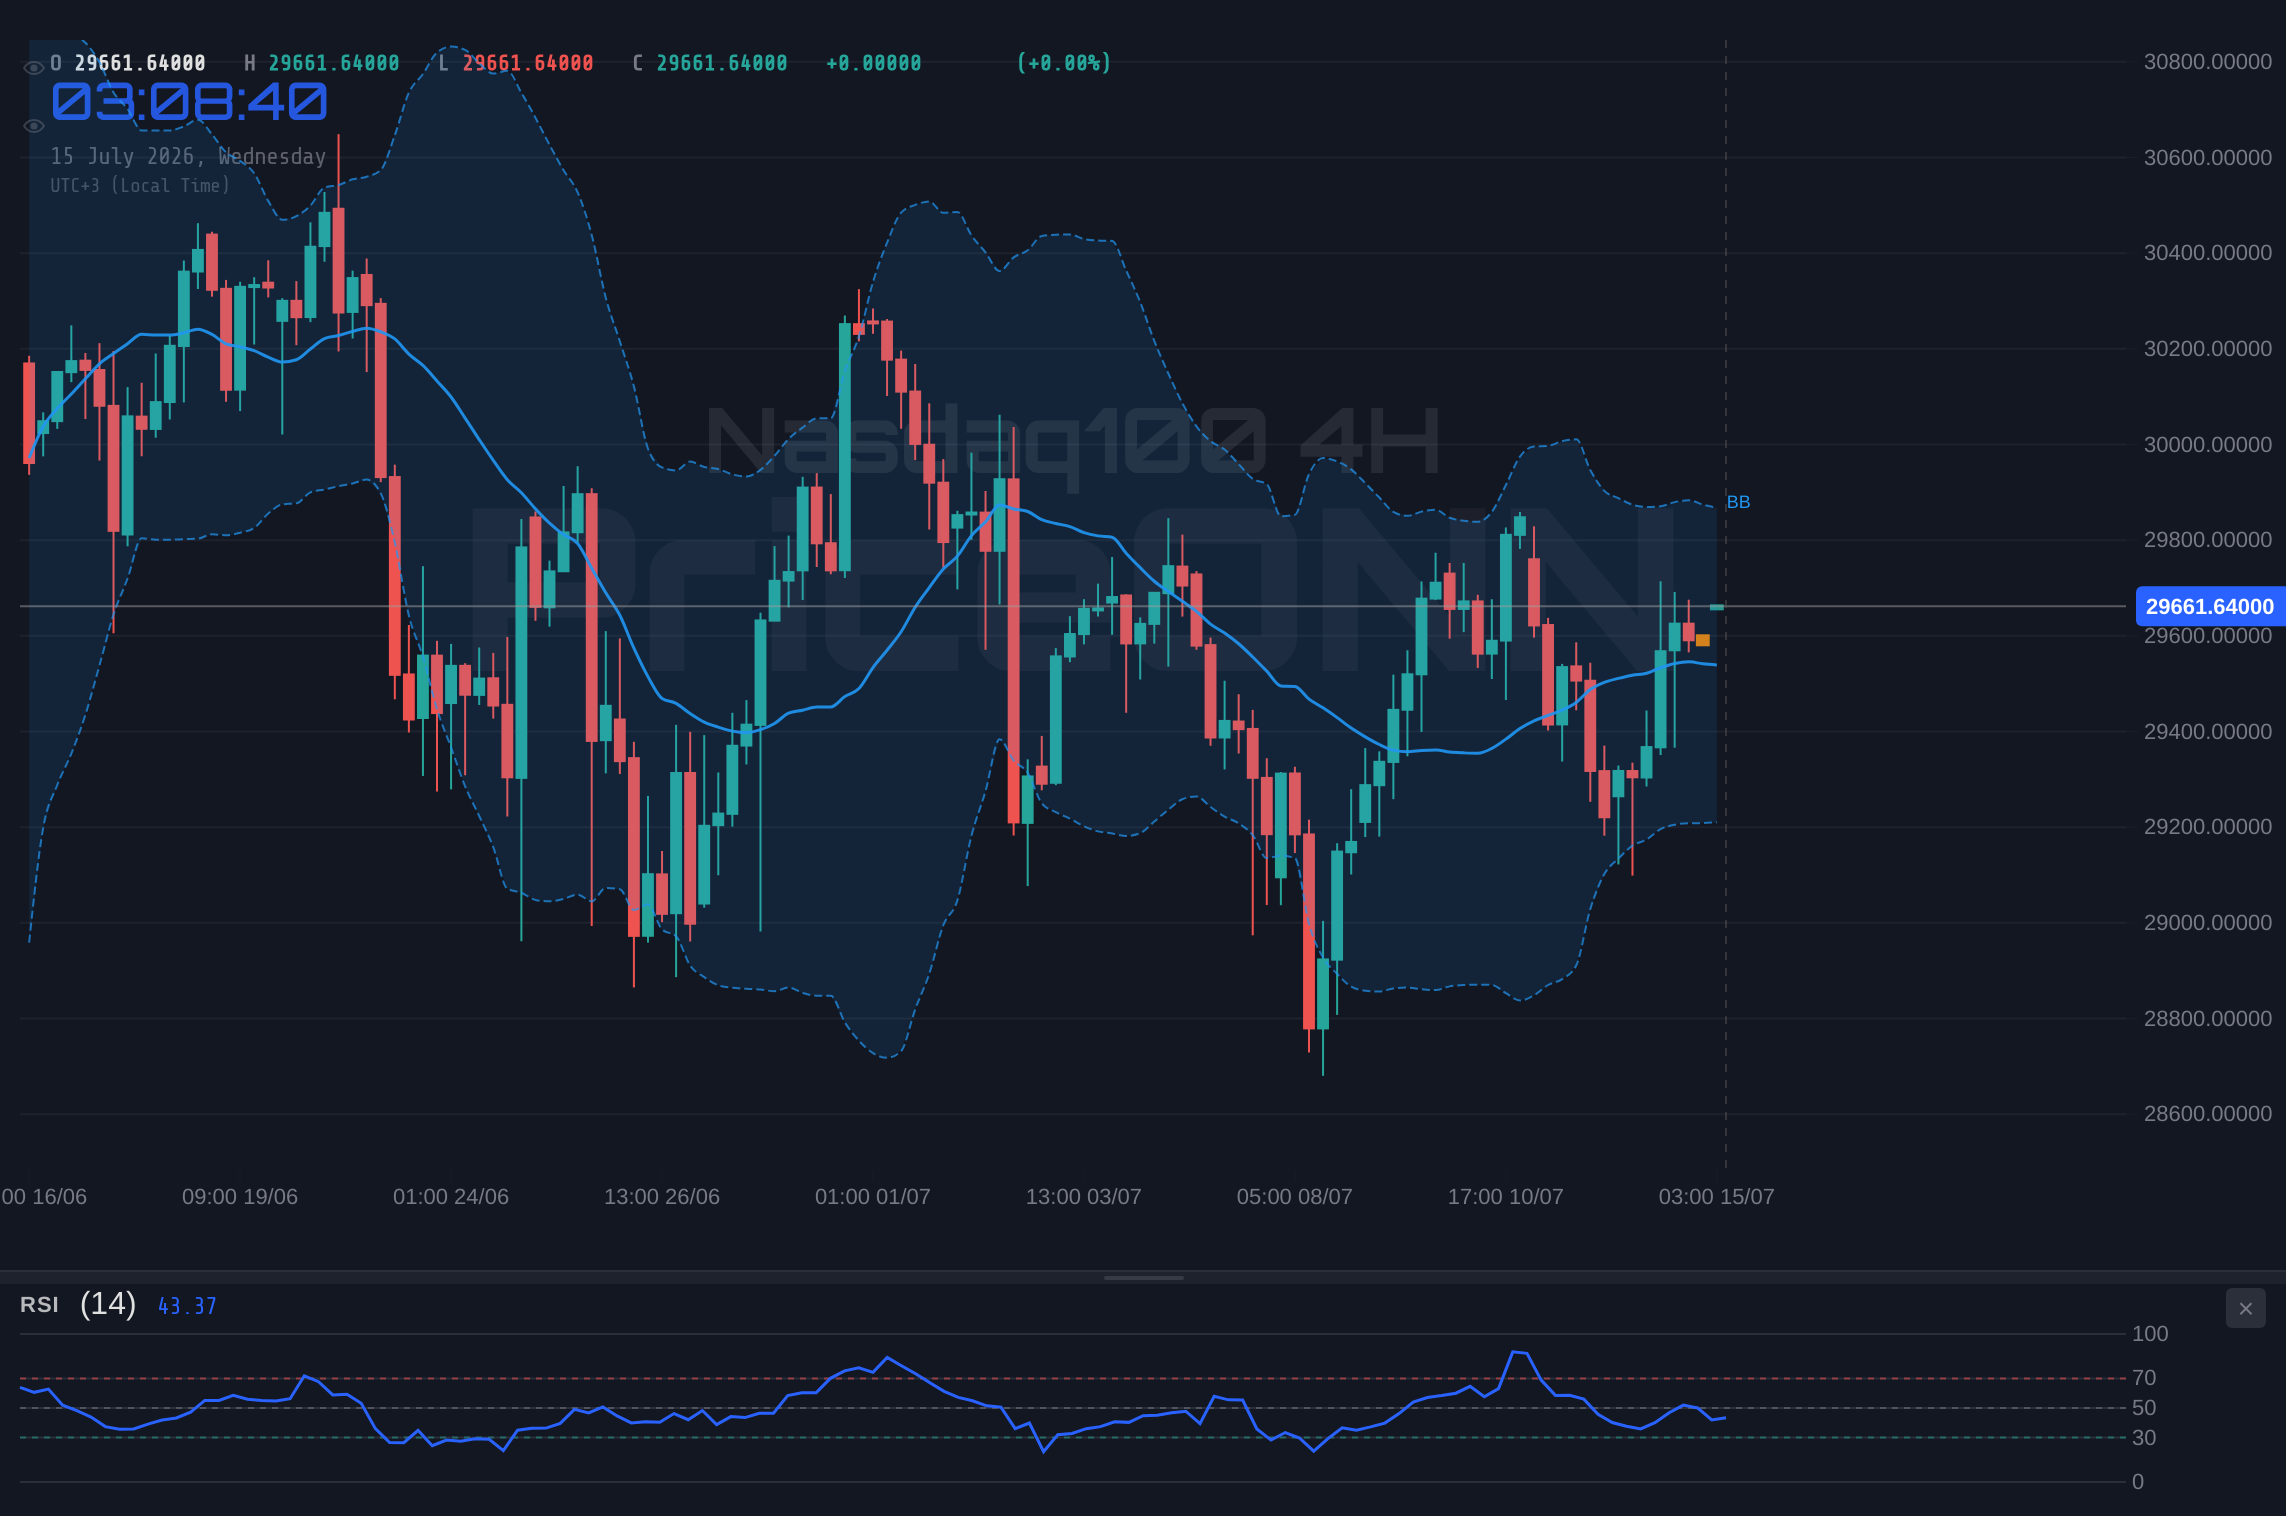
From a technical standpoint, the Nasdaq 100 is currently positioned at a critical resistance area. The daily chart shows the index consolidating near $29,659.06, with the nearest significant resistance level identified at $29,638.99. This proximity to resistance, coupled with mixed signals across different timeframes, suggests that the market is at a potential turning point. On the 1-hour chart, the trend is neutral with a strength of 50%, and indicators like RSI at 65.12 suggest a buoyant, though not yet overbought, market, while the Stochastic K line at 72.32 and D line at 72.29 point to an overbought condition, hinting at potential profit-taking. The ADX at 19.23 indicates a weak trend, suggesting indecision. However, the 4-hour chart presents a more bullish picture with a neutral trend (50% strength) and positive momentum on the MACD, though Stochastic K=84.3 and D=43.56 signal a strong bullish divergence. The daily timeframe, however, shows a bearish trend with an ADX of 47.51, indicating a strong downtrend despite the current price action. This divergence across timeframes underscores the uncertainty and the importance of key price levels. A decisive break above the $29,638.99 resistance, supported by strong volume and positive macroeconomic news, could signal a continuation of the bullish momentum. Conversely, a failure to break through this level, especially on disappointing economic data, could lead to a pullback towards support levels, such as $29,548.84 or even lower.
The 1-Hour Chart: A Mixed Bag of Signals
Diving deeper into the 1-hour timeframe for the Nasdaq 100 reveals a complex technical picture. The index is trading around $29,659.06, with immediate resistance at $29,647.12 and support at $29,647.12. The RSI(14) stands at 65.12, indicating a healthy but not yet extreme bullish sentiment, suggesting room for further upside before hitting overbought territory. However, the Stochastic Oscillator presents a conflicting signal: both %K (72.32) and %D (72.29) are in overbought territory, hinting that the recent upward move might be losing steam and could be due for a consolidation or pullback. The MACD is showing positive momentum, with the MACD line above the signal line, which typically supports a bullish outlook. Yet, the ADX at 19.23 signifies a weak trend, meaning that the current price action might lack conviction and could be susceptible to reversals. This divergence between the RSI's potential room for growth and the Stochastic's overbought warning, coupled with the weak trend indicated by the ADX, suggests that short-term traders should exercise caution. A decisive move above $29,647.12 could extend the intraday rally, but a failure to do so might see prices retreat towards the $29,548.84 support level.
The 4-Hour Chart: Bullish Momentum Amidst Caution
Shifting to the 4-hour timeframe, the Nasdaq 100 exhibits a more optimistic, albeit cautious, technical profile. The index is navigating around $29,659.06, with key resistance levels noted at $29,756.06 and support at $29,548.84. The MACD is firmly in positive territory, with the MACD line above the signal line, indicating building bullish momentum. This aligns with the RSI(14) reading of 62.83, which, while in the upper range of the neutral zone, still suggests room for upward movement before reaching overbought conditions. The Stochastic Oscillator, however, presents a more aggressive bullish signal, with %K at 97.85 and %D at 86.96, indicating a potential overbought situation and a possible imminent pullback or consolidation. The ADX at 24.23 points to a moderate uptrend, suggesting that while there is directional strength, it's not yet an overpowering trend. This blend of strong momentum signals and potential overbought conditions on the Stochastic suggests that while the path of least resistance may be upward, traders should be mindful of potential pullbacks or periods of sideways trading. A sustained move above the $29,756.06 resistance could open the door for further gains, while a failure to break through might lead to a retracement towards the $29,548.84 support.
The Daily Chart: A Tale of Two Trends
The daily chart for the Nasdaq 100 presents the most complex picture, reflecting a potential tug-of-war between short-term optimism and longer-term bearish pressures. Currently trading at $29,659.06, the index faces significant resistance at $29,638.99 and $30,057.33, while key support levels are identified at $29,548.84 and $28,992.27. The MACD is in negative territory, with the MACD line below the signal line, suggesting bearish momentum is present on this longer timeframe. The RSI(14) is at 45.35, firmly in the neutral zone but leaning towards a bearish bias, indicating that buyers are not yet in full control. The Stochastic Oscillator, however, shows a bullish signal, with %K at 42.97 and %D at 29.88, suggesting a potential upward swing from current levels. The ADX at 47.51 is particularly noteworthy; it indicates a strong downtrend, suggesting that despite any short-term rallies, the overarching market structure on the daily chart might still be bearish. This conflicting data between shorter-term bullish signals and the longer-term bearish trend indicated by the ADX and MACD highlights the importance of the $29,638.99 resistance level. A failure to decisively break and hold above this level could see the index reverse and test its daily support levels, especially if upcoming economic data proves unfavorable or if geopolitical risks escalate.
Economic Calendar: What to Watch Next
Looking ahead, the economic calendar is laden with events that could significantly impact the Nasdaq 100. The immediate focus remains on the US Consumer Price Index (CPI) data, which is crucial for gauging inflationary trends and, by extension, the Federal Reserve's monetary policy path. Following the CPI release, market participants will be keenly awaiting other high-impact data points. Employment figures, such as Non-Farm Payrolls (NFP) and unemployment rate changes, will provide further insights into the health of the US labor market, a key consideration for the Fed. Manufacturing and services PMIs will offer a pulse check on economic activity and growth prospects. Any significant deviations from expectations in these reports could trigger substantial volatility across financial markets, including the Nasdaq 100. Furthermore, statements and meeting minutes from central banks, including the Federal Reserve, European Central Bank (ECB), and Bank of Japan (BoJ), will be scrutinized for any shifts in tone or policy outlook. Understanding how these upcoming releases align or diverge from current market pricing of interest rate expectations will be critical for anticipating the next major move in the Nasdaq 100.
Geopolitical Tensions and Market Stability
While economic data often takes center stage, geopolitical developments continue to cast a long shadow over market stability, impacting indices like the Nasdaq 100. Ongoing tensions in various global hotspots, from the Middle East to Eastern Europe, can introduce significant risk premiums into the market. Such events can trigger safe-haven flows, often benefiting assets like gold (currently at $4054.46) and the US Dollar (DXY at 100.89), while putting pressure on riskier assets such as equities. The tech sector, which forms the backbone of the Nasdaq 100, can be particularly sensitive to geopolitical instability due to its global supply chains and international revenue streams. For instance, disruptions in trade relations, escalating conflicts, or unexpected political shifts in major economies can lead to heightened uncertainty, causing investors to de-risk their portfolios. Analysts are closely monitoring developments related to US-China trade relations, European energy security, and any major election outcomes that could introduce policy uncertainty. The market's reaction to these geopolitical narratives, often amplified by news headlines from sources like Reuters and Bloomberg, will play a vital role in shaping overall risk appetite and influencing the Nasdaq 100's performance.
Scenario Analysis: Nasdaq 100's Path Forward
Given the current confluence of macroeconomic data, central bank policy signals, and technical chart patterns, several scenarios could unfold for the Nasdaq 100. The immediate price action around the $29,659.06 level, and specifically the ability to break or hold the $29,638.99 resistance, will be key. A bullish scenario hinges on a favorable CPI report, reinforcing expectations of a Fed pause or pivot, and a decisive break above resistance. This could propel the index towards higher targets, potentially retesting psychological levels or even new highs, supported by strong risk appetite and a weakening dollar. Conversely, a bearish scenario could be triggered by an unexpectedly high CPI reading, hawkish Fed commentary, or escalating geopolitical risks. In such a case, a failure to hold the $29,548.84 support could lead to a more significant pullback, testing lower support levels as investors seek safer assets. A neutral scenario anticipates continued consolidation, with the index trading within a defined range as market participants await clearer signals from upcoming economic data or central bank communications. The ADX readings across different timeframes suggest that while trends can be strong, the current picture is mixed, making the resolution of these conflicting signals crucial.
Bullish Scenario: Breakout Above Resistance
65% ProbabilityBearish Scenario: Resistance Holds Firm
25% ProbabilityNeutral Scenario: Range-Bound Consolidation
10% ProbabilityFrequently Asked Questions: Nasdaq100 Analysis
What happens if the Nasdaq 100 breaks above the $29,638.99 resistance level amid cooler CPI data?
A confirmed break above $29,638.99, especially with softer CPI data, could trigger a bullish scenario. This would likely lead to price action targeting the $29,756.06 resistance on the 4-hour chart, and potentially extend towards the $30,057.33 daily resistance level as risk appetite increases.
Should I buy the Nasdaq 100 at current levels near $29,659.06 given the mixed technical signals?
Buying at current levels requires careful risk management due to conflicting signals across timeframes. The 1-hour chart shows potential overbought conditions with Stochastic at 72.32, while the daily ADX at 47.51 suggests a strong downtrend. A more prudent approach might be to wait for a confirmed breakout above $29,638.99 or a pullback to support levels like $29,548.84 before considering entry, aiming for a favorable risk-reward ratio.
Is the RSI at 45.35 on the daily chart a sell signal for the Nasdaq 100 right now?
An RSI of 45.35 on the daily chart is not a definitive sell signal; it sits in the neutral zone but leans bearishly. While it indicates that buyers are not fully in control, it doesn't signal panic selling. This reading, combined with the strong daily ADX of 47.51, suggests underlying bearish momentum, making a sustained move above resistance levels crucial for invalidating this bearish bias.
How will the upcoming US CPI data and Fed rate expectations affect the Nasdaq 100 this week?
Softer CPI data could reinforce expectations of a Fed pause or pivot, potentially weakening the dollar (DXY at 100.89) and boosting the Nasdaq 100 towards resistance levels. Conversely, hotter inflation would likely increase Fed hike bets, strengthen the dollar, and pressure the Nasdaq 100 downwards, potentially towards its support at $29,548.84. Market sentiment will hinge on whether the data confirms or contradicts current rate expectations.
The Nasdaq 100 stands at a pivotal point, caught between the immediate pressures of inflation data and the longer-term implications of Federal Reserve policy. While short-term technicals may offer glimmers of bullish momentum, the underlying trend on the daily chart, coupled with the ever-present influence of macroeconomic factors and geopolitical stability, demands a cautious yet informed approach. Traders and investors must remain vigilant, closely monitoring the price action around the $29,659.06 level and the critical $29,638.99 resistance. Patience and disciplined risk management will be key as the market digests incoming data and seeks clearer direction.
Track markets in real-time
AI-powered analysis, technical indicators and real-time price data.
Join Our Telegram Channel
Breaking market news, AI analysis and trading signals instantly.
Join Channel