

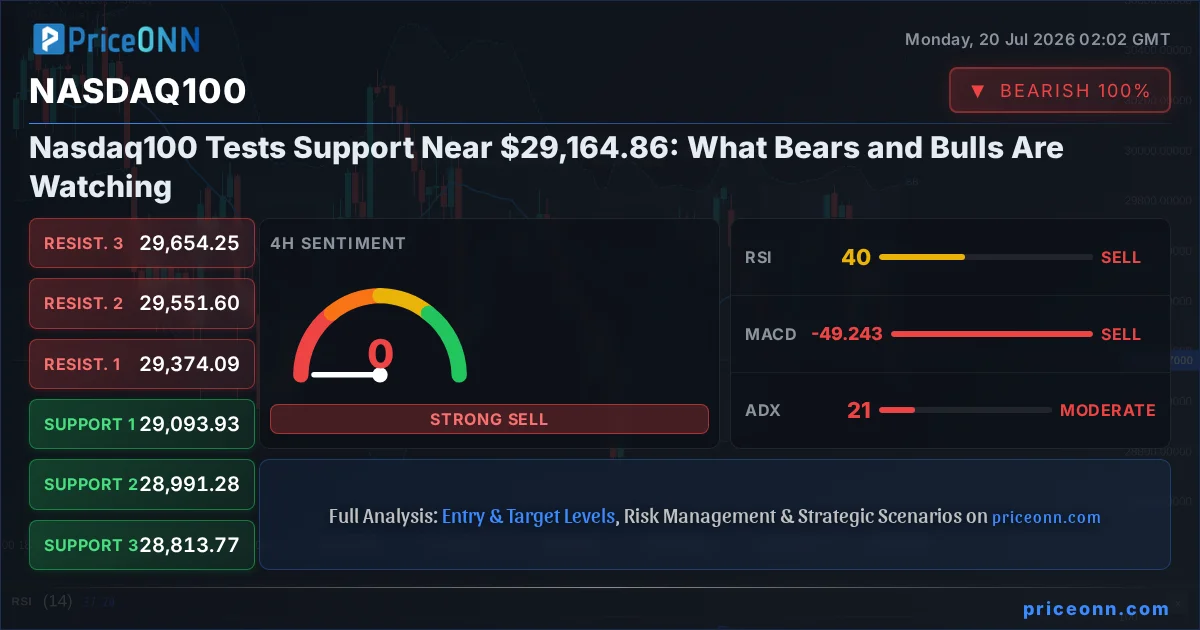
The Nasdaq100 index is currently navigating a crucial juncture, trading at precisely $29,164.86. This level represents a significant test of support, where the market's next directional conviction will likely be forged. Following a notable daily decline of -1.16%, the index is grappling with bearish momentum across multiple timeframes, yet the underlying trend strength indicators present a complex picture that warrants a deep dive. Understanding the interplay between technical signals, broader market correlations, and potential geopolitical undercurrents is paramount for traders aiming to position themselves effectively in this volatile environment.
- The Nasdaq100 is currently trading at $29,164.86, a critical support level following a recent 1.16% drop.
- RSI at 32.77 on the 1H chart signals bearish pressure, while the 1D ADX at 46.36 indicates a strong downtrend.
- Key support is identified at $29,135.55 (1H) and $29,093.93 (4H), with resistance seen at $29,260.86 (1H) and $29,374.09 (4H).
- The correlation with a strengthening DXY at 100.7 is adding pressure, while the SP500's mixed signals require close monitoring.
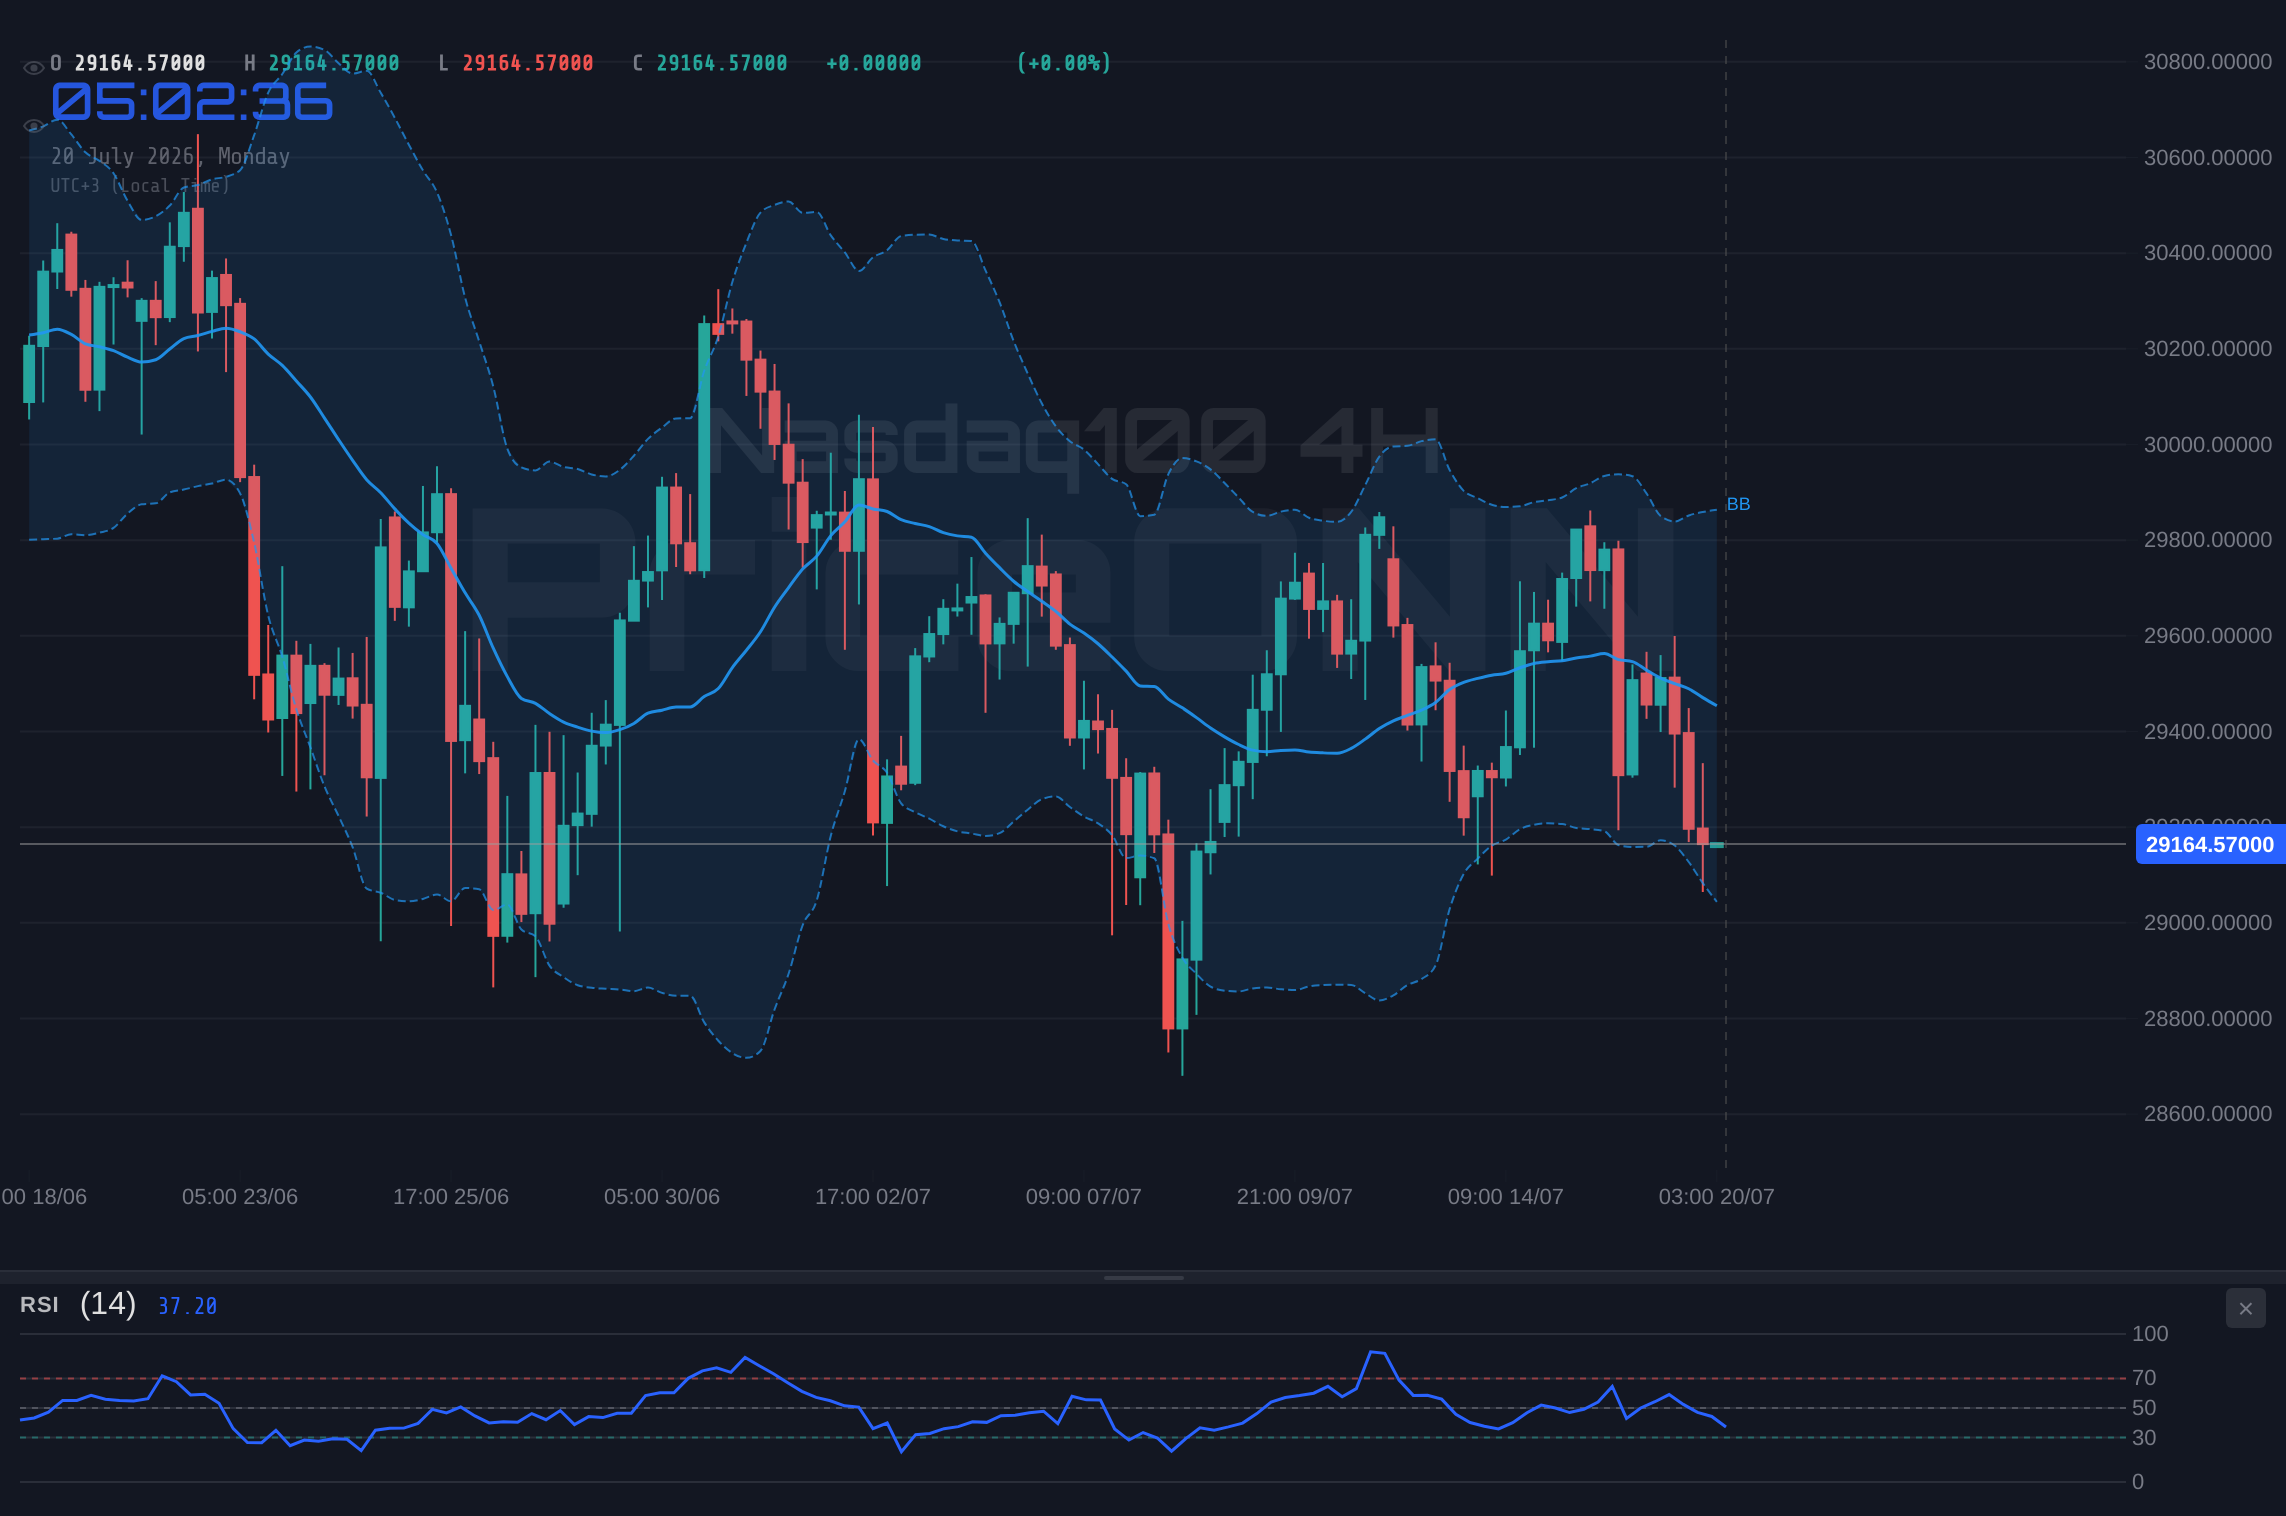
The technical landscape for the Nasdaq100 is currently leaning towards caution, with several indicators flashing warning signs for bulls. On the 1-hour chart, the Relative Strength Index (RSI) at 32.77 firmly plants us in oversold territory, suggesting a potential for a short-term bounce, but this is juxtaposed with negative MACD momentum and the price trading below the middle Bollinger Band, indicating a prevailing downward bias. The ADX at 33.23 on this timeframe points to a strong downtrend, reinforcing the bearish sentiment. However, the Stochastic oscillator's crossover (K=30.97, D=20.52) hints at a potential upward reversal, creating a conflicting signal that demands careful observation. This divergence between momentum indicators and trend strength suggests that while a bounce might be on the cards, the conviction behind it could be weak unless confirmed by other factors.
Delving into the 4-hour timeframe, the picture becomes slightly more nuanced, yet still predominantly bearish. The trend strength is rated at 50% neutral, but the ADX reading of 21.06 indicates a moderate trend in play, which is currently downwards as per the MACD being below its signal line and the price action below the middle Bollinger Band. The RSI here sits at 39.92, still in the neutral zone but leaning towards oversold conditions, which could precede a rebound. The Stochastic oscillator on this timeframe (K=15.62, D=35.37) clearly signals a bearish trend, with the %K line below the %D line, reinforcing the selling pressure. This mixed signal environment, especially the weak trend strength on the 4-hour chart despite the 1D chart's strong downtrend signal, suggests a period of consolidation or a potential for a sharp move in either direction once liquidity is sufficiently tested. The immediate focus remains on the support levels.
Navigating the Price Action: Key Levels and Correlations
The immediate price action on the Nasdaq100 is being dictated by its proximity to critical support levels. On the 1-hour chart, the first line of defense is at $29,135.55, followed by $29,076.62 and then $29,010.24. A decisive break below these levels could trigger a cascade of selling, targeting lower price points. Conversely, resistance looms at $29,260.86, $29,327.24, and $29,386.17. For the bulls to regain control, a sustained push above these resistance zones is imperative. The current trading range between the immediate support and resistance on the 1-hour chart is relatively tight, indicating a potential for a breakout or breakdown scenario to unfold as traders position themselves ahead of further market developments.
The broader market context, particularly the movement of the US Dollar Index (DXY) and the S&P 500, plays a pivotal role in shaping the Nasdaq100's trajectory. The DXY is currently showing strength, trading at 100.7. This strengthens the inverse correlation typically observed between the dollar and risk assets like the Nasdaq100. A rising DXY often signifies a 'risk-off' sentiment, prompting investors to move away from growth-oriented tech stocks towards safer havens. Simultaneously, the S&P 500, a broader gauge of the US equity market, presents a mixed technical picture. While its 1-hour chart shows a bullish trend with RSI at 70.95 (though nearing overbought), the daily chart indicates a bearish trend with RSI at 45.35. This divergence within the equity space adds another layer of complexity, suggesting that the Nasdaq100's next move might not be a clean reflection of the broader market's sentiment, but rather influenced by its own unique technical drivers and sector-specific news.
The energy markets, particularly WTI crude oil at $79.59 and Brent crude at $83.79, also warrant attention due to their indirect impact on inflation expectations and, consequently, central bank policy. While current oil price movements show a slight bearish trend on the 1-hour, the daily charts indicate potential upside. Any significant surge in oil prices could reignite inflation fears, potentially pressuring the Federal Reserve to maintain a hawkish stance, which would be detrimental to growth stocks like those heavily represented in the Nasdaq100. Conversely, stable or falling energy prices could support a more dovish outlook, creating a more favourable environment for tech equities. The interplay between these correlated assets is crucial for a comprehensive Nasdaq100 trading strategy.
Geopolitical Tensions and Fed Expectations: Recent reports highlighting NATO tensions and ongoing discussions about potential US-Iran escalations are adding a layer of geopolitical risk premium to energy markets. This, coupled with the Federal Reserve's stance on inflation, creates a challenging environment. Traders must remain vigilant for any news that could significantly shift inflation expectations or Fed policy, as these are key catalysts for the Nasdaq100's direction.
Looking at the longer-term daily timeframe for the Nasdaq100, the trend is firmly established as bearish, with a strong trend power indicated by ADX at 46.36. The RSI at 46.36, while in the neutral zone, shows a downward tendency, suggesting that bearish momentum is still in play. The MACD histogram is negative and below its signal line, confirming the prevailing selling pressure. The price is also trading below the middle Bollinger Band, a common indicator of a bearish trend. However, the Stochastic oscillator on the daily chart (K=58.96, D=53.46) is showing a bullish signal, indicating that the index might be approaching oversold conditions or preparing for a potential rebound. This daily perspective underscores the importance of the current support levels; a failure to hold them could lead to a significant downturn, while a successful defense might pave the way for a corrective rally.
The interplay between different timeframes is critical in understanding the Nasdaq100's immediate prospects. While the 1-hour and daily charts lean bearish, the 4-hour chart presents a more neutral stance, suggesting a potential battleground where short-term bounces could occur within a larger downtrend. The ADX readings across these timeframes (33.23 on 1H, 21.06 on 4H, 46.36 on 1D) highlight varying degrees of trend strength, from strong downtrends to moderate and then back to strong. This inconsistency implies that the market is in a state of flux, possibly consolidating before the next major directional move. Traders should pay close attention to how price reacts at the key support and resistance levels identified across these different analytical lenses, as confluence between multiple timeframes can signal higher-probability trading opportunities.
The Stochastics Conundrum: Notice the conflicting signals from the Stochastic oscillator. On the 1H chart, it's showing an upward signal (K > D), but on the 4H and 1D, it's either bearish or poised for a bearish crossover. This often happens when an asset is testing significant support. A bullish crossover on the 1H might just be a temporary relief bounce within a larger downtrend, especially if the 4H and 1D Stochastic continue to trend lower or fail to confirm strength. Confirmation from price action holding above key support levels and breaking through immediate resistance is essential before trusting any short-term bullish signals.
Considering the current technical setup and the prevailing market sentiment, a cautious approach is warranted. The Nasdaq100 is showing signs of bearish exhaustion on shorter timeframes, but the overall trend, particularly on the daily chart, remains downward. The strength of the US Dollar Index (DXY) at 100.7 is a significant headwind, and any further appreciation of the dollar could pressure the Nasdaq100 lower. Furthermore, the mixed signals from the S&P 500 and the volatile energy markets add to the uncertainty. For now, the $29,164.86 level acts as a critical pivot. A hold here could lead to a corrective rally, targeting the $29,260.86 resistance. However, a break below this support zone could accelerate selling pressure, potentially revisiting the $29,093.93 area.
Bearish Scenario: Breakdown Below Support
65% ProbabilityNeutral Scenario: Consolidation Around Support
25% ProbabilityBullish Scenario: Bounce from Support
10% ProbabilityFrequently Asked Questions: Nasdaq100 Analysis
What happens if the Nasdaq100 breaks below the $29,135.55 support level?
A break below the $29,135.55 support on the 1-hour chart could trigger further selling pressure, potentially leading to a retest of the $29,093.93 level on the 4-hour timeframe. The ADX reading of 46.36 on the daily chart suggests that a breakdown could accelerate into a strong downtrend.
Should traders buy the Nasdaq100 at current levels of $29,164.86 given the RSI is at 32.77?
Buying solely based on the 1-hour RSI at 32.77 is risky, as this could merely be a temporary bounce within a larger downtrend. Confirmation is needed, such as holding the $29,135.55 support and a break above the $29,260.86 resistance, before considering a long position. The 4H and 1D Stochastic signals also suggest caution.
Is the Stochastic crossover on the 1H chart a reliable buy signal for the Nasdaq100 at $29,164.86?
The Stochastic crossover (K=30.97, D=20.52) on the 1-hour chart suggests a potential short-term upward move. However, this signal conflicts with the bearish indications from the MACD and Bollinger Bands on the same timeframe, and the stronger bearish signals on the 4H and 1D charts. It should be viewed as a potential minor bounce rather than a trend reversal signal.
How will the DXY at 100.7 and potential Fed policy shifts affect the Nasdaq100 this week?
A DXY at 100.7 typically puts downward pressure on risk assets like the Nasdaq100 due to its inverse correlation. If upcoming economic data or Fed commentary reinforces expectations of higher-for-longer interest rates, this could strengthen the dollar further and exacerbate the downtrend in the Nasdaq100, making levels below $29,000 more likely.
The Nasdaq100 is at a critical juncture, trading at $29,164.86. While short-term indicators may hint at a potential bounce, the prevailing bearish sentiment on the daily chart, coupled with a strengthening dollar and mixed signals from other indices, suggests that caution is the prudent approach. The ability of the index to hold above the $29,135.55 support level will be the immediate determinant of its short-term direction. Traders should remain disciplined, manage risk effectively, and await clearer signals or a confirmed breakout/breakdown before committing to significant positions. Patience in waiting for the right setup is often rewarded in markets like these.
Track markets in real-time
AI-powered analysis, technical indicators and real-time price data.
Join Our Telegram Channel
Breaking market news, AI analysis and trading signals instantly.
Join Channel