

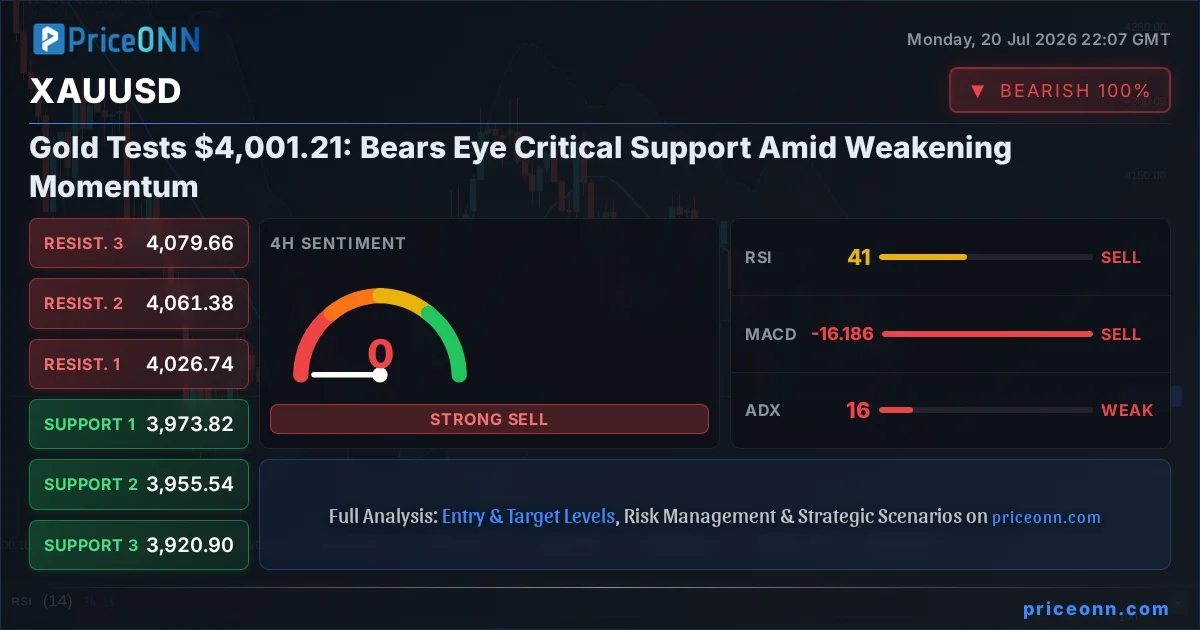
Gold just did something the bulls have been waiting months for – it touched the $4,001.21 mark. But this isn't the triumphant moment they might have hoped for. Instead, the price action is painting a rather grim picture, with bears seemingly circling key support levels. The question on every trader's mind right now isn't 'how high can gold go?', but rather 'how low might it fall before finding solid footing?'. This technical setup demands a closer look, especially given the conflicting signals across different timeframes and the broader market context.
- XAUUSD is currently trading at $4,001.21, with a daily decline of -1.46%, indicating bearish pressure.
- Key support for XAUUSD is observed at $3,991.8 on the 1-hour chart, with further levels at $3,976.78 and $3,964.39.
- The ADX reading of 20.26 on the 1-hour chart suggests a moderately strong downtrend, while the 1D ADX at 39.16 indicates a strong trend.
- RSI at 37.81 (1H) and 40.59 (4H) shows a bearish inclination, while the 1D RSI at 38.86 also leans bearish.
- The Dollar Index (DXY) is rising, currently at 100.7, which typically puts pressure on gold prices.
The daily chart for XAUUSD paints a picture of a market under pressure. With a current price of $4,001.21 and a notable daily drop of -1.46%, the bears have certainly seized the initiative. The trading range for the day, from $3,973.8 to $4,065.47, highlights the volatility, but the overall direction has been downward. This bearish sentiment is further echoed by the technical indicators on the daily timeframe. The ADX, a measure of trend strength, stands at a robust 39.16, confirming a strong prevailing downtrend. This isn't just a minor pullback; it suggests a more significant shift in market sentiment is underway. The RSI(14) at 38.86 also reinforces this view, sitting comfortably in neutral territory but clearly leaning towards oversold conditions, signaling that sellers are in control. While the MACD on the daily chart shows positive momentum with the MACD line above the signal line, this often represents a lagging indicator, and its positive reading might be a relic of the previous upward move rather than a signal for current strength. The Bollinger Bands are also hugging the lower side of the middle band, a classic sign of downward pressure.
Digging into the shorter timeframes, the 1-hour chart presents a slightly more nuanced, yet still bearish, outlook. The trend is officially neutral with a power percentage of 50%, but the immediate signals lean towards a sell. The RSI(14) at 37.81 continues to hover in the neutral zone, maintaining its downward trajectory. This suggests that while the selling pressure might not be extreme, the momentum is clearly not in favor of the bulls. The MACD is also exhibiting negative momentum, with the MACD line sitting below its signal line, further confirming the bearish bias on this timeframe. Bollinger Bands are positioned below the middle band, aligning with the overall bearish sentiment. However, a glimmer of conflicting data comes from the Stochastic oscillator, which shows a potential for a short-term bounce with %K at 40.52 and %D at 37.27, indicating %K is above %D. This divergence, while present, needs to be viewed with caution given the stronger bearish signals elsewhere. The ADX at 20.26 confirms a moderately strong downtrend, not as potent as the daily, but significant enough to warrant attention.
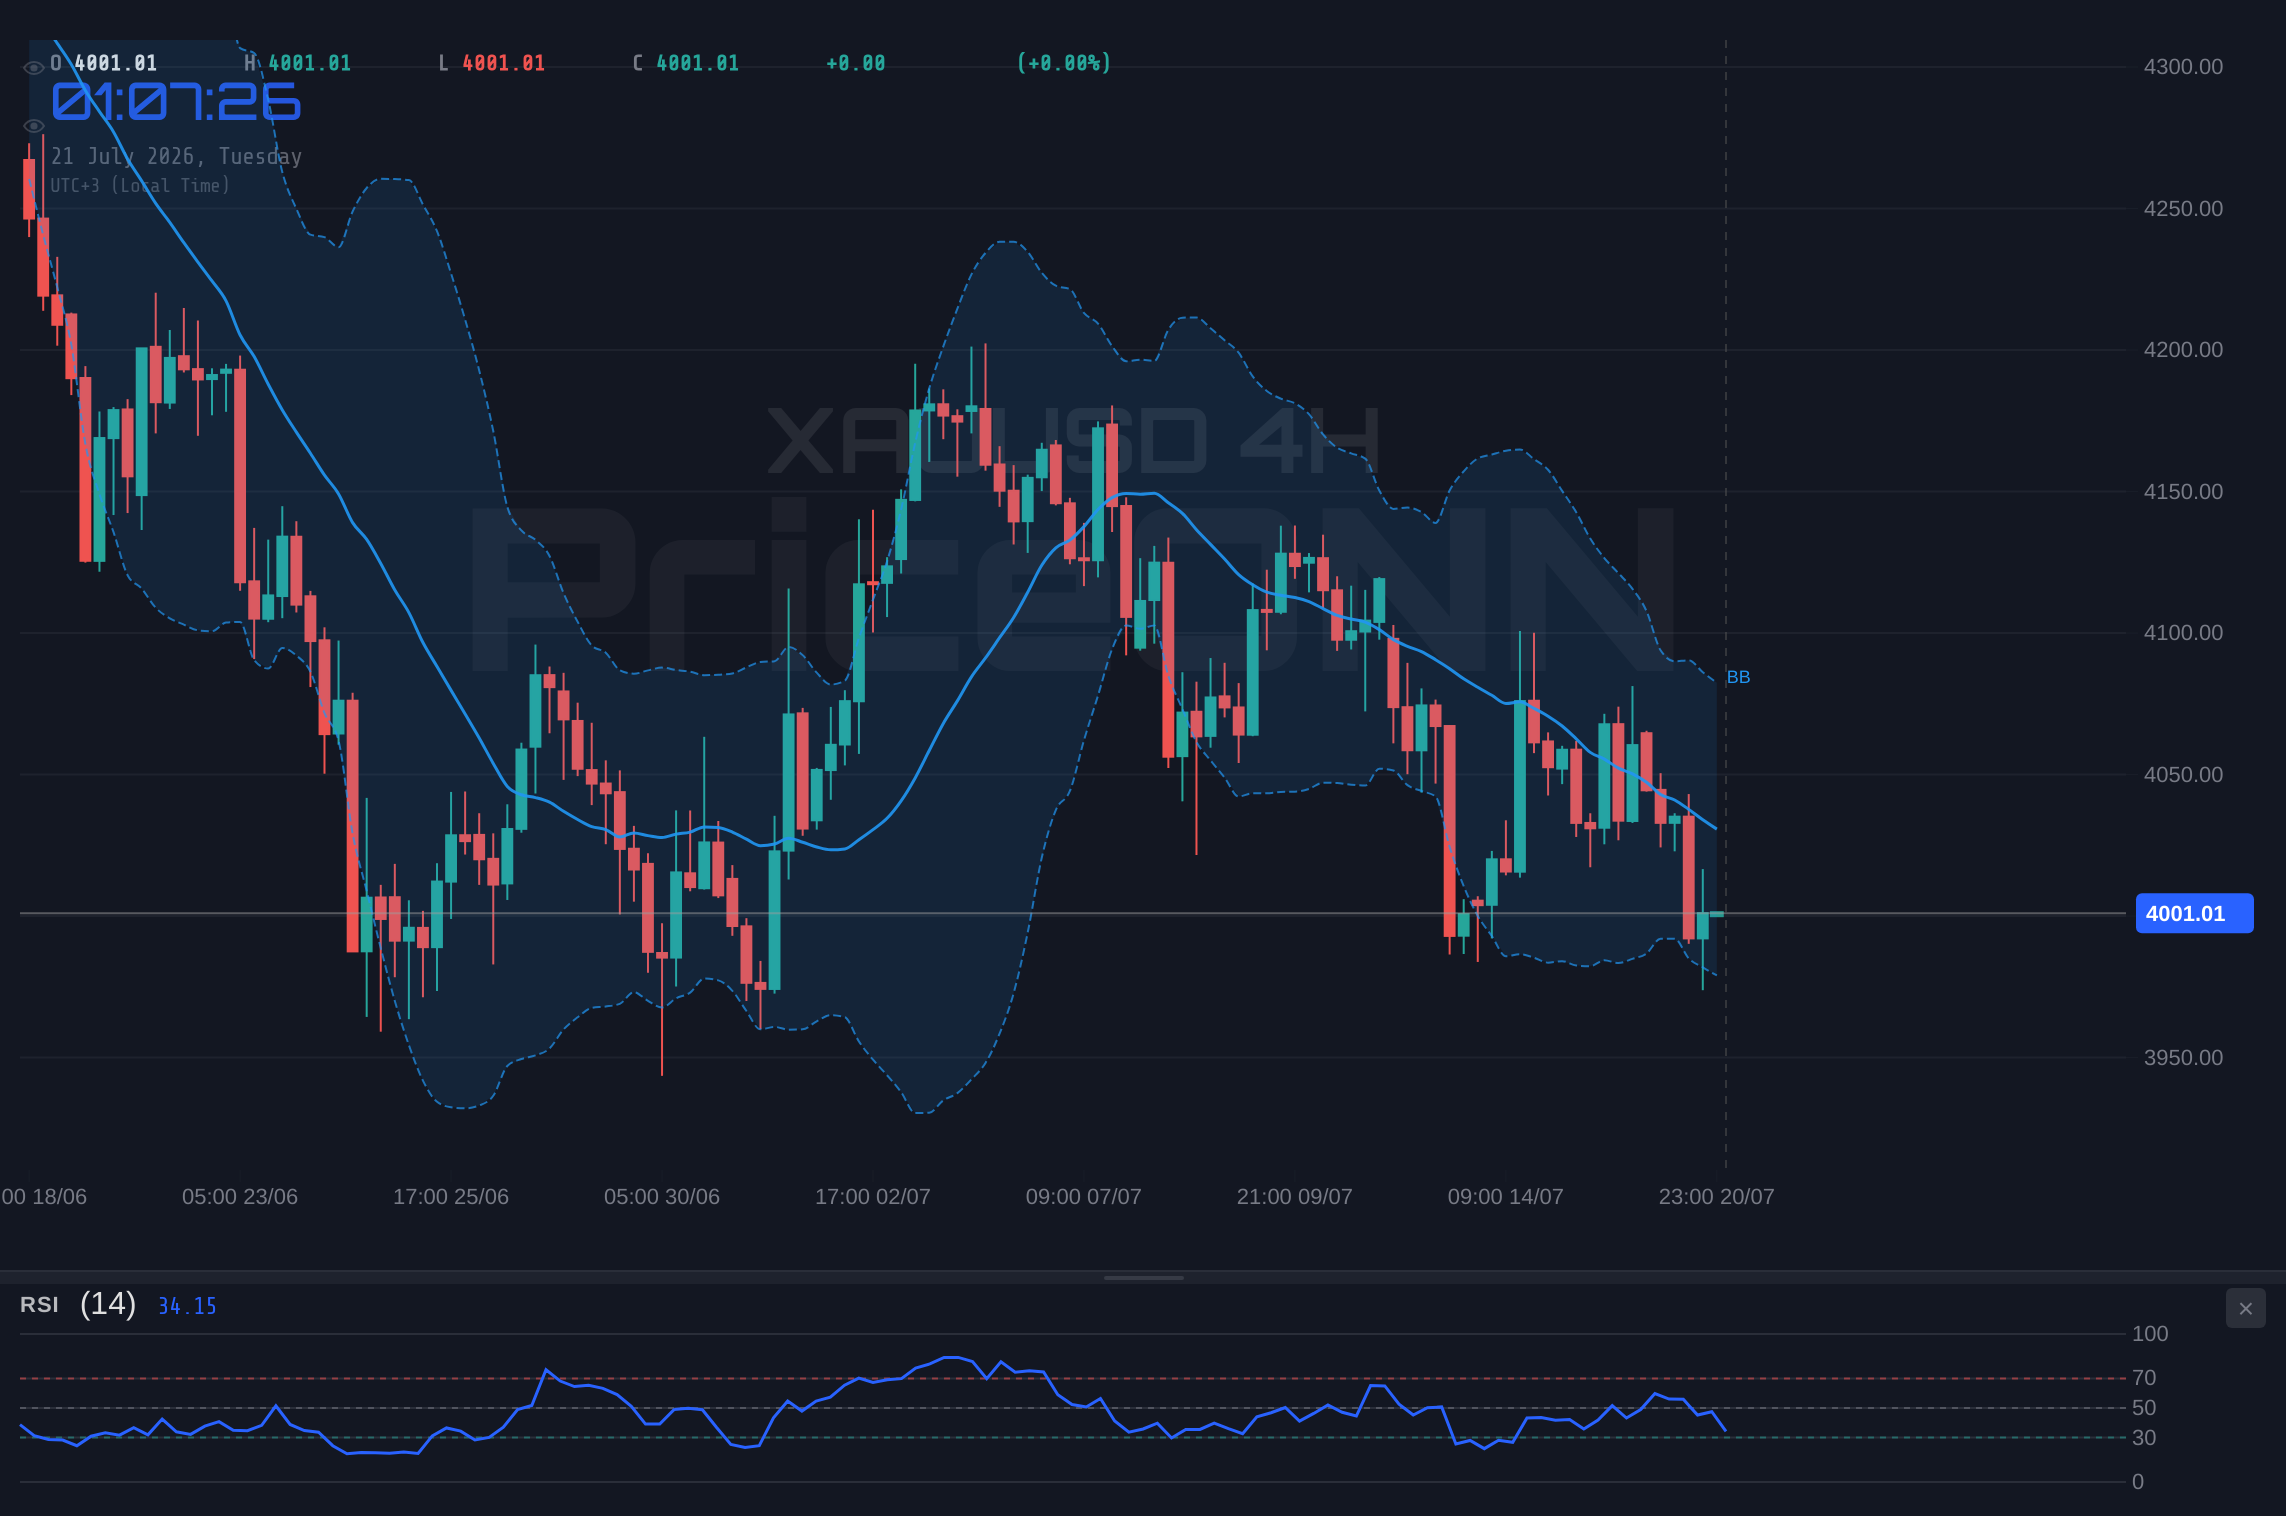
The 4-hour chart solidifies the bearish narrative, showing a defined downtrend with a power strength of 83%. Here, the RSI(14) is at 40.59, still in neutral territory but reinforcing the downward lean. The MACD continues to display negative momentum, with the MACD line firmly below the signal line, indicating that selling pressure is dominant. The Stochastic oscillator on this timeframe presents a more bearish picture than the 1-hour chart, with %K at 18.51 and %D at 31.25, showing a clear bearish signal as %K is below %D and heading lower. This suggests that the downward move has room to continue. The ADX reading of 15.79 indicates a weaker trend on this specific timeframe, potentially pointing to a period of consolidation or choppiness within the broader downtrend. However, when viewed alongside the daily and 1-hour charts, the overall picture remains predominantly bearish. The price is currently hovering above the first key support level of $3,991.8. A break below this level would be a significant signal for further downside.
The interplay between gold and the US Dollar Index (DXY) is a crucial element in understanding XAUUSD's current predicament. The DXY is showing strength, currently trading at 100.7 and exhibiting a rising trend across multiple timeframes, particularly on the 1-hour chart where it has positive momentum and is trading above the upper Bollinger Band. This strengthening dollar typically acts as a headwind for gold prices, as a stronger dollar makes gold more expensive for holders of other currencies. The current DXY level at 100.7, combined with its upward momentum, suggests that this correlation is likely to continue weighing on gold in the short term. Any further strengthening of the dollar could exacerbate the downward pressure on XAUUSD, pushing it towards its support levels. Conversely, a weakening dollar would be a prerequisite for any significant bullish reversal in gold.
Now, let's talk about what this means for traders right now. The overwhelming technical consensus, especially on the daily timeframe, points towards further downside potential for XAUUSD. The ADX at 39.16 on the daily chart is a strong signal that the downtrend is well-established. The primary support level to watch is $3,991.8. A decisive break below this level, especially on increased volume, would likely trigger further selling, potentially targeting the next support at $3,976.78. The conflicting Stochastic signal on the 1-hour chart at 40.52/37.27 could offer a brief intraday bounce, but without a broader shift in trend indicators or a significant change in the DXY, such bounces are likely to be short-lived opportunities for profit-taking rather than the start of a sustained rally. Traders should be wary of trying to catch a falling knife; waiting for clearer confirmation of a bottoming process or a confirmed bullish reversal pattern is paramount.
The current market environment, characterized by a rising DXY and strong daily trend strength in XAUUSD's downtrend, suggests a cautious approach is warranted. While the 1-hour Stochastic shows a slight divergence, it's not enough to override the dominant bearish signals from the daily and 4-hour ADX readings. The price action around $4,001.21 is a critical juncture. Bears are likely looking to establish positions below this level, aiming for the immediate support. Bulls, on the other hand, would need to see a strong reclaim of the $4,019.21 resistance level, coupled with a shift in momentum indicators, to regain confidence. Until then, the path of least resistance appears to be to the downside. The confluence of a strong dollar and established downtrend in gold creates a challenging environment for bullish trades.
Looking at the broader market context, the performance of major equity indices like the SP500 and Nasdaq100 can also provide clues. The SP500 is showing a rising trend on the 1-hour and 4-hour charts, but a strong downtrend on the daily. Currently trading at 6572.87, its daily gain of 0.74% might suggest some risk appetite, but the daily downtrend indicates underlying weakness. The Nasdaq100, on the other hand, is in a clear downtrend across multiple timeframes, trading at 29164.86 with a significant daily drop of -1.16%. This broader risk-off sentiment in tech stocks could indirectly support safe-haven assets like gold, but this effect seems to be currently overshadowed by the dollar's strength and gold's own technical bearish setup. If equity markets were to experience a sharper sell-off, it could potentially trigger a flight to safety, but the current data doesn't strongly support this scenario for gold just yet.
The geopolitical landscape also plays a role, particularly concerning oil prices. Brent Crude is showing mixed signals, with a strong bullish trend on the 4-hour and daily charts, but a bearish bias on the 1-hour. WTI is also showing a similar pattern. Elevated oil prices can contribute to inflation concerns, which typically benefits gold as an inflation hedge. However, the current price action in gold doesn't seem to be significantly benefiting from this factor, likely due to the overriding bearish technicals and the strong dollar. Recent news about renewed US-Iran tensions pushing WTI higher, and Brent briefly breaking $90, highlights the potential for geopolitical events to influence commodity markets. While this could theoretically add a bullish tailwind to gold as a safe haven, the immediate technical picture for XAUUSD remains the dominant driver of price action.
From a trading perspective, the current setup around $4,001.21 presents a classic 'wait and watch' scenario. The strong bearish signals on the daily chart, coupled with the rising DXY, make a long position risky without further confirmation. The immediate support at $3,991.8 is the key level to monitor. A failure to hold this level could accelerate the decline. Conversely, for a bullish setup to emerge, we would need to see XAUUSD reclaim the $4,019.21 resistance, ideally with a bullish turn in the daily MACD and a sustained rise in RSI above 50. Until such conditions materialize, positioning for further downside or waiting for a confirmed reversal seems the more prudent strategy. The market is currently signaling caution, and aggressive bets may lead to significant losses.
The conflicting signals between short-term stochastic suggesting a potential bounce and the longer-term ADX indicating a strong downtrend create a zone of uncertainty. This is precisely why the 'WATCH_ZONE' decision is appropriate here. The market is choppy, and trading against the prevailing daily trend is inherently risky. The ADX reading of 15.79 on the 4-hour chart, while indicating a weaker trend on that specific timeframe, doesn't negate the strength shown on the daily. The key is to wait for a clearer commitment from the market. A daily close above the $4,019.21 resistance level would be a significant development, potentially opening the door for a retest of higher levels, perhaps targeting $4,031.6 and beyond. However, until that breakout is confirmed with conviction, caution remains the operative word.
The current technical condition for XAUUSD is one of a strong downtrend on the daily timeframe, with immediate price action testing key support levels. The ADX at 39.16 confirms this strong trend. While the 1-hour Stochastic shows a potential for a short-term bounce, this is counteracted by the overall bearish momentum and the rising Dollar Index (DXY) at 100.7. This confluence of factors suggests that the most probable scenario involves further testing of support levels. A decisive break below $3,991.8 would likely trigger further selling pressure, aligning with the dominant bearish sentiment. Therefore, traders should be looking for opportunities to align with the prevailing trend, but only after confirmation, or to wait for a clear reversal signal above resistance.
Bearish Scenario: Downside Pressure Mounts
70% ProbabilityNeutral Scenario: Consolidation Around $4,001
20% ProbabilityBullish Scenario: Reversal Potential Emerges
10% ProbabilityFrequently Asked Questions: XAUUSD Analysis
What happens if XAUUSD breaks below the $3,991.8 support level?
A break below $3,991.8 would likely confirm the bearish sentiment, potentially triggering further selling pressure towards $3,976.78. This would align with the strong daily downtrend indicated by the ADX at 39.16.
Should I consider buying XAUUSD at current levels around $4,001.21 given the mixed Stochastic signal?
Buying at current levels is risky due to the dominant daily downtrend and rising DXY. While the 1-hour Stochastic shows a potential bounce (40.52/%K > 37.27/%D), confirmation above $4,019.21 resistance is needed for a high-probability bullish setup.
Is the RSI at 38.86 on the daily chart a sell signal for XAUUSD?
An RSI of 38.86 on the daily chart indicates bearish inclination, sitting in neutral territory but trending downwards. While not yet oversold, it confirms that sellers are in control and suggests further downside is possible.
How will the rising Dollar Index (DXY) at 100.7 impact XAUUSD's price action this week?
The rising DXY generally puts downward pressure on gold, making it more expensive for foreign buyers. With the DXY at 100.7 and showing bullish momentum, this is likely to continue weighing on XAUUSD unless other factors strongly intervene.
Track markets in real-time
AI-powered analysis, technical indicators and real-time price data.
Join Our Telegram Channel
Breaking market news, AI analysis and trading signals instantly.
Join Channel