

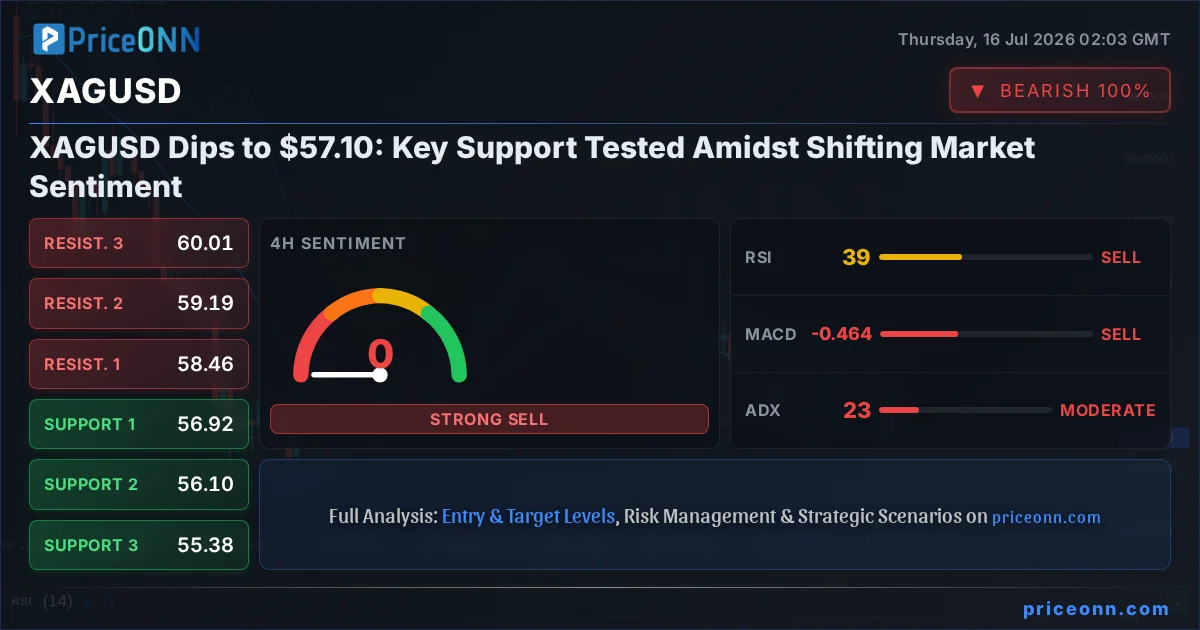
Is Silver (XAGUSD) poised for a bounce as it hovers around the $57.10 mark, or will the bears drag it lower? The precious metal has seen a sharp pullback, with its price currently sitting at $57.10 after a significant daily decline of -2.66%. This move has brought XAGUSD to a crucial juncture, testing key support levels that traders are closely watching. The question on everyone's mind is whether this dip represents a buying opportunity or the prelude to a deeper correction. With the Dollar Index (DXY) showing signs of weakness, currently trading at 100.53 and down -0.38% on the day, there's a potential tailwind for precious metals. However, the broader market sentiment, influenced by major indices like the SP500 and Nasdaq, remains a critical factor. The SP500 is up 0.74% at 6572.87, showing resilience, while the Nasdaq has dipped -0.46% to 29453.89, suggesting a mixed risk appetite. This complex interplay of factors creates a challenging environment for silver traders, demanding a detailed look at the technical indicators and potential scenarios.
- XAGUSD is currently trading at $57.10, testing key support levels.
- The 1-hour RSI at 37.17 suggests oversold conditions, while the 1-day ADX at 41.38 indicates a strong downtrend.
- Key support is identified at $57.13, with resistance at $57.69 on the 1-hour chart.
- The Dollar Index (DXY) is trading at 100.53, down 0.38%, potentially offering some relief to silver.
The current technical picture for XAGUSD presents a fascinating dichotomy. On the 1-hour chart, the trend is clearly defined as bearish with a strength of 79%, but the ADX at 18.89 indicates a weak trend, suggesting that the current downward momentum might lack conviction. This conflict is further highlighted by the RSI(14) sitting at 37.17, firmly in neutral territory but with a downward tendency, and the Stochastic oscillator showing %K at 46.12 and %D at 51.96, signaling a potential bearish continuation. Bollinger Bands are also showing price trading below the middle band, reinforcing the bearish bias in the short term. The overall signal on this timeframe is a 'SELL', with 8 out of 8 indicators pointing in that direction. However, the weak ADX reading suggests that this might be more of a consolidation within a larger range rather than a definitive trend continuation.
Delving into the 4-hour timeframe offers a slightly different perspective, though still predominantly bearish. The trend is marked as neutral with 50% strength, yet the ADX at 22.74 points to a moderately strong downtrend. The RSI(14) is at 39.67, still in the neutral zone and leaning bearish, while the Stochastic continues its downward trajectory with %K at 21.13 and %D at 47.54. Bollinger Bands on this timeframe also show price below the middle band, supporting the bearish inclination. The overall signal here is also 'SELL', with 8 out of 8 indicators aligned. This suggests that the medium-term outlook remains cautious, with sellers holding the upper hand. The confluence of bearish signals across both the 1-hour and 4-hour charts indicates that any upward movement might be met with selling pressure, especially as price approaches the defined resistance levels.
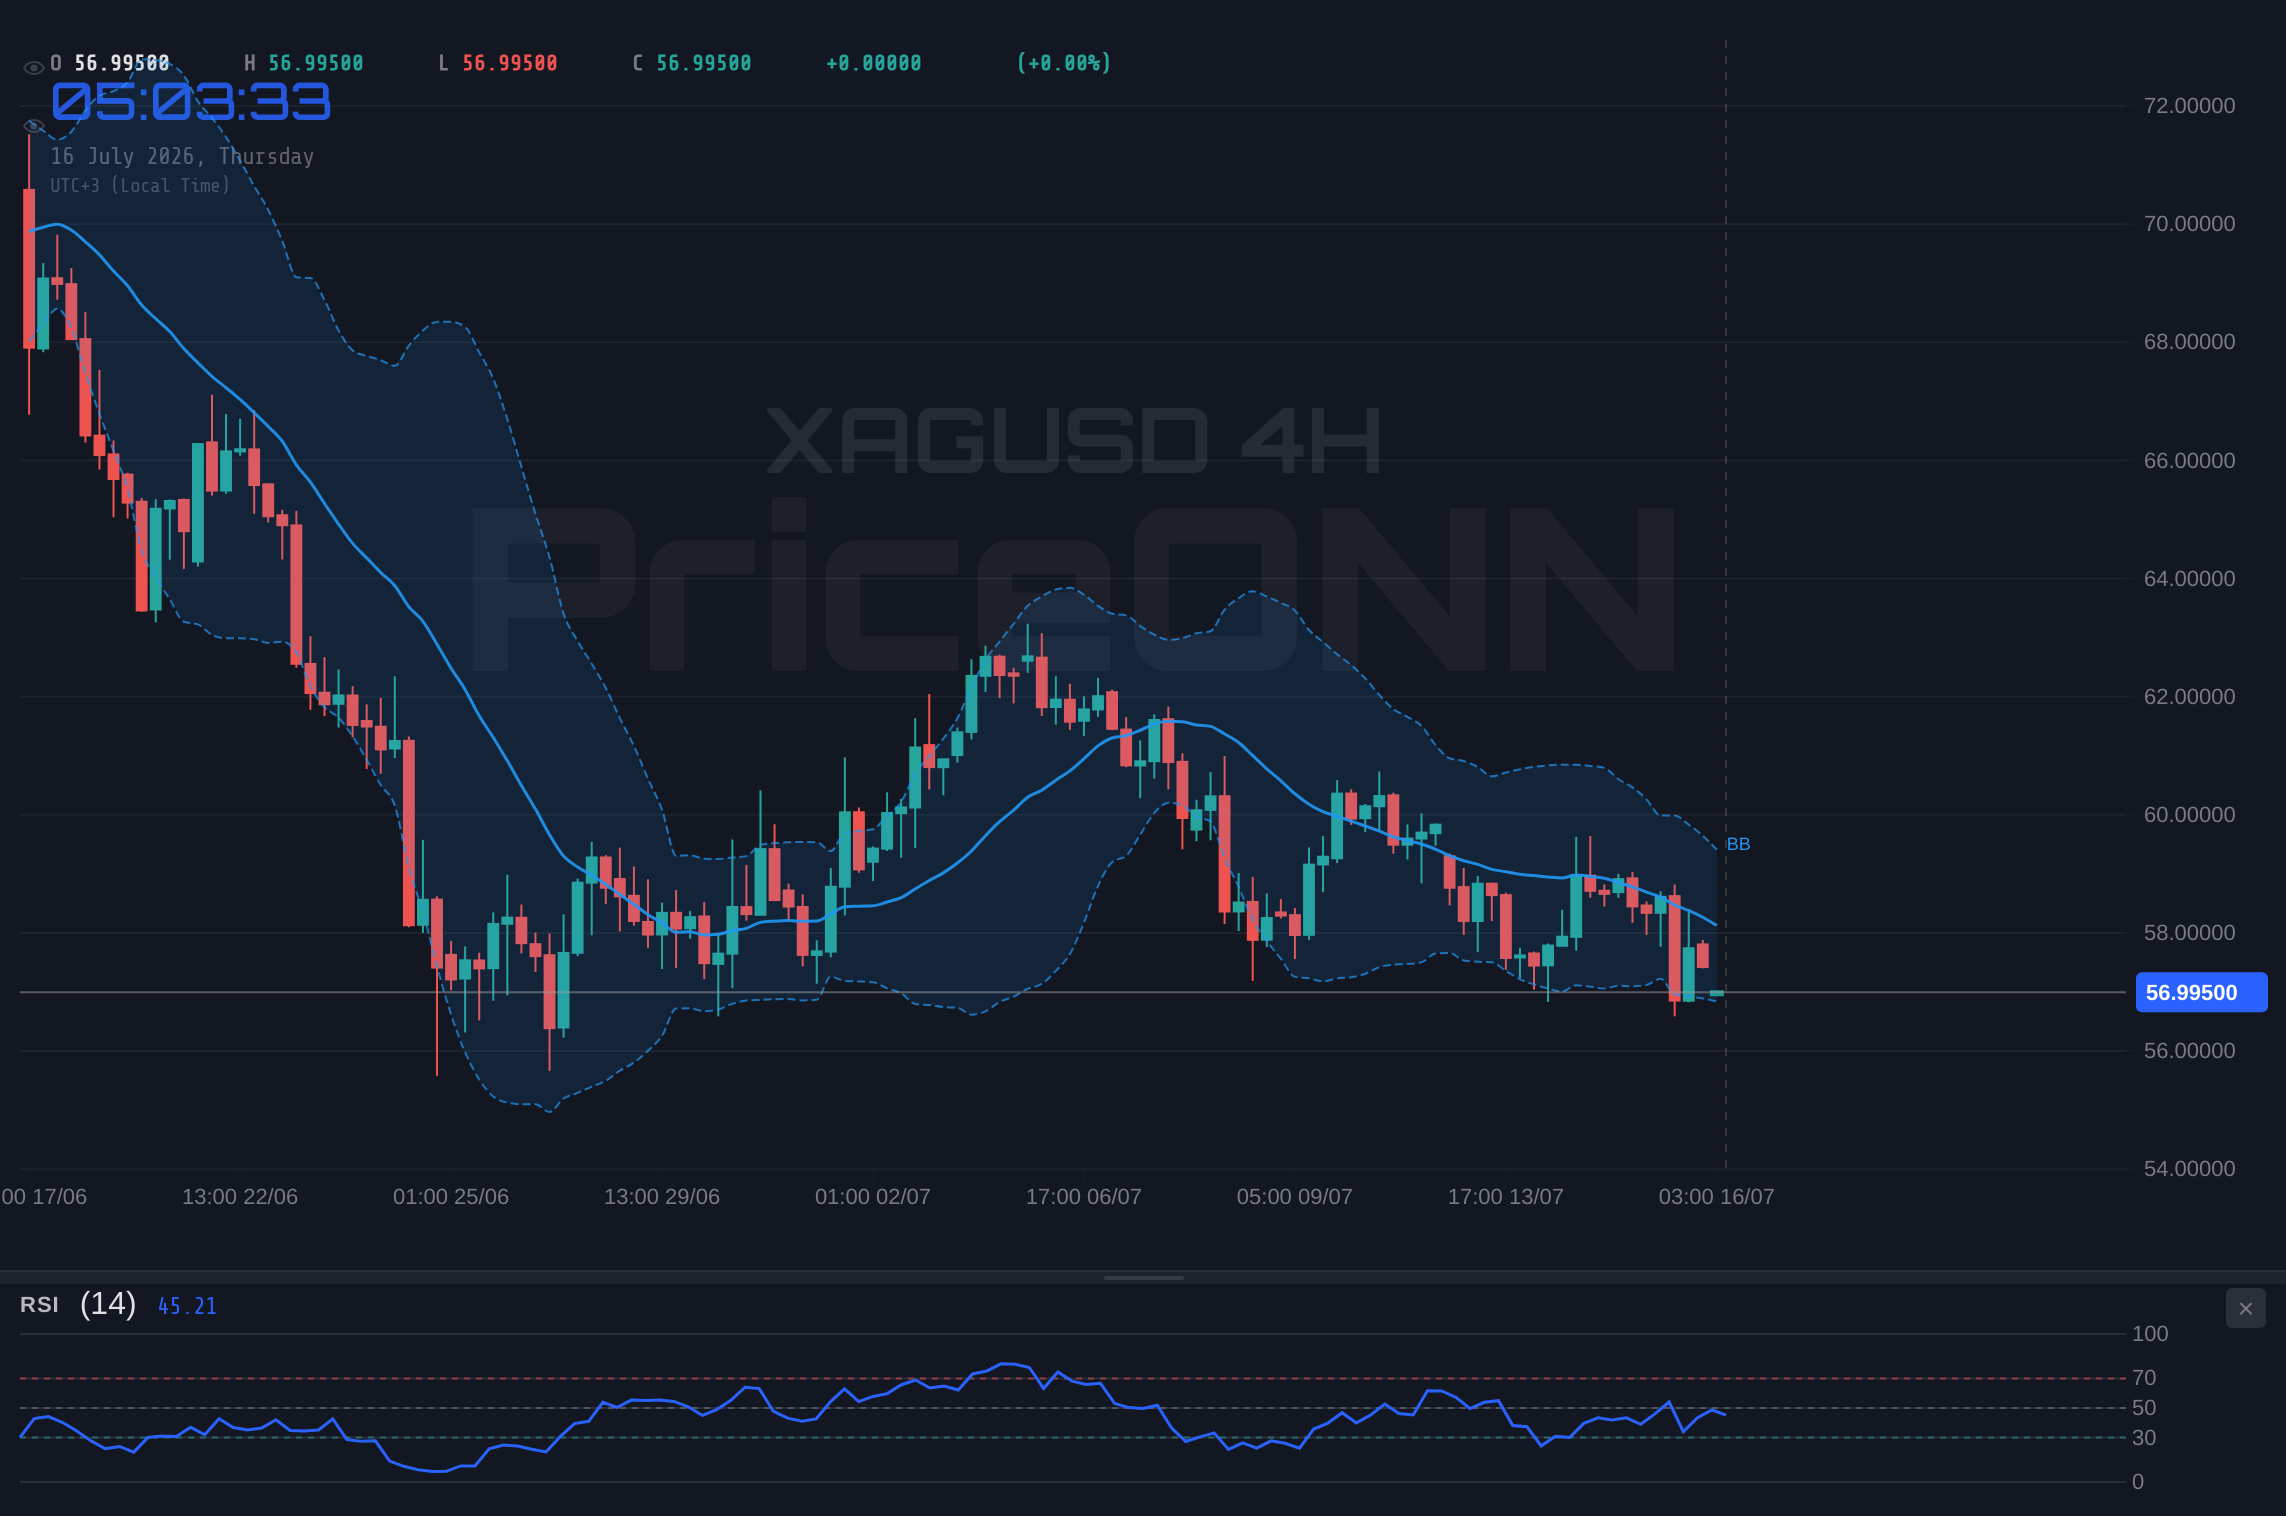
The daily chart paints the most definitive picture, clearly showing a 'Düşüş' (Bearish) trend with a formidable strength of 89%. The ADX here stands at a robust 38.49, confirming a strong, established downtrend. The RSI(14) is at 40.96, still within the neutral zone but clearly trending downwards, indicating room for further decline before hitting oversold territory. The MACD, however, shows positive momentum with the MACD line above the signal line, which is an anomaly in a strong downtrend and might suggest a potential for a short-term bounce or divergence. Bollinger Bands are also below the middle band, consistent with the bearish trend. The Stochastic (%K=24.57, %D=50.93) continues to signal a downward move. The overwhelming 'SELL' signal across multiple indicators on the daily timeframe underscores the prevailing bearish sentiment for XAGUSD.
Considering the correlations, the Dollar Index (DXY) is a key factor to monitor. Currently at 100.53 and trending downwards, a weaker dollar typically provides a tailwind for silver. However, the strong bearish signals on XAGUSD's daily chart suggest that this correlation might be temporarily suppressed, or that other factors are exerting greater downward pressure. The performance of major equity indices also plays a role in risk appetite. The SP500's upward movement (0.74%) indicates some level of risk-on sentiment, which could theoretically support riskier assets. Conversely, the Nasdaq's slight dip (-0.46%) introduces a note of caution. If broader risk aversion takes hold, it could exacerbate the selling pressure on silver, overriding any potential support from a weaker dollar. The interplay between these correlated assets will be crucial in determining the next significant move for XAGUSD.
The recent news flow adds another layer of complexity. A report from July 15th noted that "Silver Risks Falling to $50 as Dollar Holds Firm and Solar Demand Shifts." While the dollar isn't exactly holding firm in this data set (DXY is down), the mention of shifting solar demand and the potential for a significant drop to $50 highlights the underlying bearish pressures that could be at play. Furthermore, the analyst favorite mention of Coeur Mining (CDE) as a top metals pick, while not directly about silver prices, indicates general interest in the metals sector. The broader context of oil prices climbing due to geopolitical tensions could indirectly support inflation expectations, which historically benefits precious metals, but this effect seems to be currently overshadowed by the strong bearish technical signals in silver itself.
Let's break down the most probable scenarios for XAGUSD. Given the current price action and technical indicators, we need to consider how price might react at these support levels. The strength of the daily downtrend (ADX 41.38) is undeniable, but the conflicting signals on shorter timeframes and the weak ADX readings on the 1-hour chart suggest potential for a short-term bounce or at least a pause in the decline. The key will be how price behaves around the immediate support levels of $57.13 and $57.28. A failure to hold these could signal a continuation of the downtrend towards the next significant support at $56.86, while a successful defense might lead to a retest of the resistance levels.
Bearish Scenario: The Downward Grind Continues
65% ProbabilityBullish Scenario: A Short-Covering Rally
15% ProbabilityNeutral Scenario: Range-Bound Consolidation
20% ProbabilityThe most probable scenario, based on the current technical data, leans towards the bearish outlook. The strong daily downtrend (ADX 41.38) and the prevailing 'SELL' signals across multiple timeframes cannot be ignored. While there's a possibility of a short-covering rally or a period of consolidation, the weight of evidence suggests that further downside is more likely unless significant bullish catalysts emerge. The trigger for the bearish scenario is the failure to hold the $57.13 support. If this level gives way, the path to $56.86 and potentially $56.59 becomes clearer. Conversely, for the bullish case to materialize, XAGUSD needs to decisively break above $57.69, which currently seems less likely given the prevailing trend.
The neutral scenario, where silver consolidates between $57.13 and $57.69, is also a possibility, especially if market participants await further directional cues from economic data or geopolitical events. This would likely be characterized by lower trading volumes and choppy price action. However, the strong daily ADX suggests that a prolonged consolidation might be difficult to maintain, and a breakout in either direction is more probable in the medium term.
What I'm watching closely this week are a few key triggers. Firstly, the reaction at the $57.13 support level is paramount. A decisive break below this would be a strong bearish signal. Secondly, I'll be monitoring the DXY for any significant moves; a renewed surge in the dollar could put further pressure on silver. Lastly, I'll be looking at the broader equity markets, particularly the Nasdaq. A significant downturn there could signal a flight to safety, which might offer some respite to silver, but given the current technicals, it's a less probable outcome. The interplay between these factors will dictate whether silver finds a bottom or continues its descent.
Upcoming economic data releases, such as CPI data scheduled for July 14th, can introduce significant volatility and potentially override technical signals. Traders should exercise caution and employ robust risk management strategies, especially around these events.
Fundamental Drivers Influencing XAGUSD
Beyond the immediate technicals, several fundamental factors are at play, influencing the price of silver. The US Dollar Index (DXY) currently stands at 100.53, down 0.38% on the day. A weaker dollar generally bodes well for commodities priced in USD, including silver, as it makes them cheaper for holders of other currencies. This presents a potential supportive factor for XAGUSD. However, the current bearish technical trend in silver suggests that this dollar weakness is not yet strong enough to counteract the selling pressure, or that other factors are dominating the price action.
Inflationary pressures, often a driver for precious metals like silver, remain a persistent concern globally. While the upcoming US CPI data, due July 14th, is expected to show cooling inflation partly due to tumbling fuel prices, the overall inflation narrative is complex. Central bank policies, particularly those of the Federal Reserve, are closely scrutinized for their impact on interest rates and the broader economic outlook. Higher interest rates tend to increase the opportunity cost of holding non-yielding assets like silver, thus acting as a headwind. Conversely, any signal of a pause or pivot in monetary policy could boost demand for safe-haven assets.
Geopolitical risks also continue to simmer, potentially adding a layer of support for silver as a traditional safe-haven asset. Reports of Iran threatening new energy chokepoints, while primarily impacting oil prices, contribute to a general sense of global uncertainty. While silver's safe-haven appeal is often secondary to gold, significant geopolitical instability can still drive demand. The news that "Silver Risks Falling to $50 as Dollar Holds Firm and Solar Demand Shifts" from July 15th suggests that market participants are factoring in potential downside risks, possibly linked to shifts in industrial demand (like solar) or a stronger-than-expected dollar environment that hasn't materialized today.
The industrial demand for silver, particularly from the solar energy sector, is another critical factor. While the news mentioned shifts in solar demand, the long-term outlook for solar power remains strong, which could provide a fundamental floor for silver prices. However, short-term fluctuations in demand or supply chain disruptions can create volatility. The current bearish technical trend might indicate that industrial demand factors are not currently strong enough to offset broader market sentiment and macroeconomic pressures.
Understanding the interplay between the DXY, inflation expectations, and industrial demand is crucial. While a weaker dollar is bullish for silver, the strong bearish technical signals suggest that traders should prioritize price action confirmation. Look for a decisive break above resistance levels like $57.69 to signal a potential trend change, rather than relying solely on macro factors.
Navigating the Technical Landscape: Key Levels and Indicators
The technical analysis of XAGUSD reveals a market at a critical juncture, with multiple indicators providing conflicting signals across different timeframes. On the 1-hour chart, the trend is decidedly bearish (ADX 18.89, RSI 37.17, Stochastic %K
The 4-hour chart reinforces the bearish sentiment, though with a neutral trend (ADX 22.74, RSI 39.67, Stochastic %K
The divergence between the strong daily downtrend and the weaker trend signals on shorter timeframes is noteworthy. It suggests that while the overall direction is down, there might be room for short-term counter-trend rallies or periods of consolidation. The ADX readings are particularly telling: a strong 41.38 on the daily contrasts with weaker readings on the 1-hour (18.89) and 4-hour (22.74) charts. This implies that the long-term trend is robust, but the immediate momentum might be waning, creating potential for volatility around current levels.
The RSI readings across timeframes (37.17 on 1H, 39.67 on 4H, 40.96 on 1D) consistently hover in the neutral-to-oversold territory, hinting that the downside might be becoming more limited, even within a strong downtrend. Stochastic oscillators also lean bearish, but are not yet in extreme overbought or oversold territory, suggesting further movement is possible. The MACD indicator shows mixed signals: negative momentum on the 1-hour, but positive momentum on the 4-hour and daily charts, further complicating the picture and suggesting that short-term bounces might occur before the broader downtrend resumes.
| Indicator | Value | Signal (1H/4H/1D) | Interpretation |
|---|---|---|---|
| RSI (14) | 37.17 / 39.67 / 40.96 | Bearish / Bearish / Bearish | Nearing oversold, but still room to fall within downtrend. |
| MACD | Neg / Pos / Pos | Bearish / Bullish / Bullish | Mixed momentum signals, suggests potential short-term bounces. |
| Stochastic | K=46.12, D=51.96 / K=21.13, D=47.54 / K=24.57, D=50.93 | Bearish / Bearish / Bearish | Consistent bearish signals across timeframes, %K below %D. |
| ADX | 18.89 / 22.74 / 41.38 | Weak / Moderate / Strong | Daily trend is strong, but shorter timeframes show waning momentum. |
| Bollinger Bands | Below Mid / Below Mid / Below Mid | Bearish / Bearish / Bearish | Price consistently trading below the middle band on all timeframes. |
The confluence of multiple support levels around the $57.10-$57.28 area on the 1-hour and daily charts makes this zone critical. A sustained break below $57.12 on the daily chart would likely trigger significant stop-loss orders and accelerate the downward move.
The Road Ahead: Scenarios and Trade Strategy
Considering the current technical landscape and fundamental backdrop, the most probable scenario for XAGUSD is a continuation of the bearish trend, albeit with potential for short-term consolidation or a minor bounce. The strong daily downtrend, confirmed by an ADX of 41.38, suggests that the path of least resistance remains to the downside. However, the mixed signals on shorter timeframes and the proximity to key support levels introduce an element of uncertainty and potential for tactical trading opportunities.
The primary focus for traders should be on how XAGUSD reacts to the immediate support zone between $57.10 and $57.28. A failure to hold this level could confirm the bearish thesis, leading to a test of lower support levels. Conversely, a successful defense of this area, coupled with a break of short-term resistance, might signal a temporary reprieve or a short-covering rally. The ongoing economic data releases and geopolitical developments will likely inject further volatility, making disciplined risk management paramount.
For those looking to trade this setup, patience and a clear strategy are essential. Waiting for clear confirmation signals, rather than anticipating moves, will be key. This means observing how price interacts with the defined support and resistance levels and confirming any potential trend shifts with robust indicator readings across multiple timeframes. The market is currently presenting a complex picture, and only through careful analysis and adherence to a well-defined trading plan can traders navigate these choppy waters successfully.
Frequently Asked Questions: XAGUSD Analysis
What happens if XAGUSD breaks below the $57.13 support level?
If XAGUSD breaks decisively below the $57.13 support, it would invalidate the current consolidation and likely trigger a move towards the next support at $56.86. This scenario is supported by the strong daily downtrend (ADX 41.38) and bearish signals across multiple timeframes.
Should I consider buying XAGUSD at current levels around $57.10?
Buying at current levels carries significant risk due to the prevailing bearish trend. A more prudent approach would be to wait for confirmation of a bullish reversal, such as a break above $57.69 resistance with strong volume, or a clear bounce from a more significant support level.
Is the RSI at 37.17 a sell signal for XAGUSD?
An RSI of 37.17 is in the neutral zone, leaning towards oversold, but not definitively a sell signal on its own. While it suggests selling momentum might be waning, it can remain in this territory during a strong downtrend. Confirmation from other indicators and price action is necessary.
How will upcoming US CPI data affect XAGUSD this week?
Softer-than-expected CPI data could weaken the US Dollar, potentially offering some support to XAGUSD. However, if the data still indicates persistent inflation, it could lead to expectations of tighter monetary policy, which would likely pressure silver downwards. The market's reaction will depend on the actual figures versus expectations.
Technical Outlook Summary
| Indicator | Value | Signal | Interpretation |
|---|---|---|---|
| RSI (14) | 40.96 | Bearish | Nearing oversold territory, but still room to fall in a strong downtrend. |
| MACD Histogram | +0.09 | Bullish | Positive momentum on daily chart, suggesting potential short-term strength. |
| Stochastic | K=24.57, D=50.93 | Bearish | Consistent bearish signals, %K below %D across timeframes. |
| ADX | 41.38 | Bullish | Strong trend strength on the daily chart, confirming downtrend. |
| Bollinger Bands | Upper Band | Watch | Price consistently below the middle band, indicating bearish pressure. |
Key Levels
Support Levels
Resistance Levels
Track markets in real-time
AI-powered analysis, technical indicators and real-time price data.
Join Our Telegram Channel
Breaking market news, AI analysis and trading signals instantly.
Join Channel