

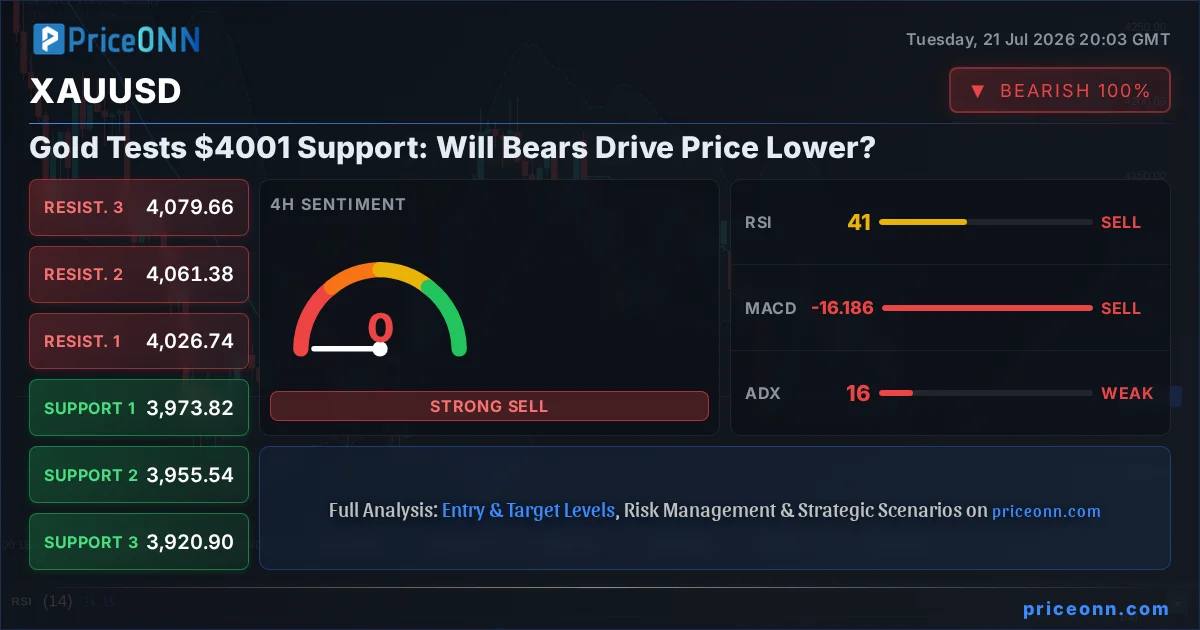
The precious metal, gold (XAUUSD), is currently teetering around the critical $4,001.21 mark, experiencing a notable 1.46% decline today. This price action comes as broader market sentiment shows mixed signals, with the Dollar Index (DXY) attempting a recovery and major equity indices like the S&P 500 showing resilience. For gold traders, the question isn't just whether the current levels will hold, but what underlying forces are driving this volatility and what the coming days might bring. The ADX reading of 20.26 on the 1-hour chart suggests a neutral trend, but the underlying momentum and conflicting signals from indicators like RSI and Stochastic warrant a closer look. This analysis delves into the multi-scenario outlook for gold, examining the conditions that could lead to a sustained move higher or a deeper correction.
- RSI at 37.81 on the 1-hour chart signals waning bearish momentum, but not yet an oversold condition.
- Critical support for XAUUSD sits at $3,991.8, tested intraday; a close below this level could accelerate declines.
- The ADX at 20.26 indicates a neutral trend, suggesting consolidation rather than a strong directional move currently.
- Correlation with DXY (currently at 100.7) remains a key factor, with dollar strength typically pressuring gold prices.
The Bull's Roadmap: Charting a Course Above $4000
For gold to stage a convincing recovery, bulls need to reclaim key psychological and technical levels. The immediate hurdle is the $4,019.21 resistance, a level that has acted as a ceiling during intraday trading. A sustained break and hold above this point, ideally on increasing volume, would signal a shift in short-term sentiment. The next significant resistance lies at $4,031.6, followed by $4,046.62. A move beyond these levels would suggest that the recent pullback was merely a consolidation within a larger uptrend. On the 4-hour chart, the ADX is lower at 15.79, indicating a weaker trend, which could mean that a breakout, once initiated, might be sharper. The Stochastic indicator on the 1-hour chart is showing a bullish crossover (%K > %D) at 40.52, a nascent sign that buyers might be stepping in, though it needs confirmation from other oscillators. Furthermore, a weakening Dollar Index (DXY), currently hovering around 100.7, would provide a crucial tailwind. If the DXY were to fall back below 100.50, it could alleviate pressure on gold and encourage a risk-on sentiment that benefits precious metals.
The daily chart presents a more complex picture. While the 1-hour and 4-hour charts show bearish signals or neutral trends, the daily MACD is showing positive momentum, hovering above its signal line. This divergence suggests that the longer-term trend might still favor buyers, despite the short-term weakness. For a sustained bullish move, gold needs to decisively break above the daily resistance at $4,088.69. This would not only signal a technical breakout but also potentially reflect a shift in macroeconomic sentiment, perhaps driven by inflation concerns or geopolitical uncertainties. The RSI on the daily chart, at 38.86, is still in neutral territory, leaving ample room for upside before entering overbought conditions. A move above 50 would be the first confirmation of a bullish resurgence. Historically, periods of high inflation or geopolitical instability have seen gold act as a safe-haven asset, and any escalation in global tensions could trigger renewed demand, pushing prices towards the $4,100-$4,150 range. However, this bullish thesis hinges on the ability of buyers to defend the $3,991.8 support and build momentum through the intermediate resistance levels.
Where Bears Take Control: The Case for a Deeper Decline
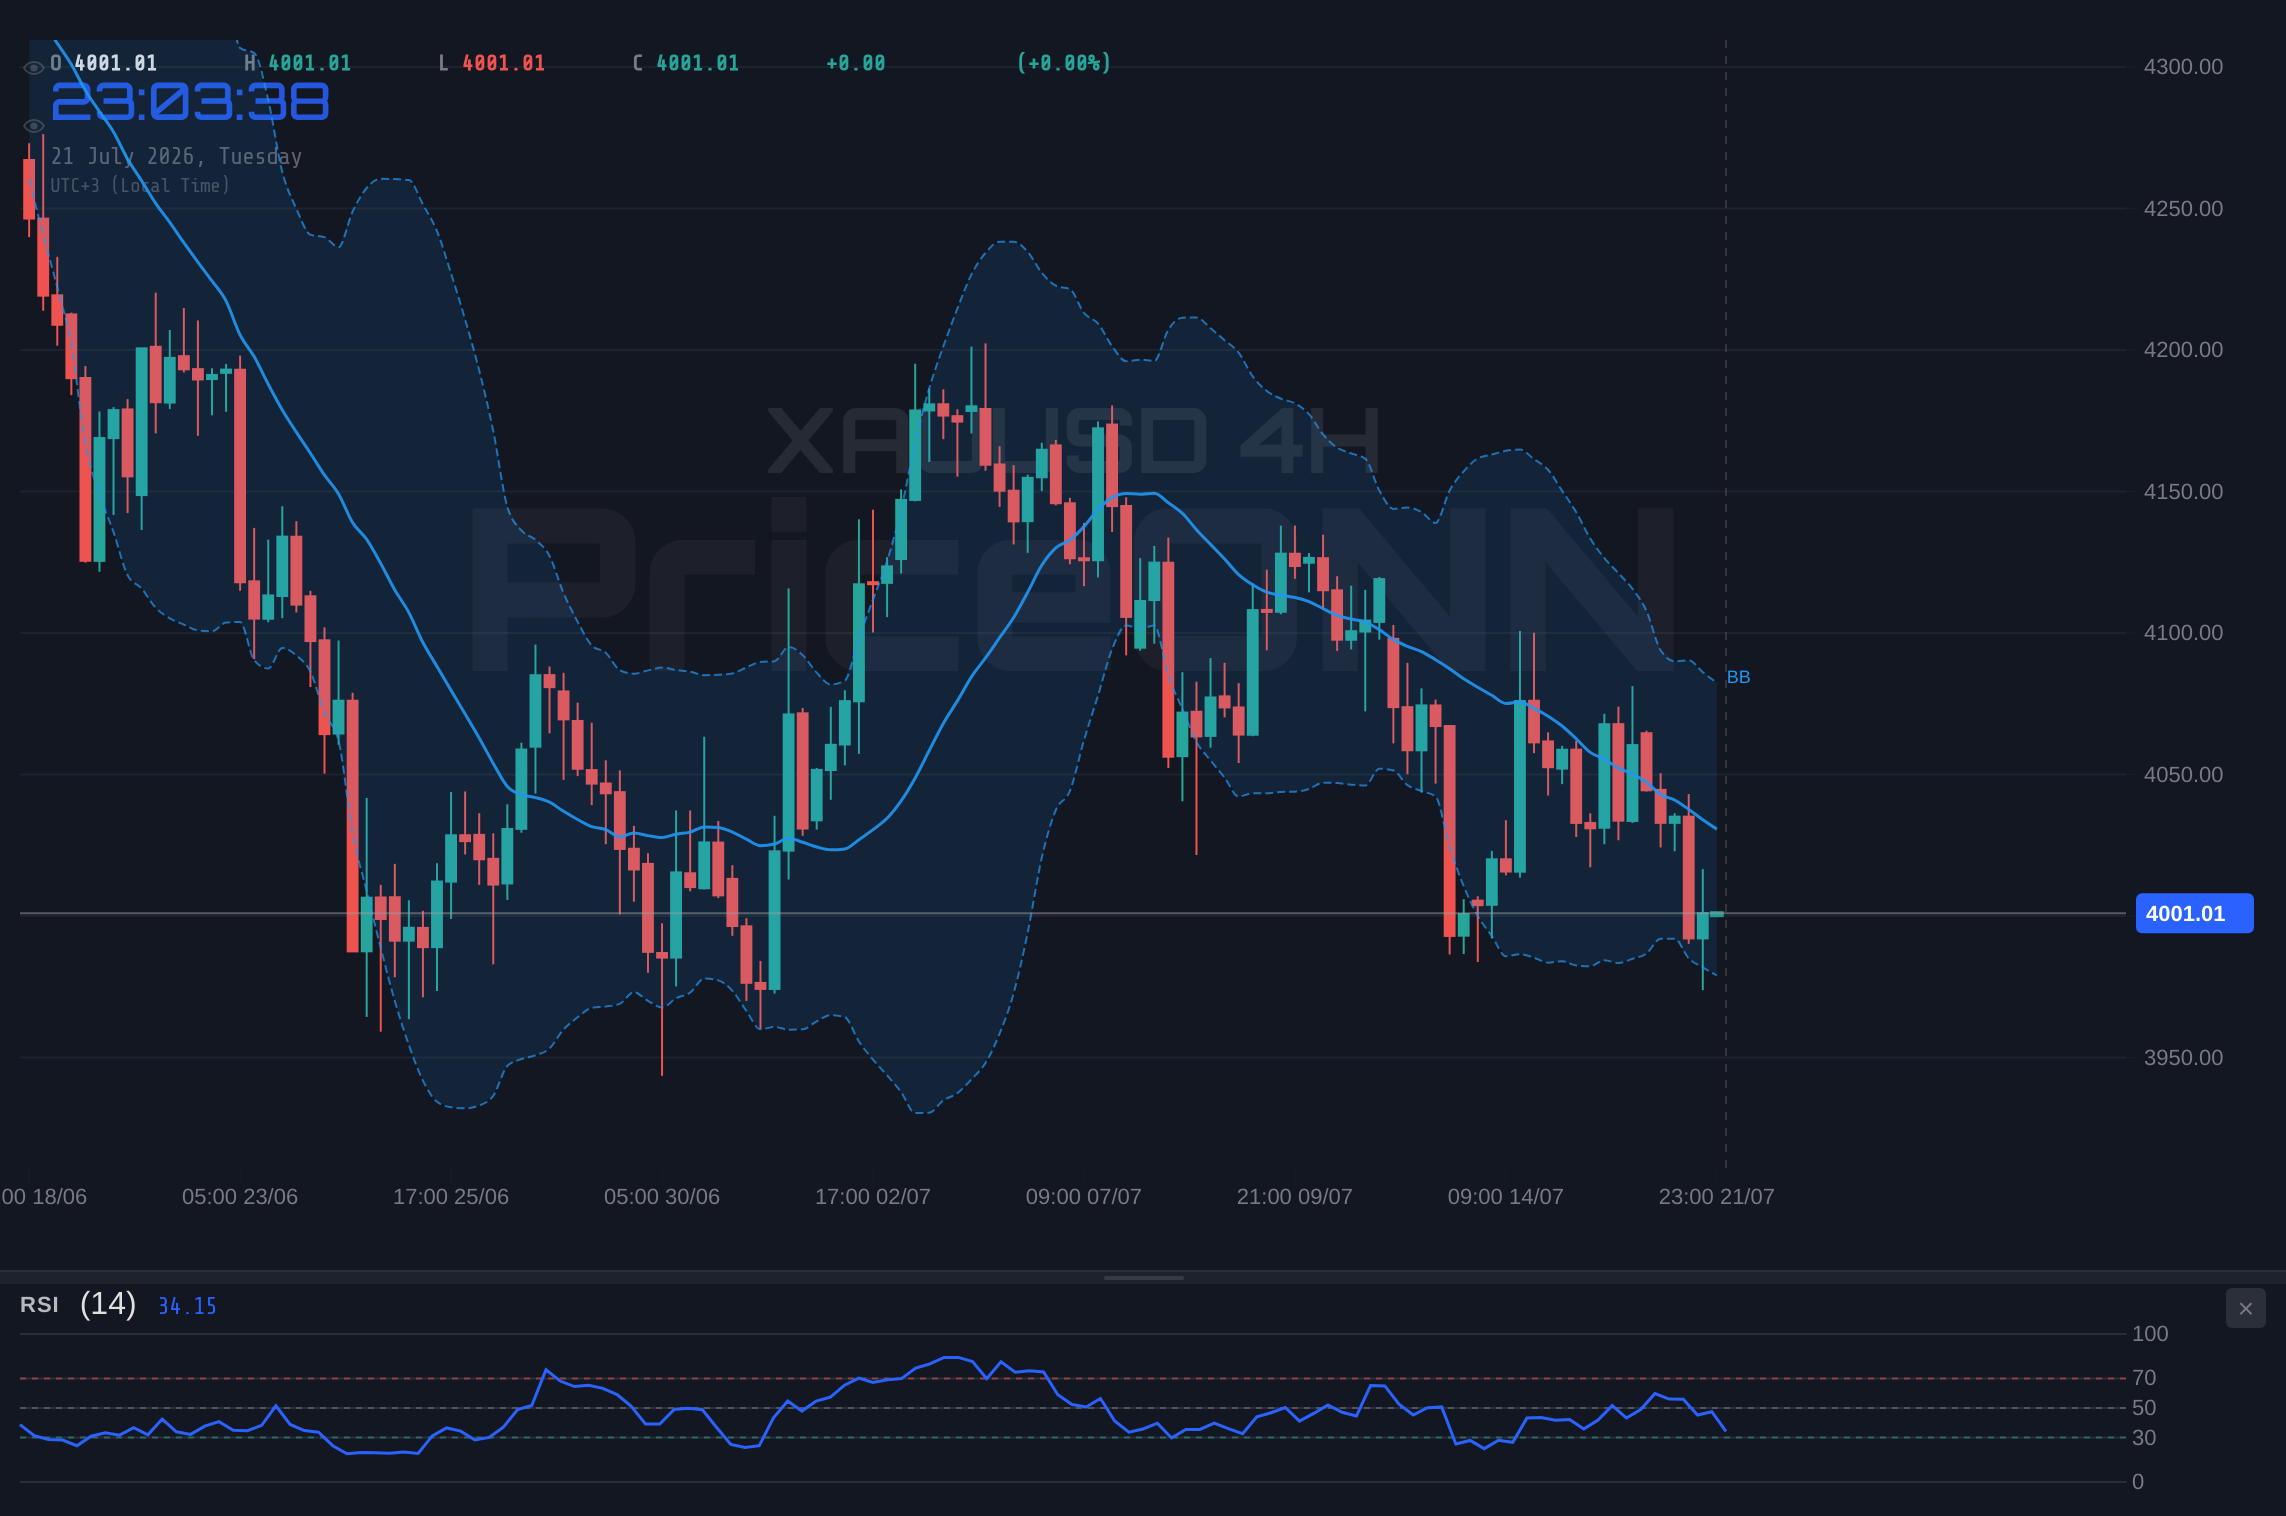
The bearish scenario for XAUUSD is supported by several technical indicators across multiple timeframes. On the 1-hour chart, the RSI is at 37.81, leaning towards oversold but still holding territory that allows for further downside. The MACD is in negative momentum, and the Bollinger Bands are contracting below the middle band, indicating downward pressure. The most immediate concern for bulls is the support level at $3,991.8. A decisive break below this point, especially on increasing volume, would invalidate the short-term bullish argument and open the door for a move towards the next support at $3,976.78. The 4-hour chart reinforces this bearish outlook, with an ADX of 15.79 suggesting a weakening trend, but the Stochastic indicator signaling a clear bearish crossover (%K
The daily timeframe presents a strong bearish signal with an ADX of 39.16, indicating a robust downtrend. The general signal across all timeframes leans heavily towards 'SELL'. The price is currently below the key daily support level of $4,024.67, which now acts as immediate resistance. A failure to reclaim this level quickly could see prices pushed down towards $3,988.95 and subsequently $3,960.65. The daily Stochastic is also in a bearish configuration (%K
The Waiting Game: Navigating the $4000-$4024 Neutral Zone
Between the current price of $4,001.21 and the immediate resistance at $4,019.21, and the support at $3,991.8, lies a tight range where gold could consolidate. This neutral zone is characterized by conflicting signals across different indicators and timeframes. The 1-hour chart shows a neutral ADX (20.26), while the daily chart exhibits a strong downtrend (ADX: 39.16). This suggests a tug-of-war between short-term buying interest and longer-term selling pressure. If gold remains trapped within this range, it could be due to a lack of clear catalysts or a market waiting for confirmation from major economic events, such as upcoming inflation reports or central bank speeches. During such periods, volatility can remain high within the range, leading to whipsaws for traders trying to establish a directional position. The Stochastic oscillator on the 1-hour chart provides a rising signal, while on the 4-hour and daily charts, it indicates a bearish outlook or oversold conditions. This divergence makes it difficult to establish a clear directional bias without further confirmation.
In this consolidation phase, volume is often a key determinant. A lack of significant buying or selling volume as price hovers around $4,000 suggests that neither bulls nor bears have a clear conviction. Traders might be waiting for a decisive break above $4,019.21 or a confirmation of weakness below $3,991.8 to commit to a larger position. The correlation with other markets also plays a role. If the S&P 500 and Nasdaq continue to show strength, it might provide some underlying support for gold, as it could indicate a general risk-on sentiment that doesn't completely abandon precious metals. Conversely, if equity markets turn south sharply, the safe-haven bid for gold might be overshadowed by broader deleveraging. The interplay between the DXY's movement, equity market sentiment, and upcoming economic data releases will likely dictate whether gold breaks out of this consolidation or remains range-bound for an extended period. The absence of a strong trend (as indicated by lower ADX values on some timeframes) means that any breakout needs to be carefully watched for sustainability.
The Verdict: Why Bears Have the Upper Hand (65% Probability)
While gold is currently hovering around a psychologically significant level, the technical indicators across multiple timeframes, particularly the daily chart, present a more compelling case for further downside. The strong ADX of 39.16 on the daily chart signifies a potent downtrend, and the price is currently trading below the key daily support level of $4,024.67. This level now acts as a significant resistance, and failure to reclaim it would likely lead to a continuation of the bearish move. The MACD on the daily chart, despite showing positive momentum, is still susceptible to a reversal if the downtrend reasserts itself. The prevailing sentiment across the 1-hour and 4-hour charts, with their respective sell signals and bearish Stochastic crossovers, reinforces this view. The potential for a strengthening US Dollar, coupled with a general risk-off sentiment in global markets, further supports the bearish thesis. Therefore, the most probable scenario is a continued decline, with a focus on the support levels below $4,000.
The conditions that would validate this bearish outlook include a failure to break back above $4,019.21, a decisive close below the $3,991.8 support, and a sustained rise in the DXY above 100.7. If these conditions materialize, gold could easily find itself testing the $3,976.78 level and potentially heading towards $3,960.65 in the short to medium term. While a bounce from current levels is possible, especially if the DXY falters or geopolitical tensions escalate, the weight of the technical evidence currently favors the bears. The neutral trend strength on shorter timeframes suggests choppiness, but the strong daily trend indicator points towards a likely continuation of the prevailing downward momentum. This outlook suggests that caution is warranted for long positions, and traders should be prepared for potential downside moves.
Bearish Scenario: The Downward Grind
65% ProbabilityNeutral Scenario: Range-Bound Volatility
25% ProbabilityBullish Scenario: Reclaiming the High Ground
10% ProbabilityWhat I'm Watching This Week
The coming days will be crucial for determining the next significant move in gold. My primary focus will be on how price action behaves around the $3,991.8 support level. A failure to hold this level on a daily closing basis, especially if accompanied by a rising DXY, would strongly reinforce the bearish outlook. Conversely, a decisive break and sustained hold above $4,019.21, coupled with a weakening dollar, could signal a short-term reversal. Traders should also keep a close eye on the $4,001.21 intraday levels for signs of capitulation or accumulation. The interplay between these levels and the broader macroeconomic narrative, particularly any shifts in Federal Reserve policy expectations, will be the ultimate decider.
Frequently Asked Questions: XAUUSD Analysis
What happens if XAUUSD breaks below the $3,991.8 support level?
A break below $3,991.8 would invalidate any short-term bullish hopes and likely trigger further selling. The next key target would be $3,976.78, with potential acceleration towards $3,955.54 if momentum picks up significantly. This scenario is favored by a rising DXY and broader risk-off sentiment.
Should I buy gold at current levels of $4,001.21 given the mixed signals?
Buying at current levels without a clear bullish trigger is risky given the prevailing bearish signals on longer timeframes. A more prudent approach would be to wait for a confirmed break above $4,019.21 or a clear oversold bounce on the daily chart, supported by a weakening DXY. The probability for a sustained move higher from here is currently low (around 10%).
Is the RSI at 37.81 a sell signal for XAUUSD right now?
An RSI of 37.81 is not an extreme oversold reading, leaving room for further downside. While it indicates selling pressure has been dominant, it doesn't immediately signal a buy opportunity. A move below 30 would be considered oversold, but the current reading suggests caution is more appropriate than aggressive buying.
How will the DXY's movement affect XAUUSD this week?
The DXY is currently at 100.7, showing strength that typically pressures gold. If the DXY continues to rise above 100.80, it will likely exacerbate gold's decline. Conversely, a fall in the DXY below 100.50 could provide some relief and support for gold prices, especially if coupled with geopolitical concerns.
Technical Outlook Summary
| Indicator | Value | Signal | Interpretation |
|---|---|---|---|
| RSI (14) | 37.81 | Neutral | Nearing oversold, but still room to fall. |
| MACD Histogram | -15.20 | Bearish | Negative momentum confirmed. |
| Stochastic | K=40.52, D=37.27 | Bullish Crossover | Short-term buy signal, needs confirmation. |
| ADX | 20.26 | Neutral | Weak trend strength, suggesting range-bound conditions. |
| Bollinger | Middle Band | Below | Price is below the mean, indicating downward pressure. |
Key Levels
Support Levels
Resistance Levels
Track markets in real-time
AI-powered analysis, technical indicators and real-time price data.
Join Our Telegram Channel
Breaking market news, AI analysis and trading signals instantly.
Join Channel