

The global financial stage is currently a complex tapestry of competing forces, with a notable shift in risk appetite impacting precious metals like silver. As traders navigate the choppy waters influenced by evolving central bank expectations and geopolitical undercurrents, the price action in XAGUSD at $56.16 demands close attention. This isn't just another day in the markets; it's a critical juncture where technical indicators and macroeconomic narratives converge, painting a picture of potential volatility and strategic opportunities for those who can decipher the signals.
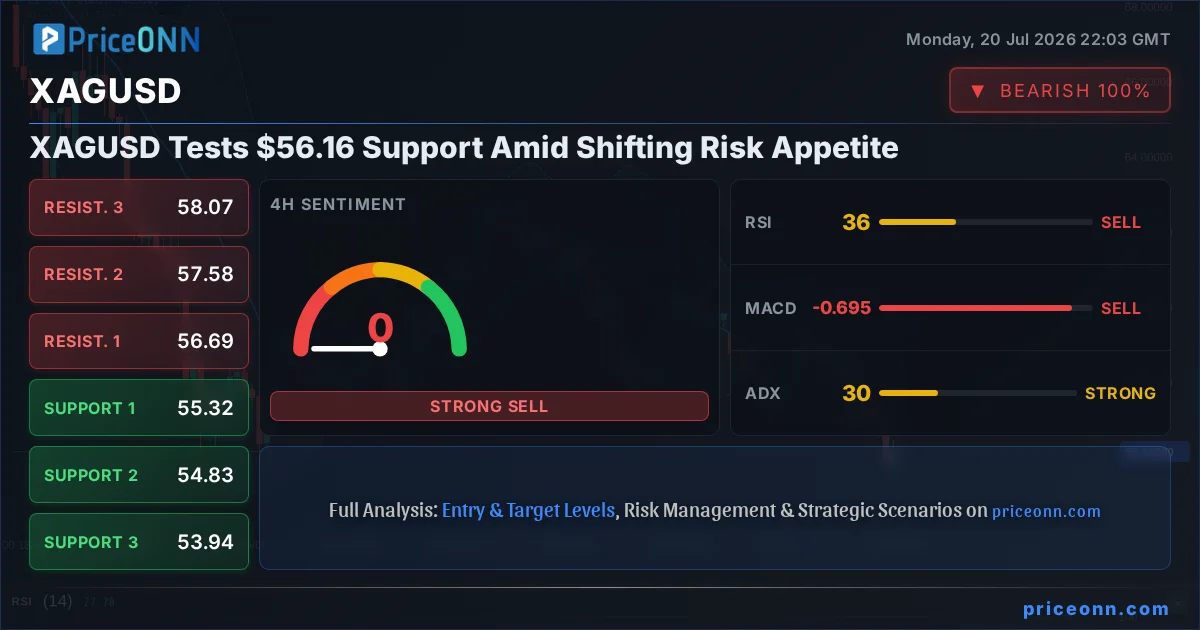
- Silver (XAGUSD) is trading at $56.16, with a strong downward trend indicated by the 1D ADX at 42.27.
- Key support levels to watch are $55.97 (1H), $55.32 (4H), and $54.10 (1D), while resistance is eyed at $56.52 (1H), $56.69 (4H), and $58.99 (1D).
- The RSI at 34.24 on the daily chart suggests room for further downside before becoming oversold, despite a mixed stochastic signal.
- The US Dollar Index (DXY) is at 100.7, showing strength that typically pressures commodities like silver.
The current environment, marked by fluctuating risk sentiment, is a fertile ground for assets like silver, often seen as both a safe haven and a commodity sensitive to industrial demand. The recent surge in WTI Crude Oil prices, driven by U.S.-Iran tensions, initially suggested a broader inflationary tilt, which usually benefits gold and silver. However, the narrative appears to be splitting. While oil prices climb, reflecting specific geopolitical risks, the broader market's reaction is more nuanced. Equity indices like the S&P 500 and Nasdaq 100 have shown weakness, with the Nasdaq 100 down 1.16% to 29164.86, indicating a potential cooling of risk appetite. This risk-off sentiment often drives capital towards traditional safe havens, but the simultaneous pressure on silver suggests other factors are at play, possibly including a strengthening US Dollar.
The US Dollar Index (DXY) currently stands at 100.7, exhibiting a bullish bias on the 1-hour chart and holding above key support on the daily. This strengthening dollar acts as a headwind for dollar-denominated commodities like silver, making them more expensive for holders of other currencies. The interplay between oil prices, equity market sentiment, and dollar strength creates a complex picture for silver. While the geopolitical escalation in the Middle East, which briefly pushed Brent Crude over $90, might normally ignite a broad commodity rally, the persistent strength of the dollar and a cautious undertone in equities are tempering this effect on silver. Traders are therefore scrutinizing the $56.16 price point with heightened intensity, looking for clues on whether this is a temporary dip or the start of a more significant downtrend.
Navigating the Technical Landscape: A Multi-Timeframe View
Hourly Momentum and Divergence
On the 1-hour chart, silver presents a mixed technical signal, a common characteristic of assets caught between conflicting market forces. The trend is currently neutral with a moderate 50% strength, but the overall signal leans towards 'SELL' based on a composite of indicators. The ADX at 20.26 suggests a moderately strong downtrend is in play, which aligns with the negative momentum seen in the MACD, with the MACD line below its signal line. The RSI(14) sits at 37.81, firmly in neutral territory and showing a downward inclination, indicating that while not yet oversold, sellers have a slight edge. However, the Stochastic oscillator offers a counter-signal, with %K at 40.52 and %D at 37.27, showing %K above %D and hinting at a potential upward correction or a slowing of the bearish momentum. This divergence between the RSI and Stochastic on the hourly chart is a key point of observation; it suggests that while the immediate pressure is downwards, there might be fleeting opportunities for buyers to test resistance levels, particularly at 40.19. The Bollinger Bands also confirm the bearish lean, with the price trading below the middle band, signaling a downward bias in this shorter timeframe.
Intraday Support and Resistance Dynamics
The intraday support and resistance levels provide a more granular view of the immediate battleground for XAGUSD. On the 1-hour timeframe, the immediate support lies at $3991.8, followed by $3976.78 and $3964.39. These are the levels where buying interest might emerge if the price continues to slide. Conversely, resistance is seen at $4019.21, $4031.6, and $4046.62. A break and hold above these resistance levels would be necessary to challenge the prevailing bearish sentiment on this short-term chart. The fact that the current price of $56.16 is below the 1-hour resistance of $4019.21 underscores the immediate selling pressure. The data shows a significant drop from yesterday's high, with the daily change at -1.46% (-59.19), highlighting the strength of the recent sell-off. This price action suggests that any short-term rallies are likely to be met with selling pressure as traders react to the broader market's risk-off sentiment and the stronger dollar.
The 4-Hour Chart: Confirming the Bearish Trend
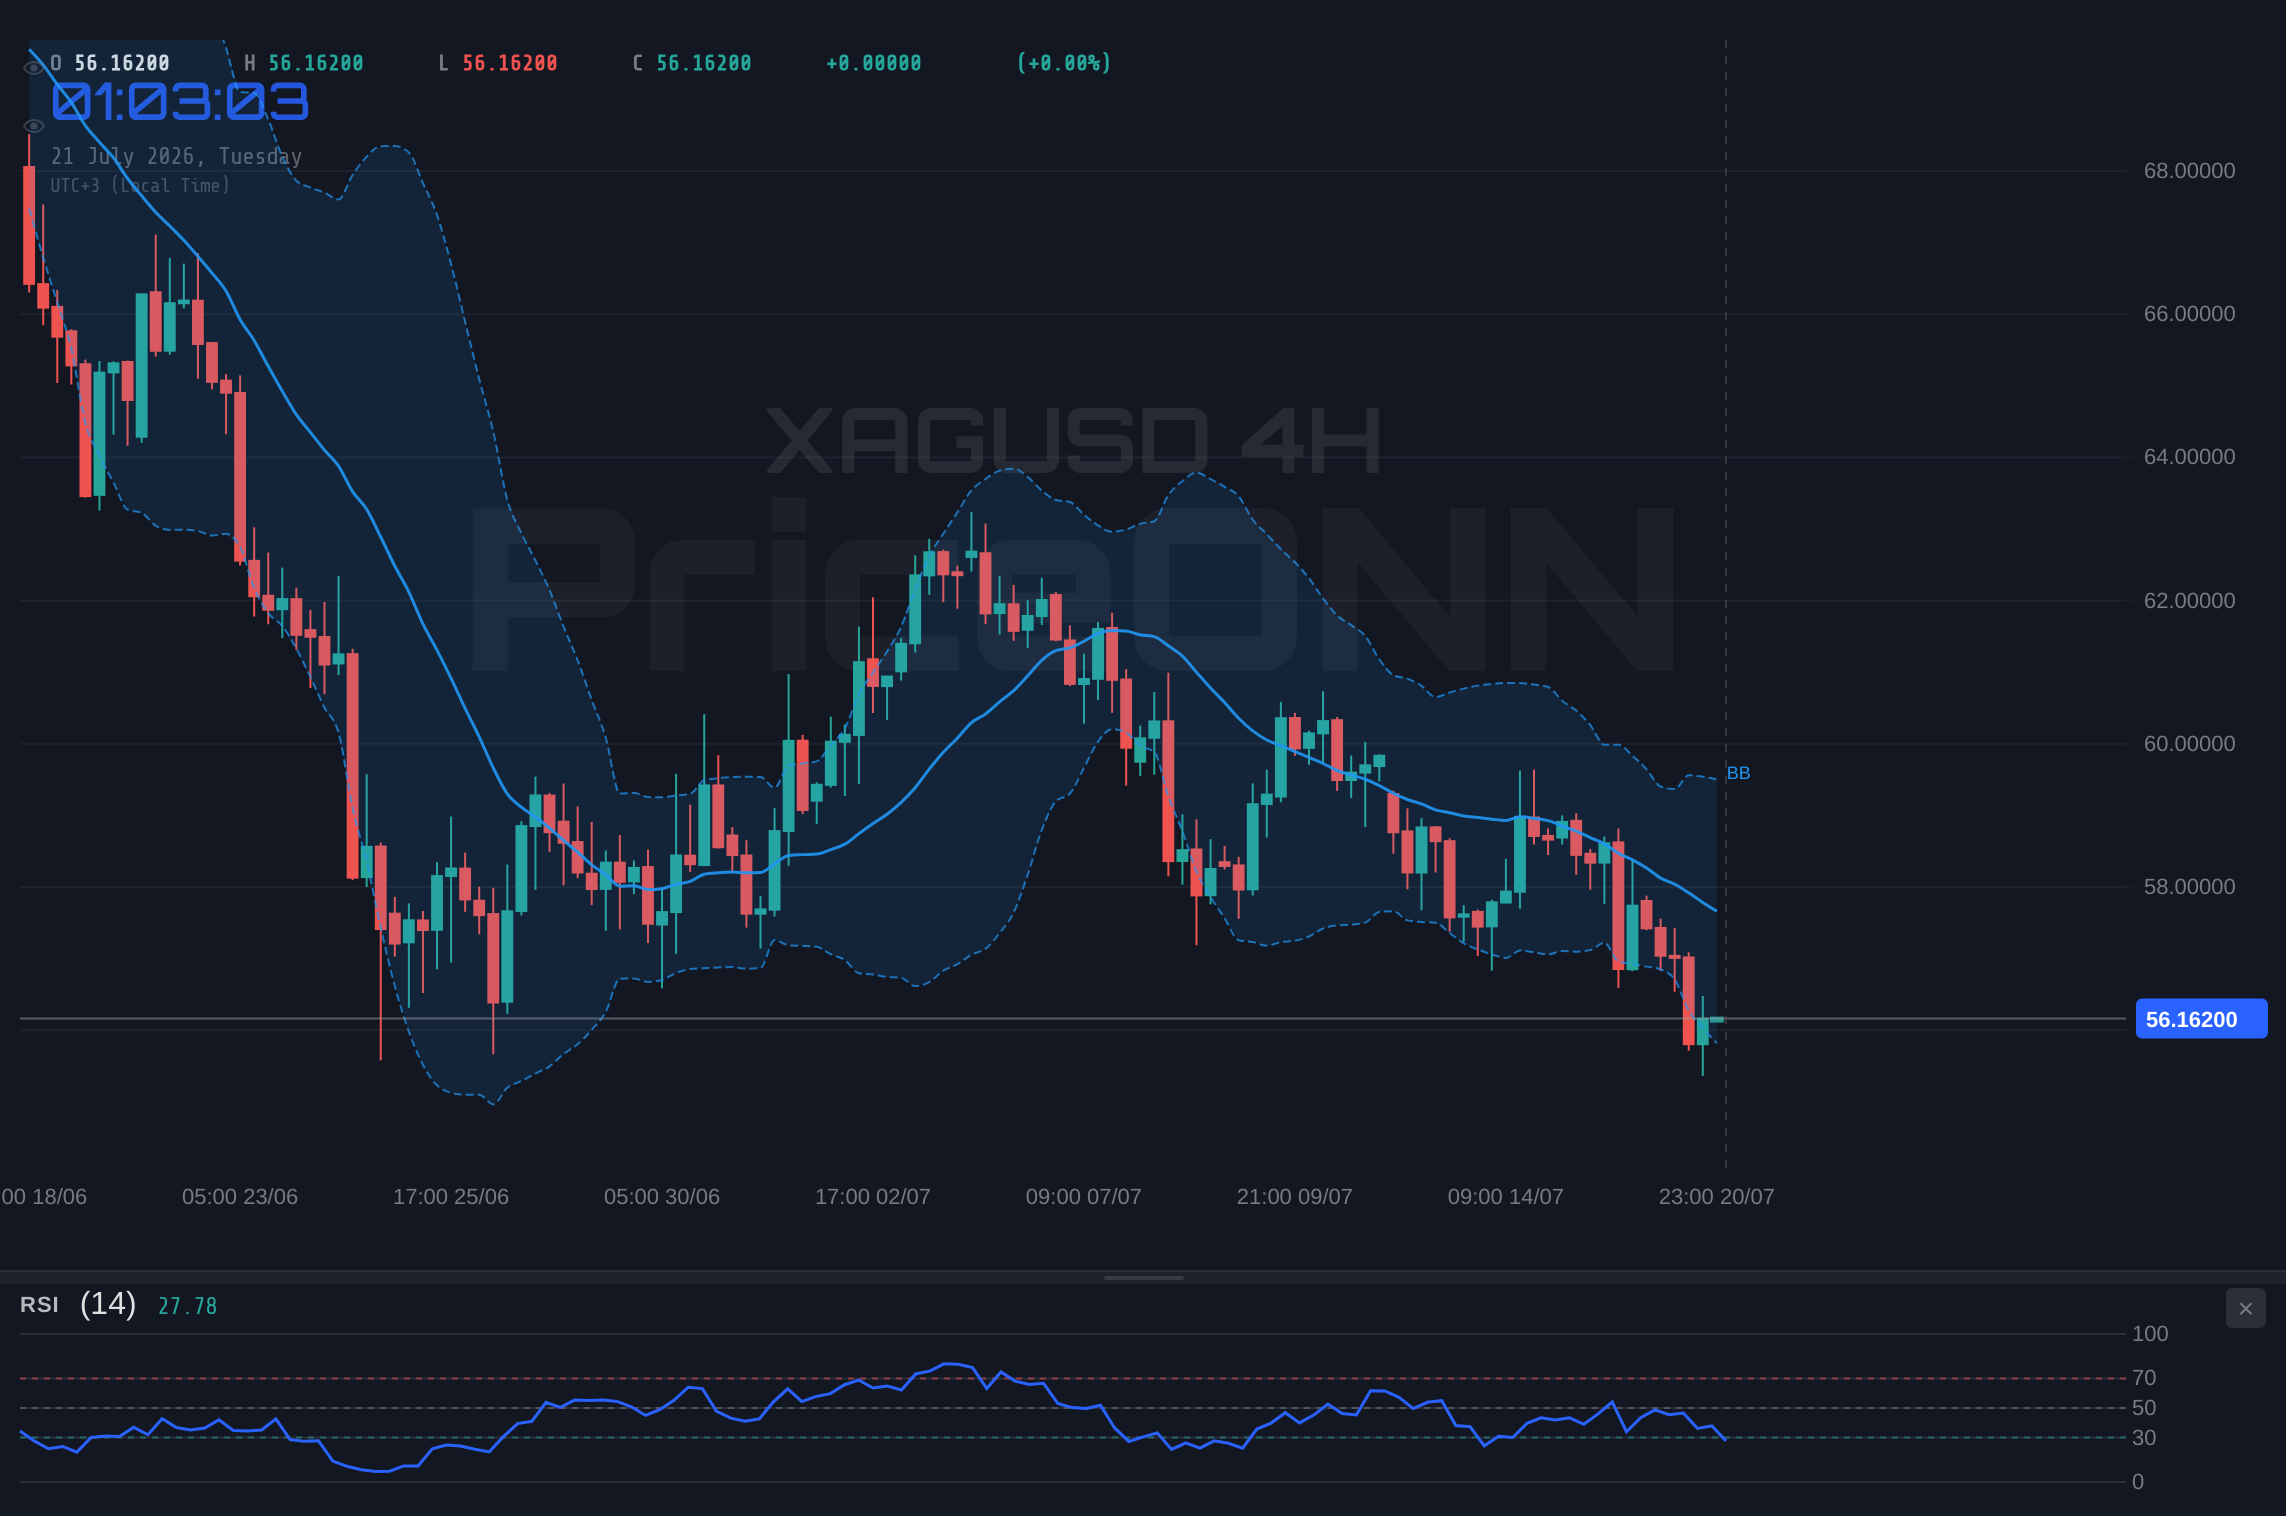
Stepping back to the 4-hour chart, the technical picture for silver becomes more decisively bearish. The trend is classified as 'Düşüş' (Downtrend) with a strong power rating of 83%. This aligns with the overall market sentiment and the pressure exerted by the DXY. The support levels are more pronounced here, starting at $3973.82, then $3955.54, and further down at $3920.9. These are significant levels that could halt a steeper decline, but the current trajectory suggests they might be tested. Resistance levels are identified at $4026.74, $4061.38, and $4079.66. The RSI(14) at 40.59 reinforces the bearish bias, staying in neutral territory but trending downwards, indicating ample room before reaching oversold conditions. The MACD remains negative, with the MACD line firmly below its signal line, confirming bearish momentum. Similarly, the Stochastic oscillator provides a clear sell signal, with %K (18.51) below %D (31.25) and pointing lower. The ADX at 15.79, however, indicates a weaker trend on this timeframe, suggesting a potential for consolidation or a less aggressive downtrend compared to the daily chart. Nevertheless, the 'Genel Sinyal' (Overall Signal) for the 4-hour timeframe is a strong 'SAT' (SELL), with zero buy signals and eight sell signals, reinforcing the bearish outlook.
The Bollinger Bands on the 4-hour chart also show the price trading below the middle band, a classic sign of bearish pressure. This consistent bearish alignment across multiple indicators on the 4-hour timeframe suggests that the current price of $56.16 is vulnerable to further declines. The news regarding the silver bears missing their chance on Friday, only for the metal to quickly regain footing, seems to be a short-lived reprieve. The underlying trend, as depicted by the 4-hour indicators, remains firmly tilted to the downside. Any upward movement is likely to be a counter-trend rally, a chance for sellers to re-enter the market at better prices, rather than the start of a sustained recovery. This is a critical observation for traders looking to position themselves in the silver market.
Daily Chart: The Dominant Downtrend
The daily chart provides the most compelling evidence of the prevailing bearish trend for XAGUSD. The trend is unequivocally 'Düşüş' (Downtrend) with an overwhelming power rating of 95%. This macro-technical view is crucial for understanding the larger market forces at play. The daily support levels are significantly lower, starting at $4024.67, then $3988.95, and $3960.65. These are substantial downside targets if the current momentum continues. Resistance is located at $4088.69, $4116.99, and $4152.71, levels that seem distant given the current price action. The RSI(14) at 38.86 continues the narrative of bearish inclination, hovering in neutral territory and suggesting that the market is far from being oversold. This implies that there is considerable room for prices to fall further before buyers step in aggressively. The MACD on the daily chart presents a slight anomaly: it shows positive momentum with the MACD line above the signal line. This could indicate that the downtrend is losing some steam or that a potential bullish divergence is forming, although it's not yet confirmed by price action. However, the Bollinger Bands remain below the middle band, confirming the bearish trend. The Stochastic oscillator also gives a clear sell signal (%K at 26.18, %D at 44.73), reinforcing the bearish sentiment. The ADX at 39.16 is particularly noteworthy, indicating a strong, established downtrend. This confluence of daily indicators, despite the MACD's momentary positive momentum, solidifies the 'SAT' (SELL) signal, with one buy signal against seven sell signals.
The persistent weakness in silver, even as oil prices react to geopolitical events, suggests that the strength of the US Dollar and a broader risk-off sentiment are the dominant drivers. The recent news about Canada's headline CPI cooling slightly in June, while not directly impacting silver, contributes to a narrative of potentially moderating inflation globally. This could reduce the appeal of silver as an inflation hedge, further supporting the bearish case. The current price of $56.16 is precariously positioned, and the strong daily downtrend indicated by the ADX suggests that further downside is more probable than a swift recovery. Traders should be wary of attempting to catch a falling knife without clear confirmation of a trend reversal. The strong daily trend signals caution for any bullish positions.
Correlations and Macroeconomic Influences
The Dollar's Grip on Silver
The relationship between the US Dollar Index (DXY) and silver prices is a cornerstone of commodity market analysis. Currently, the DXY is at 100.7, showing a bullish trend on the 1-hour chart and holding steady above critical support levels on the daily. This strength in the dollar typically acts as a significant headwind for silver. As the dollar appreciates, silver becomes more expensive for international buyers, dampening demand. Furthermore, a stronger dollar often reflects increased global risk aversion or expectations of tighter monetary policy, both of which tend to reduce investment in commodities like silver. The 'Genel Sinyal' for DXY on the 1-hour chart is 'AL' (BUY), with a strong ADX of 27.71, confirming upward momentum. While the 4-hour DXY chart shows a 'SAT' (SELL) signal and negative MACD momentum, the dominant 1-hour bullish trend and the daily chart's neutral stance with a slight upward bias suggest the dollar is likely to remain a supportive factor, if not a dominant one, for the near term. This persistent dollar strength is a key reason why silver, despite some bullish technical signals on shorter timeframes like the 1-hour Stochastic, is struggling to find sustainable upside momentum.
Equities and Risk Sentiment
The performance of major stock indices provides another crucial layer of context for silver's price action. The Nasdaq 100, a bellwether for risk appetite, is currently trading down 1.16% at 29164.86. This decline, coupled with the S&P 500's more modest gains suggesting a divergence or a potential weakening of broader market strength, points towards a cautious or risk-off sentiment in the market. When risk appetite wanes, investors often move capital away from riskier assets like equities and commodities towards safer havens such as the US dollar or government bonds. While silver can act as a safe haven, its industrial commodity aspect means it can also suffer during periods of economic slowdown or heightened uncertainty that accompany risk-off environments. The daily chart for the S&P 500 shows a strong downtrend with an ADX of 47.51, reinforcing the idea that the broader equity market is under pressure. This negative correlation between equities and silver during risk-off periods, driven by capital reallocation, is a significant factor contributing to the downward pressure on XAGUSD at $56.16.
Oil Prices and Inflationary Pressures
The energy market, particularly Brent Crude oil, is currently exhibiting volatility driven by geopolitical tensions. Brent briefly broke $90 after fresh Iran escalations, and WTI crude oil has surged on U.S.-Iran tensions. This rise in oil prices can signal increasing inflationary pressures, as energy costs are a significant component of inflation. Historically, rising inflation has been a tailwind for precious metals like silver, which are often seen as a hedge against currency debasement and rising price levels. However, the current market reaction shows a decoupling. While oil is reacting strongly to supply-side geopolitical risks, silver is not fully participating in the rally. This suggests that either the market is discounting the inflationary impact of higher oil prices, or the other dominant factors – a strong dollar and risk aversion – are outweighing the inflation hedge narrative for silver. The WTI price at $79.59 and Brent at $83.79, while elevated, are not yet at levels that typically trigger a full-blown inflation panic across all commodities, especially when the dollar is strong. This complex interplay means that while rising oil prices might offer a potential floor, they are not currently acting as a catalyst for a significant silver rally.
Trade Scenarios and Outlook
Bearish Scenario: Downside Continuation
65% ProbabilityNeutral Scenario: Consolidation Around $56.16
25% ProbabilityBullish Scenario: Short-Covering Rally
10% ProbabilityThe technical indicators and market correlations strongly suggest that the path of least resistance for XAGUSD is to the downside in the short to medium term. The daily chart's ADX at 39.16 confirms a strong downtrend, and the RSI at 38.86 indicates ample room for further decline before hitting oversold territory. While the 1-hour Stochastic oscillator offers a slight bullish divergence, it's not yet confirmed by price action and is overshadowed by the broader bearish signals. The DXY at 100.7 remains a key factor, and the risk-off sentiment evident in the Nasdaq 100's decline further supports a bearish outlook. Therefore, the most probable scenario involves a continuation of the downtrend, with key levels to watch being the immediate support at $3991.8 and the more significant 4-hour support at $3973.82. A break below these levels could open the door for a test of the $3955.54 region. Conversely, any rallies are likely to face stiff resistance, particularly around the $4019.21 mark on the 1-hour chart, which would need to be decisively cleared to invalidate the bearish thesis.
The current price of $56.16 is a critical pivot point. Given the prevailing bearish sentiment, any upward movements should be viewed with skepticism, likely representing short-covering rallies or minor pullbacks within a larger downtrend. The RSI on the daily chart at 38.86 suggests that the market is not yet oversold, leaving significant room for prices to fall further. The MACD on the daily chart showing positive momentum is a slight counter-signal, but it is currently overshadowed by the strong ADX trend strength and the bearish signals from other indicators and timeframes. The news of Canada's CPI cooling adds to the narrative that inflation might be moderating, which could reduce the appeal of silver as an inflation hedge. This combination of technical weakness and moderating inflation expectations paints a challenging picture for silver bulls in the immediate future. Patience and strict risk management will be paramount for traders navigating this environment.
Frequently Asked Questions: XAGUSD Analysis
What happens if XAGUSD breaks below the $3973.82 support level?
If XAGUSD breaks decisively below the $3973.82 support level on the 4-hour chart, it would confirm the strength of the bearish trend. The next significant downside target would likely be the $3955.54 support, indicating a further 0.5% drop from current levels.
Is the RSI at 34.24 on the daily chart a buy signal for XAGUSD at $56.16?
No, an RSI reading of 34.24 on the daily chart is not considered a buy signal in isolation; it simply indicates that silver is not yet oversold. The RSI suggests there is ample room for further price declines before the market reaches oversold territory, reinforcing the bearish outlook.
How is the strength of the US Dollar Index (DXY) at 100.7 impacting XAGUSD?
The DXY's current level of 100.7, exhibiting a bullish trend on shorter timeframes, exerts downward pressure on XAGUSD. A stronger dollar makes silver more expensive for holders of other currencies and typically accompanies risk-off sentiment, both of which are bearish for the metal.
What should traders watch for to confirm a potential trend reversal for XAGUSD?
Traders should watch for a decisive break and hold above the 1-hour resistance at $4019.21, coupled with a shift in daily indicators towards bullish signals, such as RSI moving above 50 and MACD confirming upward momentum. Until then, the bearish trend remains dominant.
Track markets in real-time
AI-powered analysis, technical indicators and real-time price data.
Join Our Telegram Channel
Breaking market news, AI analysis and trading signals instantly.
Join Channel